Research CoronaCrisis (2020)
DISCLAIMER: The content of this material represents a general view of the market news and does not take into consideration individual readers’ personal circumstances, investment experience or current financial situation. The content of this material constitutes Marketing Communication or Investment Rеsеаrсh and does not constitute Investment Аdviсе. Indication Investments Ltd and/or its brands may provide general commentary that is not intended as investment аdviсе and must not be construed as such. Indication Investments Ltd shall not accept any responsibility for any losses of traders due to the content of this material or its use.
Indication Investments Ltd assumes no liability for errors, inaccuracies or omissions. Further, it does not guarantee the accuracy or completeness of information, text, graphics, links or other items contained within these materials.

Pronto ad iniziare?
Unisciti alle migliaia di utenti di Libertex.
L’83% dei conti degli investitori retail perde denaro
INTRODUCTION
Yet I do not believe that the world about us will ever again be as it was of old, or the light of the Sun as it was aforetime.
The Lord of the Rings, J. R. R. Tolkien
CoronaCrisis. Simply unprecedented.
Fantasy has become reality. Everything epidemiologists talked about in 2014-2015, when they assessed humanity's vulnerability after the SARS and H1N1 swine flu epidemics, has come to pass. COVID-19 has shown to what extent humanity was unprepared for an epidemic, even in countries with highly developed healthcare systems.
The world today is faced with a dire biological threat that it must combat through unprecedented measures. And that's not even to achieve complete victory over the virus and economic downfall. No, these measures aim simply to reduce the strain on healthcare systems and mitigate the negative consequences.
Quarantine measures have put the brakes on the world's top economies. The forecasts of the virus' impact on the world economy sound apocalyptic. Some most estimates foresee global GDP falling a minimum of 1% this year, losing $2.7 trillion in wealth. Some authoritative investment banks are issuing more ominous predictions, in which the US economy — the world's largest — could lose 35% in one quarter. That's significantly more than during the entire mortgage lending crisis. Unlike the 2008-2009 crisis, this recession is more than just financial: it's economic. Supply chains are being ripped apart, resulting in international trade toppling like a house of cards. In a new report, the International Labour Organisation assesses 25 million jobs cut globally and income losses in the range of $860 billion to $3.4 trillion.
From 1918 to 1920, exactly 100 years ago, the world experienced the Spanish Flu, which struck approximately 30% of the Earth's population and killed 17 to 100 million people, according to various estimates. The global economy shrunk by 6% in the wake of the Spanish Flu and entered a prolonged recession that some countries only fully emerged from in the late 1930s. In 2006, Australian researchers Warwick McKibbin and Alexandra Sidorenko came to the conclusion that even in a relatively mild pandemic is capable of slowing global GDP growth by 0.8%, while a more dismal scenario sees the world economy falling by 12.6%, the equivalent of over $7.5 trillion.
Some of you may say, "It can't be". But these days, it's best to steer clear of these expressions because we're living in a world when anything can happen. Just take these cases as potential examples: the US cedes its role as world hegemon, the Eurozone breaks up, and oil is given away for free. The latter, by the way, is already happening.
We created this report to share our vision of this situation with you. Our goal is not just to put on display real problems that the world is confronting economically and socially; it's also to assess the performance of the measures governments are taken, as well as the timeframes and prospects for recovery. This report also offers assessments of the CoronaCrisis' consequences and provides an analysis of what to expect from different groups of assets — such as fiat and cryptocurrencies, commodities and precious metals and indexes and stocks. You'll also learn which strategies to use in this time of uncertainty.
We wish you and your families health, wealth and prosperity. And remember:
"An optimist sees the opportunity in every difficulty". Sir Winston Churchill.
Pandemics and epidemics: their phases/stages
History repeats itself
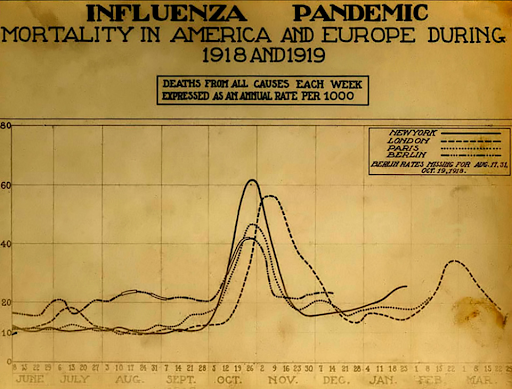
In the autumn of 1918, New York City police arrested over 500 people for spitting on the sidewalk. They didn't do so to keep the streets clean or to impose good manners. At that time, the United States' largest cities, such as New York and Philadelphia, were under quarantine, with large portions of their population bedridden. The closures affected bars and restaurants. Sporting events and public gathers — even funerals — were banned. The world was at scrambling to fight a new type of influenza that was dubbed the 'Spanish Flu'.
To this day, scientists debate how many victims fell to that pandemic, although even the minimum estimate of around 20 million people makes it clear that the flu outbreak was deadlier than even World War I. Approximately 550 million people caught the disease, about 30% of the total world population at the time. It's believed that only one place escaped the illness: the island of Marajó on Brazil's Amazon delta.
The economic consequences of the Spanish Flu
Studies of the Spanish Flu's economic consequences are complicated by the pandemic's outbreak immediately after the end of World War I, which makes it extremely difficult to differentiate between what was a consequence of the disease and what stemmed from the war's destruction. There is no in-depth economic research or the necessary data on this topic, a fact noted in research into this issue conducted by Thomas A Garret, assistant vice president and research economist at the Federal Reserve Bank of St Louis in the United States. Many economic historians, however, agree that the short-term economic consequences included:
- A 6.6% fall in US real GDP
- Labour shortages and wage growth
- An expansion of the social welfare system.
According to one such report that recorded 272,500 deaths resulting from the Spanish Flu among men in 1918, nearly 49% were aged between 20 and 39, while only 18% were under the age of 5 and 13% were older than 50. The fact that primarily men aged 18 to 40 succumbed to the flu bore serious economic consequences for families that had lost their primary breadwinner.
The pandemic also inflicted long-term economic effects.
Professor of Economics Douglas Almond at Columbia University studied the epidemic's influence on children conceived or born during the outbreak. It turned out that so-called children of the epidemic significantly more often fell ill later on in life and had a higher likelihood of experiencing serious medical problems, such as schizophrenia, diabetes or stroke. All other things being equal, they had a 15% lower likelihood of finishing middle school than their peers and earned 5-7% less.
| Epidemic | Economic damage |
| 1957 Asian Flu | $32 billion |
| H5N1 flu (avian flu) in 2003-2005 | $10 billion (Asia) |
| Ebola epidemic in 2014-2015 | 8% of Liberia's GDP |
| H1N1 swine flu | $59 billion |
Table. Epidemics' economic damage
Source: WHO, online sources
By analyzing the Spanish Flu and projecting it on the COVID-19 pandemic, we can see that it won't likely cause significant changes in labour resources since the 18-39 age group is not affected by complications associated with the disease.
It's important to consider that the Spanish Flu was a much more dangerous disease than is COVID-19. Contemporaries described its course as follows: "Generally, the illness appeared in a healthy person in the morning. By the evening, it had caused a bloody cough. A few hours later, it was very likely that death had taken the afflicted".
Nevertheless, even in its initial stages, the COVID-19 pandemic palpably paralysed the world economy. We can expect to see the creation of global mechanisms to more quickly identify new dangerous illnesses and to react to them. Governments will undoubtedly expend more on medicines. It would also be no surprise to see the creation of free production capability to manufacturing vital medical equipment, tests and personal protective equipment.
In order to better understand COVID-19's possible economic consequences, we need a quick crash course in virology.
Virology 101
Any viral epidemic develops according to clear rules. The epidemic first starts to grow quickly, then reaches its peak and begins to fall. If we chart the number of new infections, deaths or the number of sick, the epidemic's totals show a bell curve.
Source: Wikipedia
Every virus is defined by two main characteristics: its virulence (ability to spread) and its case fatality rate, or death rate.
Virulence is directly correlated to the speed with which the epidemiological cycle develops. The higher the virulence is, the faster the cycle develops, and the more cases appear simultaneously. With so many cases appearing at the same time, the healthcare system becomes overloaded. As a result, a fair share of deaths is caused by the lack of proper care rather than by the disease itself.
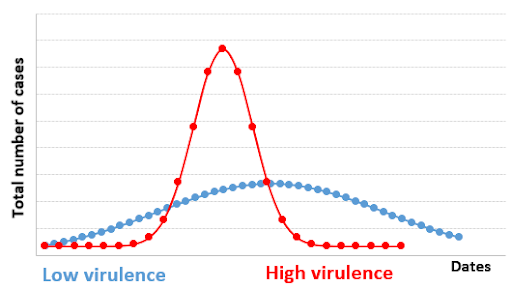
Source: authors' own calculations
The second factor to consider is the death rate. When it is low, and the course of the disease is light, no special measures are needed, even with high virulence. However, if the death rate is high, there's a risk that the healthcare system may collapse, which can lead to more deaths.
When both high virulence and a high case fatality rate occur simultaneously, the most effective measure is implemented: quarantine. Its primary goal is not to prevent everyone from contracting the disease, which is impossible, but to flatten the curve of new cases so that medical professionals have more time to find a cure and to prevent the healthcare system from collapsing.
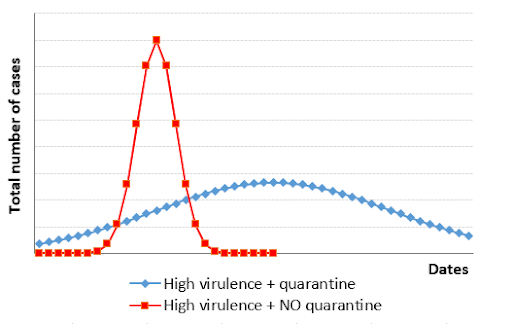
Source: authors' own calculations
Problems with the COVID-19 epidemic in its early stages
As we have just noted, when a new virus appears, epidemiologists need to understand two main characteristics to develop a sustainable and surefire way to fight the virus: its virulence and death rate.
Now imagine dealing with a virus that is asymptomatic for a significant number of patients, while having almost no test system available. We can't estimate its virulence nor its death rate because we don't have enough data on the number of total cases.
Add to that the fact that the virus affects only a specific age range and is not well-researched. Only one thing is clear for now: older adults often develop complications in the form of pneumonia. It doesn't happen overnight; the effect is delayed. As such, the healthcare system will have a clue of what it's dealing with only when the hospitals will start filling up with people that have these complications, 10-14 days later. Considering its high virulence, the virus will already significantly spread during this time.
There is only one measure left: to quarantine everyone to ease the burden on the healthcare system.
Analysing COVID-19 outbreaks
As of the time of writing this article, the medical community didn't have a clear idea of what COVID-19's virulence is, but, judging by everything, it's most likely high. Much higher than the seasonal flu's. It also has one nasty detail. The people who are asymptomatic can also be contagious, which increases the risk of overloading the healthcare system.
The death rate for young and middle-aged adults is comparable to that of the seasonal flu. Nevertheless, it increases dramatically for older adults. Even if we take data from Italy, the country with the most deaths, we can still clearly see this pattern.
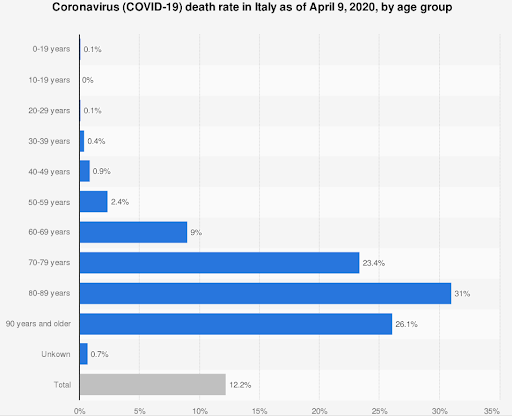
Source: Statista.com
Let's analyse how long the outbreaks have lasted. In Wuhan, China, quarantine was implemented only after the healthcare system was already overloaded with patients experiencing complications. In other words, after the virus had already spread so much that fighting it with surgical precision was no longer possible. The outbreak lasted for about two months here.
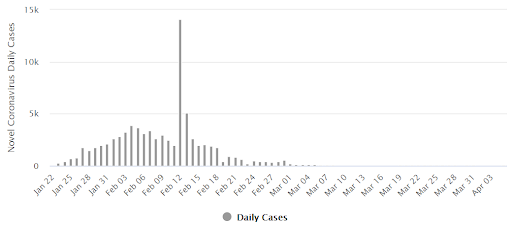
Source: Johns Hopkins University
What tells us that the virus was spreading uncontrollably in Wuhan is that the authorities reopened the region after the first day with no new cases. That said, the authorities were confident that 70-80% of the population already had the disease, and that at least this region has developed herd immunity.
We can observe similar dynamics in Italy, as well: a month before it peaked and about a month of slowing down.
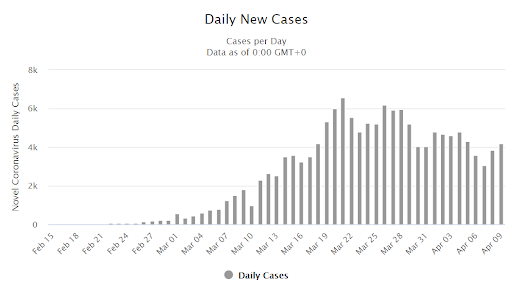
Source: Johns Hopkins University
Taking into account that the country initially saw poor compliance with the quarantine measures, the outbreak may last longer. Spain is showing a similar outbreak duration. When tracking new cases in the United States, we can see a similar pattern.
Main case scenarios
First wave.
We are dealing with a highly contagious virus that is primarily dangerous to older adults and people with chronic illnesses. This virus is less dangerous than other well-known viruses. Nevertheless, there is a huge risk of overloading the healthcare system and experiencing high death rates for at-risk groups.

Source: WHO
During the first wave of COVID-19, as the healthcare system struggles under the brunt of incoming new patients with complications, very strict isolation and social distancing measures are implemented. In this case, the outbreak comes to an end in 1.5-2 months.
Subsequent waves.
Just like any other accurate respiratory infection, COVID-19 develops in waves. Nevertheless, any subsequent wave will be less intense than the previous one.
First of all, more tests will become available while healthcare institutions will be better equipped with personal protective equipment. Secondly, the healthcare system's capacity will increase. Thirdly, a significant number of people will already develop an immunity to the virus. And lastly, the vaccine is very likely to be implemented gradually throughout the year.
Every subsequent wave may result in local quarantines, but they will become gradually less necessary.
History of crises
The world economy has seen more than a few crises. They were each similar in some way but also had significant differences. But one thing is clear: every crisis has its reasons and sooner or later ends, pushing the economy toward new growth.
What is an economic crisis? Simply put, it is a disruption in the usual economic activity. A crisis is often defined as an imbalance in supply and demand for goods and services. In addition to that, one of the manifestations of a crisis is a systematic and mass accumulation of debt that cannot be paid back on time.
We'll examine the most significant crises of the 20th and 21st centuries. The earliest crises are very different from the subsequent ones since they occurred in a completely different monetary standard system.
The Great Depression (1929-1933)
Probably the best-known and largest economic crisis of the 20th century. Officially, it lasted 4 years, although the world felt its consequences until the start of World War II.
Different theories cite different reasons. Here are some of them.
Overproduction. During World War I, agriculture and manufacturing flourished in non-European countries. But after the war came to an end, Europe ramped up its own manufacturing forces, causing American factories to stand idle. By 1929, falling demand resulted in overproduction in major manufacturing sectors, with nowhere to dump excess production and an increasing unemployment level that reached 25% by the end of the crisis.
Credit system issues. Loans backed by securities and real estate instantly became toxic debt. Banks stopped issuing loans, which resulted in a wave of bankruptcies across the United States. Financial institutions began to close their doors. Companies stopped taking on loans or making payments on them, despite financial institutions offering no-interest loans.
Keynesian economics. Adherents of this school of thought believed that money should be backed by a product. At the time, currencies were backed by the gold standard. That meant that countries could issue only as much money as their gold reserves would allow, which helped to keep inflation in check. As production grew, there wasn't enough money for all the products.
It was caused by several factors combined.
Essentially, the 'bubble' that started growing after World War I popped. In the 1920s, the American economy rapidly developed. The country's real GDP increased from $688 billion in 1920 to $977 billion in 1929, while the unemployment rate remained below 4%. However, Americans used loans to provide for most of their consumption. The increasing standard of living turned led to the bustling stock market. Both professional traders and everyday Americans flocked to Wall Street. In 1925, 1.7 million shares were sold each day. By mid-October 1929, that number had reached 4.1 million. Margin trading played a key role in the stock market's collapse. Market players took loans from brokers that significantly exceeded their own funds. Banks lent more money to the stock market and real estate sector than it did to businesses.
Then in a flash, the bubble burst. On 24 October, investors began mass sell-offs of stocks and bonds. In one day, investors offloaded a record 12.9 million securities, which led to a sharp drop in their prices. This was followed by Black Monday (28 October) and Black Tuesday (29 October). In just two days, the Dow Jones index fell more than 20%, and the market lost approximately 40% of its value the next week.
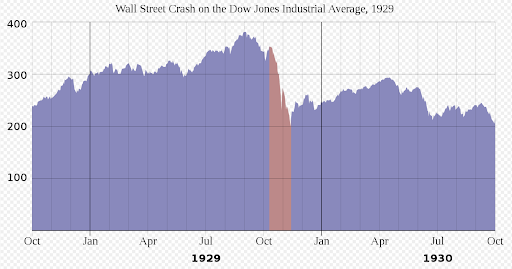
The American S&P 500 also crashed.
Scale of the crisis
The Great Depression affected the United States, Canada, Great Britain, Germany and France the hardest. The reason is not just because all of the world's leading countries remained on the gold standard, but because the volume of world trade shrunk three times in the period covering 1929 to 1932. This occurred after the United States began to implement protectionist measures. In order to protect homegrown manufacturers, the US government passed the Smoot-Hawley Tariff Act that imposed 40% tariffs on imported goods. Naturally, this couldn't help but negatively impact other economies.
Consequences
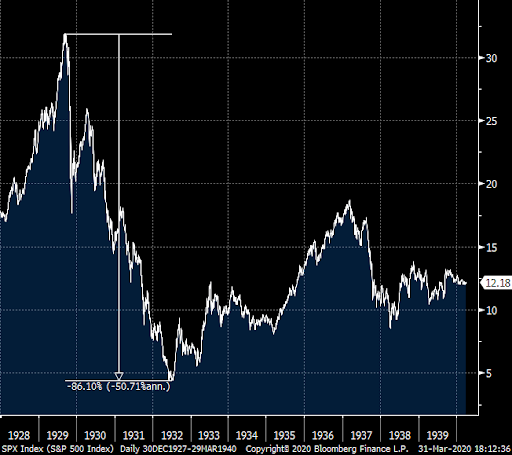
This crisis' effects were lamentable. Industrial production fell by 46% in the United States; 24% in Great Britain; 41% in Germany; and 32% in France.
This set the sector back 30 years. Shares in industrial companies in Great Britain fell 48%, while those in the United States plummeted 87%. Unemployment reached massive levels. In the United States and Great Britain, the unemployment rate hovered around 25%. In Germany, it was closer to 50%. Overall, countries with developed market economies had approximately 30 million unemployed people. Farmers and small traders suffered.
Changes took hold in the political arena, too. Membership grew in both communist and nationalist parties. In Germany, for instance, the Nazi Party came to power, a development linked to the beginning of World War II. Some countries because to eschew the gold standard; Great Britain, in particular.
Anti-crisis measures during the Great Depression
In 1932, Franklin D. Roosevelt was elected president in the United States. The first 100 days of his presidency saw a great many anti-crisis laws passed to temper the situation that was threatening to get even worse.
Roosevelt was forced to declare bank holidays, essential freezing banking activity. If the bank could function after it assessed its situations, the federal government offered it financial assistance. The bank opened up again and continued to work. Roosevelt went down the path of restoring the banking system and helping financial structures so that the financial system would reboot. Without that, it would simply be impossible to reinvigorate the economy.
A law to regulate agriculture was also passed to guarantee farmer's debts and increase their income by raising prices on agricultural products. As a result of this legislation, the federal government compensated their losses. But to raise agricultural prices, they had to convince farmers not to plant a new crop and to reduce their livestock numbers. That resulted in the destruction of grain, livestock, and milk, despite the fact that the country was facing the threat of famine.
A groundbreaking law on social security was passed, introducing unemployment benefits — which was extremely important given the circumstances, and retirement pensions, which resolved significant social challenges. Massive nationwide infrastructure projects financed by the government put people back to work and food on their tables. At its outset, however, salaries weren't paid or were miserly.
Roosevelt's New Deal program was significant because it was at precisely at this time that the role of the executive branch of the American government drastically changed and when a system of regulating the economy, industry, agriculture, and most importantly, finances was introduced. The social welfare legislation first adopted in the United States in the 1930s has been the pillar on which American society runs.
The Oil Crisis (1973-1975)
This crisis is also known as the oil embargo. It began on 17 October 1973 when OPEC member-states, Egypt and Syria declared that they would not ship oil to countries (the United Kingdom, Canada, the Netherlands, Japan and the United States) that supported Israel during the Yom Kippur War with Syria and Egypt. OPEC didn't just decrease oil production to push world prices in their favour. Their key factor was to pressure the international community in the hopes that Western countries would reduce their support of Israel. This primarily concerned the United States and its allies in Western Europe. Oil prices went from $3 to $12 per barrel as a result of these actions.
Even after the embargo was lifted in March 1974, oil prices remained higher than pre-embargo levels.
The Arab-Israeli conflict wasn't the only consequence of OPEC's decision and the subsequent recession of 1973-1975. Back in 1971, US President Richard Nixon decided to move away from the gold standard, triggering a sharp price hike for the precious metal. As a result of Nixon's action, countries could no longer exchange the dollars in the foreign currency reserves for gold. Naturally, the gold standard system should have fallen to the wayside sooner or later. But Nixon's decision was so unexpected that it led to the dollar falling in value. And that's when things really took off. OPEC countries, whose oil contracts were dollar-denominated, saw their revenue cut. The cost of imports denominated in other currencies remained unchanged and even grew.
The price growth for energy commodities sparked a crisis in large developed countries, starting first in the United States. Inflation in oil prices led to higher costs for petrol and jet fuel, as well as many other goods. Inflation rose 10% on some products. This happened when the United States was in a vulnerable position, with Nixon conducting his wage control policy (high wages, but firing employees to optimise costs). Demand fell as a result.
Overall, the effects of the oil crisis turned out to be much weaker than the ramifications of the Great Depression. Industrial production fell during the crisis. It was down 13% in the US, 20% in Japan, 22% in West Germany, 10% in the United Kingdom, 13% in France and 14% in Italy. Around mid-1975, 15 million people in developed capitalist countries were unemployed. Over 10 million were furloughed. As such, rising prices saw a drop in the population's real income.
The number of bankruptcies skyrocketed. 6% of companies in the United States went bankrupt. Japan, West Germany, the United Kingdom and France saw 42%, 40% 47% and 27%, respectively, of companies bankrupted.
Stock markets also saw downward movement. 1973-1974. Stock prices decreased 33% in the US, 17% in Japan, 10% in West Germany, 56% in the United Kingdom, 33% in France and 28% in Italy.
These two crises occurred before the full dismantlement of the gold standard system. Consequently, central banks didn't have much freedom to stimulate the economy. The world transitioned to floating exchange rates, although this transition did nothing to halt the crises.
Anti-crisis measures during the Oil Crisis
During this time, developed countries had to endure an energy famine after OPEC member states intentionally decrease oil production for political reasons.
Measures taken to combat the crisis were rather versatile and led to many historic decisions. For example, it led to the creation of the International Energy Agency, whose mission it is to preserve the balance between supply and demand for worldwide energy resources.
Governments once again took upon themselves the role of the saviour. France, for instance, conducted a rigid energy savings programme. Many companies switched to coal. Restrictions were also put in place for heating non-residential buildings. The governments of Germany and the Netherlands were forced to prohibit the use of vehicles on weekends. The US government create its own reserves, specifically increasing shale oil production.
The Asian Crisis (1997–1998)
This crisis unfolded in Southeast Asia in July of 1997. It seriously shook the world economy at that time.
Reason for the crisis
Serving as the background for this crisis was the incredibly fast economic growth experienced by these so-called Asian Tigers. This growth led to a massive influx of capital to these countries, increased government and corporate debt, an overheated economy and a real estate boom. These countries showed 6 to 9% GDP growth per year. This quickly-developing region attracted many foreign investors, especially after they tied their national currencies to the dollar. However, as is well-known, was any big growth in financial markets, there comes a moment when too many open positions are available without having underlying assets to back them. In these conditions, purchases are made based on emotions, not on hard data. As a result, the countries began to exceed the ratio of external debt to their GDP, which yielded lamentable consequences. Basically, The high level of external debt served as the primary reason for the crisis. Since most investments were linked to the US dollar rather than the local currency, the ratio of external debt to GDP steadily rose and devalued the local monetary unit.
Scale
The Thai Baht was the first currency to be hit. In mid-May 1997, it underwent massive speculatory attacks. Thailand's central bank supported the currency by pumping in budgetary funds and foreign currency reserves. But they weren't enough, and the Baht went into free fall. In July 1997, its exchange rate fell 20%. By the end of that year, the currency had lost almost 100% of its value. Other local currencies soon followed: Indonesia's rupiah Malaysia's ringgit and others.
Consequences
These countries saw their foreign trade drop by a third due to these events, as well as the collapse of stock markets, a wave of bankruptcies and an increase in unemployment. It's only natural that their primary economies suffered tangible losses. Furthermore, the crisis affected the cost of commodities, which, in particular, negatively impacted oil-producing countries. In 1998, Russia defaulted. Argentina's default in 2001 was the last echo of the Asian crisis.
Anti-crisis measures during the Asian Crisis
The IMF played the primary role in overcoming the Asian Crisis. The three countries that were most affected by the crisis (Indonesia, South Korea and Thailand) turned to the IMF for financial assistance.
The IMF strategy to combat the crisis was made up of three basic components: financing, tightening the debt and monetary policy and structural reforms. The latter was of the utmost importance. These included:
- Closing insolvent financial institutions to prevent further losses
- Recapitalising potentially viable financial organisations, often with government assistance
- Strengthening and tightening the central banks' supervision over financial organisations and institutions, bringing supervision and regulatory practices up to international standards.
Approximately $35 billion were allocated to run the stabilisation and reform programmes in Indonesia, South Korea and Thailand. In addition, Indonesia received additional aid from 1998 to 1999. Detailed aspects of these reforms were created in conjunction with each country's government as well as the World Bank and the Asian Development Bank.
The Dot-Com Bust (2000-2001)
The key reason for this crisis is that the bubble that formed in the IT (dot-com) sector burst.
From 1995 to 2000, shares in internet companies saw a huge boom. These companies looked very promising (and, as time has shown, overall they were). Just like anything new, it sparked great interest. Everyone started buying up shares, including with their credit cards.
The reason for the collapse, just as with any other bubble, was an inaccurate (inflated) valuation of the stocks' prices.
The dot-com bubble burst on 10 March 2000. Hi-tech companies on the NASDAQ Composite had already experienced a sharp drop. Prior to that, the index has reached its peak of 5132.52, doubling its value from the prior year.
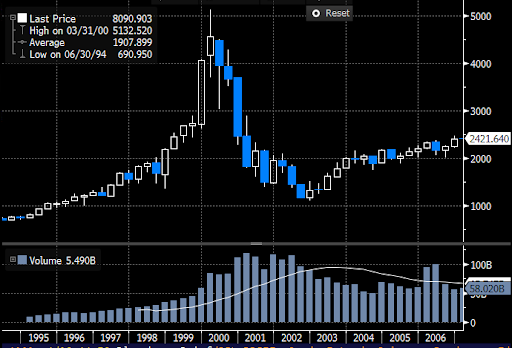
Naturally, most internet companies were devalued and disappeared along with the index.
Scale
Undoubtedly, the hi-tech sector itself was most affected. Shares in the telecom Cisco, for instance, fell 86%, while Amazon shares plummeted 93%. Many companies went bankrupt, but many related industries also suffered, such as advertising and logistics.
Consequences
The stock market crash in 2000 to 2002 resulted in a $5 trillion loss in companies' market values. The September 11th terrorist attacks that destroyed the Twin Towers of the World Trade Centre in 2001 only exacerbated the situation. However, the result of yet another burst bubble led to introducing a mechanism to directly control securities speculation processes. It's true, though, that this control was linked to anti-terrorist efforts.
Anti-crisis measures during the dot-com bubble
The speculation on tech stocks that took place in the late 1990s created a bubble on the US stock market.
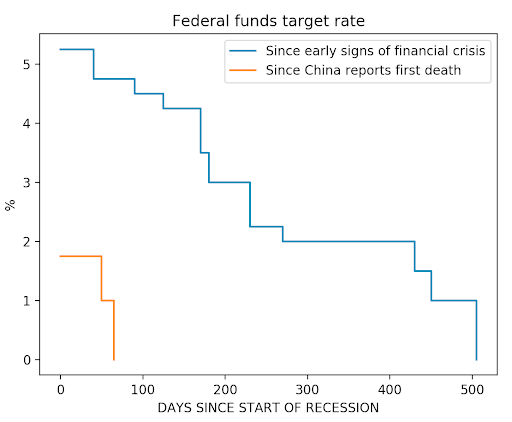
US Federal Reserve key interest rate
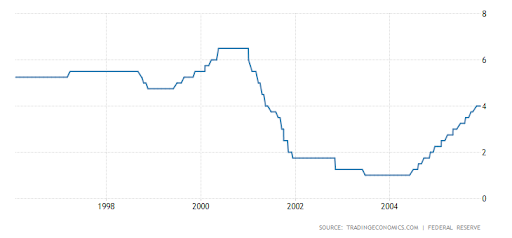
During its session on 3 January 2001, the US Federal Reserve System decided to change the direction of its monetary policy; it began to quickly lower its key interest rate. In just 2001, the interest rate went from 6% to 1.75%. Basing themselves on macroeconomic data, the Fed concluded that there wouldn't be a deep crisis. But what they didn't know was that the events of September 11th would shock and knock the world off balance. After such a turbulent year, the markets went through a period of relative quiet and slow recovery. After three years of soft monetary and lending policies, the Fed began to raise the rate in June 2004. The economy took off, heating up the real estate market.
The 2008 Global Financial Crisis
This crisis is also often referred to as the 'Great Recession'. Indeed, beginning in 2008, it ended at different times in different countries (from 2009 to 2013). Its echoes remained for a long time after. This crisis started as a financial crisis in the United States. By 2009, GDP had shown negative movement for the first time since World War II.
The US mortgage crisis, which began in early 2007 and affected many high-risk mortgage loans, served as the precursor to the 2008 financial crisis. The second wave of the mortgage crisis took place in 2008. The United States' mortgage issues caused a liquidity crisis for world banks in September 2008. Banks stopped issued loans, especially car loans. As a result, sales for giant car builders began to fall.
Then banks started going belly up. Lehman Brothers' bankruptcy was the biggest in US history. It was the fourth-largest American investment bank. This also negatively impacted basic stock market prices in many countries and pushed down on energy commodity prices. The stock market crash in October 2008 was the biggest for the US market in 20 years. Japan experienced its largest crash ever.
Reasons for the crisis
- The cyclical nature of economic development
- An overheated credit market, resulting in the mortgage crisis
- Huge household debts
- High commodity prices (including oil)
- Overheated stock market.
The scale of the 2008 crisis can be compared to that of the Great Depression. The United States was hit, along with Eurozone countries. What's more, Europe experienced two waves of the crisis. The Eurozone's economy ended its recession in Q2 2009, but another slowdown — the longest in its history — began in 2011 and lasted until 2013.
Consequences
On average, the American companies saw their capitalization fall by 30-40%; European companies witness their drop by 40-50%.
World trade volume decreased by more than 10%. In particular, China and Germany's exports dropped by 30%. This number reached 45% for Japan. The Chinese economy's annual growth slowed to 6.4% from 15% (it has not reached these levels of GDP growth since).
Oil prices slipped from $147 to $30 per barrel. On the backdrop of the crisis, nearly all key central banks lowered their interest rates almost immediately.
Anti-crisis measures during the 2008 global financial crisis
The US Federal Reserve and central banks around the world took steps to increase the money supply to avoid the risk of deflation, with which lower wages and the rising unemployment rate would have led to a reduction in global consumption. Governments also adopted sizeable fiscal stimulus packages. This was the most massive liquidity injection into the credit market and the largest monetary policy programme in world history. We'll look more closely at the response to the 2008 financial crisis in the next section of CoronaCrisis 2020 since all central banks have taken similar monetary actions in 2020 as they did in 2009.
CoronaCrisis 2020
There's now no doubt that the world is entering a new recession.
Bloomberg sets the likelihood of a recession in 2020 at 100%!
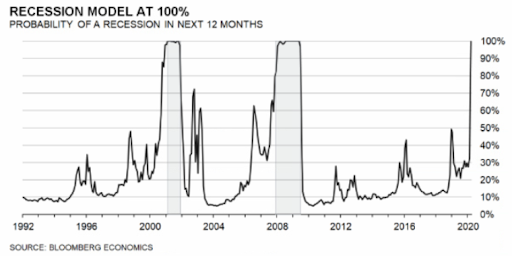
Blame it on the new viral pandemic that has spread to practically the entire world, forcing many governments to take serious quarantine measures. It has disrupted the supply chains for parts and products, reduced consumer activity, and led to a drop in commodity prices. We've already seen the first figures showing the state of economies around the world. China, the first country to go under quarantine, recorded a 13.5% drop in industrial production in February and a 20.5% drop in retail sales. In the U.S., the labour market report for March 2020 showed a sharp decline in the number of new jobs (-701,000). Weekly initial unemployment claims between 19 March to 2 April increased to 16 million. The composite indexes of business activity in Eurozone countries are falling, sliding into downward territory.
On the one hand, the crisis will be similar to those the world has seen before. On the other hand, it is unique due to the catalyst that sparked it. But the virus wasn't the only thing to trigger it.
As this massive crisis began to unfold, the world economy had already weakened.
The United States actively waged trade wars in 2018 and 2019. Those wars hit China and several other countries. All parties to the conflict raised tariffs, and mutual threats flew back and forth. As a result, the Chinese economy saw its growth rates slow. The United States followed thereafter.
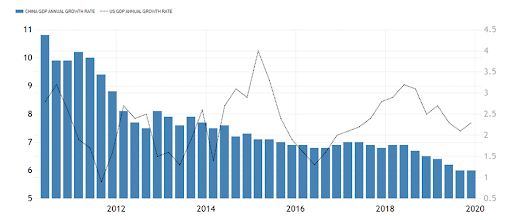
Trump also threatened to raise tariffs on European cars imported to the United States, Europe's largest market. Germany alone, for example, supplies about 600,000 vehicles a year. Although tariffs were not imposed, the German economy suffered from the Sino-American trade war because both countries' markets are essential for it. Domestic demand in China fell due to the economic slowdown, which affected German exports. As a result, the Eurozone's largest economy escaped recession in 2019 only by a miracle. Currently, its growth rates are at their lowest levels in 7 years.
Japan's economy, which began to slow down in 2018, also faced several blows from the U.S.-China trade rivalry in 2019. The country's domestic policy also stirred the pot when it increased the sales tax in October 2019.
However, Coronavirus may leave a much more tangible impact. The 2020 Summer Olympic Games were to be held in Japan, but they've now been officially postponed until 2021. The hopes for a recovery in 2020 on the back of increased tourism are long gone. Fiscal spending to prevent the effects of Coronavirus will account for about 20% of Japan's GDP (39 trillion yen), which will also exacerbate the situation.
Oil price collapse
The decline in oil prices is another factor that will hurt the world economy. Several large oil-producing countries find themselves in a vulnerable position because low oil prices prevent them from running deficit-free budgets. Also, weak demand for energy commodities due to the epidemic's rampant spread and limited transport flows is likely to force a production cut since oil storage is has reached capacity. Of course, industry giants with low production costs will endure this period, unlike some US shale oil companies that will go bankrupt.
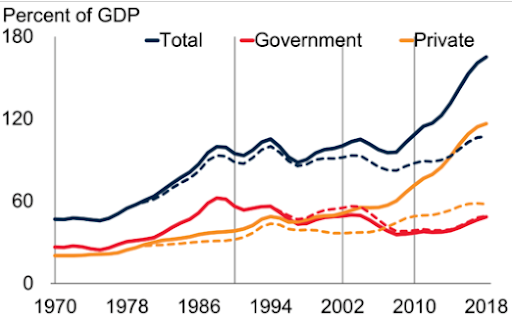
The world's rapidly growing debt levels
The world economy is facing another crisis while deeply in debt. According to estimates by the Institute of International Finance, in 2019, world debt surpassed its historical maximum, reaching $255 trillion or 322% of global GDP.
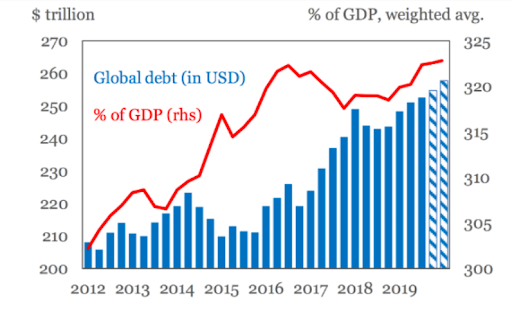
This growth is mostly due to central banks' policies that either reduced or kept interest rates low from 2009 to 2014. As a result, governments, companies and individuals are borrowing for economic development. And when there is no growth, they acquire even more, egged on by low interest rates. For example, by gaining easy access to capital markets, developing countries have increased corporate debt by 50% in just two decades.
The debt load was 327% in the United States, 540% in Japan, and 388% in Eurozone countries. In China, it reached 310%.
But it hasn't reached its limit. In 2020, world debt may increase significantly due to the consequences of the Coronavirus and the global economic downturn. Especially since many countries have already announced unprecedented measures to stimulate economies by injecting helicopter money. This poses a severe threat to the largest borrowers: the United States, Japan, the Eurozone and China. After all, the growth slowdown and the increasing costs of financing complicate debt servicing and are fraught with the possibility of defaults. This will hurt bank profitability and lead to liquidity problems. We already experienced this in 2008. The difference now is that everything will be on a much larger scale in 2020.
Countries' actions to prevent CoronaCrisis
The fiscal and monetary stimulus announced by the world's largest economies beginning in early March 2020 is an unprecedented event on a global scale.
These are some of the measures taken by the leaders of developed countries as of the first week of April 2020:
- Coordinated actions to expand the availability of liquidity through swap channels between the world's six major central banks to provide financing in US dollars
- Lowering domestic interest rates
- Unlimited quantitative easing by the Fed
- The most massive aid package in American history, $2.2 trillion, with more possibly on the way
- Reducing the reserve rate to zero (commercial banks can use all their reserves)
- Emergency payments to almost all households to stimulate demand, e.g., 500 euros for Italians and $1200 for Americans.
In response to the market crisis, central banks and governments around the world have taken aggressive countermeasures to protect themselves from the economic downturn that now seems inevitable. In mid-March, the G20 countries announced that they would invest more than $5 trillion in the world economy to fight the COVID-19 pandemic and to limit job and income losses.
Source: FT
One of the reasons for this immediate reaction from the authorities is that this, time around, markets and the economy collapsed much faster and the fall appeared to be much more profound.
In particular, the Fed and the U.S. Congress reacted quickly to the Coronavirus pandemic, using strategies proven ten years ago during the financial crisis. The difference here was speed: what once took more than 18 months, Washington has done in weeks.
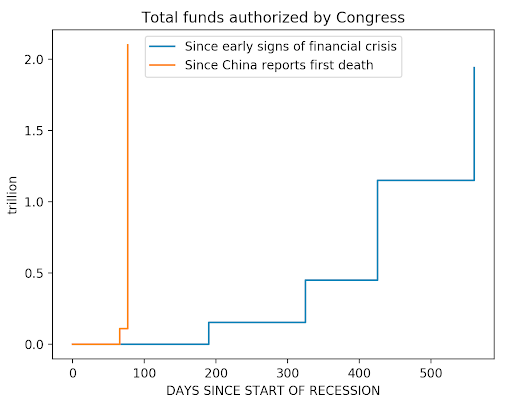
Source: Bloomberg, own calculations
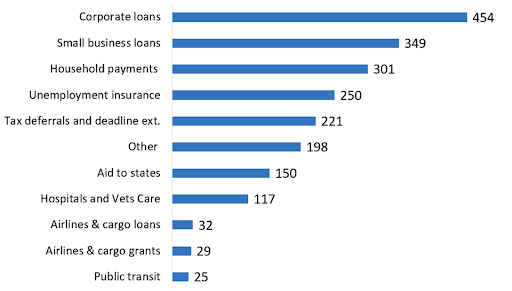
On 27 March, Donald Trump signed the most massive economic aid package in American history. It's two times bigger than the previous maximum. The country will provide $2.2 trillion in emergency aid to families, workers and businesses. The bill offers one-time checks for many Americans, increased unemployment benefits, loans and assistance to small and large companies, as well as funding to state and local governments.
Source: The Wall Street Journal
The U.S. Central Bank has made it clear that it will do almost anything to help the U.S. economy during the crisis by lending to small and large businesses and buying unlimited amounts of public debt.
Through its new direct lending program, the Fed has become a kind of commercial bank, and it has done everything in its power and even more when compared to its actions during the 2008 financial crisis.
Source: Bloomberg, own calculations
The biggest problem is that, until confirmed Coronavirus cases peak, the economic damage the virus causes will continue to increase. Businesses that have shut their doors as a result of the outbreak won't open again until local governments consider it safe to do so. Fighting the epidemic takes time. A great deal of money is involved in the $2.2 trillion aid package and other measures, but even this much may not be enough.
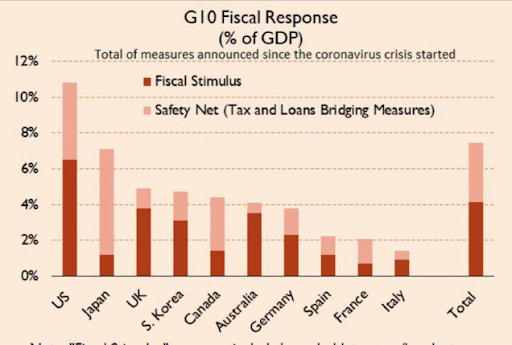
| Country | Amount of aid | Type of aid | Target group |
| Austria | EUR 38 billion (9.8% of GDP) | • Liquidity measures • Credit guarantees • Tax deferrals • Subsidies for companies that had to cut labour hours • Aid for small businesses in the tourism and culture sector |
• SMEs • Sole proprietorships (single-person or family business) |
| Canada |
CAD 82 billion (3.5% of GDP) |
• Direct support • Tax deferrals • Liquidity measures for businesses |
• Consumers • Corporations • Employees |
| China | CNY 1.25 трлн (1.25% of GDP) | • Tax deferrals | • Corporations |
| Germany | EUR 150 billion (4.4% of GDP) |
• Solidarity fund |
• SMEs • Affected companies • Sole proprietors |
| The UK | GBP 312 billion (14% of GDP) |
• Government loans and guarantees |
• SMEs • Corporations |
| Italy | EUR 26 billion (1.1% of GDP) | • Assistance for employees facing temporary layoffs • One-time 500-Euro payment for self-employed persons and a monetary payment for previously employed Italians |
• SMEs • Consumers • Corporations • Employees |
| The US | USD 2.1 трлн (9% of GDP) | • $500 billion in corporate assistance • $367 billion in aid to small businesses • $150 billion in aid to local authorities • USD 340 billion to combat the coronavirus (hospitals) |
• SMEs • Corporations • Consumers |
As of 10 April 2020
By assessing the aforementioned information, we can conclude that governments are trying to treat the CoronaCrisis with monetary means, just as they did to overcome the 2008-2009 financial crisis. The current rescue model is aimed more at the financial system than at the real economy. This means that in the end, the measures taken will not be as effective as, for example, as during the mortgage crisis. The availability of liquidity in the system will not start plants up and will not lead to hiring if there is no end consumer or disruptions in the supply chain will result in a shortage of parts. In other words, we are in both a financial and an economic crisis. As a result, we will need new direct measures to stimulate the demand that should be higher than already announced: government orders, large projects, financing and direct support for companies.
The zero-interest loans offered by central banks will cover toxic loans as they did in the 2008-2009 mortgage crisis. This would save the banking system but not restart the economy.
Crisis scenarios
CRISIS RECOVERY MODEL AND BUSINESS CYCLE PHASE
What will be the crisis recovery model? It's hard to give a definitive answer to this question due to differences in stimulus measures and the preconditions of the crisis itself.
RECOVERY MODELS
However, research and surveys done by focus-economics.com suggest two basic scenarios for going through and exiting the crisis.
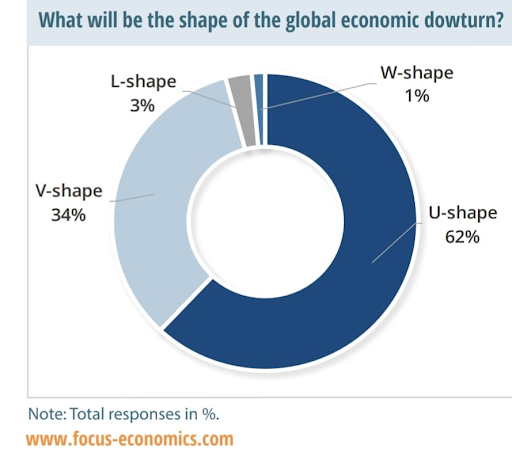
Source: focus-economics.com
62% of respondents assume that the crisis will follow a U-shaped trajectory. This scenario implies that the global economy will show a rapid decline and depressed demand with prolonged weakness and stagnation in business activity. The recovery from the recession will be smooth and over a long period of time.
In our opinion, this is the most likely scenario for now. The pandemic is growing, and revoking quarantine measures will not eliminate restrictions on international travel. Corporate finances will get worse. The longer the limits are in place, the deeper the recession will be, and the more bankruptcies will occur. Therefore, one shouldn't expect to see a rapid recovery in consumer demand. The imbalance may last several years, which determines the basic U-shaped model.
Over a third of respondents, 34%, believe that the world will experience a V-shaped recovery. According to this scenario, the economy will show a rapid decline and an equally fast recovery, without lingering in the crisis for a prolonged period of time. This scenario is similar to jumping off a diving board into a pool with the water pushing the swimmer up after diving. Some attribute this recovery to central bank stimulus programmes. These injections help to avoid a credit crunch and to keep the financial system from folding. However, responding to the current crisis through monetary policy is insufficient. The money won't kick-start small businesses and companies that don't have demand for their products or can't receive raw materials and parts in a timely manner.
The L- and W-shape scenarios are improbable. In the first case, respondents expect a prolonged recession and depression, similar to the Great Depression in the United States that lasted for many years. The latter case assumes two waves to the crisis. In the W-shaped model, the first wave launches irreversible processes in the economy that cannot be overcome by current policy. As a result, a second recession hits after what seems to be a recovery. The scale of the second wave may be stronger or weaker than the first one.
In terms of trading in a U-shaped recovery, one should keep short-term trading until the market reaches the bottom and may remain there for up to several years. The best tactics for this period are either buying at the bottom or trading in a range. Sideways recovery marks a new growth cycle.
The V-shape scenario is a basic scenario for investment banks. In this model, shares or indices are purchased during the market decline and its recovery. The market collapses in intervals and recovers with strong price breaks. A fall of 25%, 50% and over 60% are the pivot points for the market. Usually, this is where the most significant number of purchases occurs and contributes to the market's recovery.
If the economy goes through a W-shaped recovery, any purchases should be short-term. The problem for buyers is that growth often occurs after upward intervals. Traders should be brave enough to buy on the previous day when markets fall.
In the worst case, an L-shaped recovery may await the economy, something the world last saw during the Great Depression between 1929 and 1939.
BUSINESS CYCLE
It should be noted that each industry will have its own recovery model.
At different stages of the economic cycle, unique demand for various sectors forms. For example, when the economy grows, there is a strong demand for raw materials, energy assets and industrial goods needed to sustain growth. During a downturn, essential services and products become the most needed, a trend that involves the health and utilities sectors. During this period, the financial industry is uniquely positioned as it cuts its activity but remains in demand.
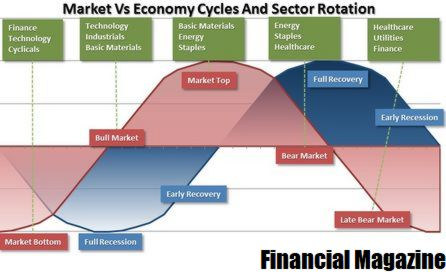
This model is often used by investment funds and companies to assess priority investment areas.
We are entering a recession now where the most needed goods and services, such as medicines and utilities, are the most stable. Banks can get unexpected support from central banks that will close problem loans through incentive programmes.
If we consider the business cycle by asset type, then as of today, we've completed the peak phase of growth and are now in decline across the entire spectrum of assets: stocks, bonds and raw materials. That's Stage 6 of the cycle in the figure below.
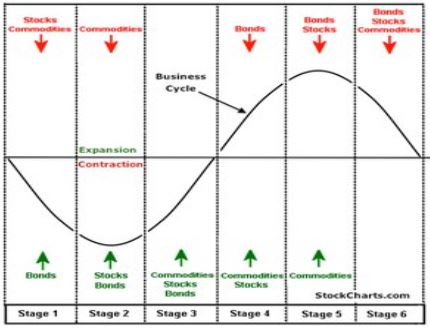
The next step is Stage 1 of the cycle, where stocks and commodities will be under pressure and capital will flow into protective instruments like government bonds and precious metals, e.g., gold and silver.
According to this theory, raw materials will be under intense pressure for a long time until the economy uses the accumulated stocks and gets enough momentum for growth, which will require commodities and human capital.
PROCESS CYCLE MODEL (KONDRATIEFF WAVES)
The blurred outline of the economic cycle is the distinctive feature of the current crisis. This feature shows that the transition from one business cycle to another occurs not as a consequence of a short-lived deep recession but in the format of long-term stagnation. This is when zero and negative interest rates foster an environment for the slow degradation of the economic system via meagre growth rates.
Currently, the crisis has become a point of transformation for the anaemic 2.5-3% growth that has already formed into a more extended phase of secular stagnation. It may even extend by two, three or more years, not by two or three quarters, as it did 11 years ago.
At the same time, it's worth noting a global change in the technological cycle, when the IT sector, the Internet and automation are so heavily integrated into society that they become an essential and integral part of it. The quarantine shows that most businesses can run remotely. A generation that was born with a smartphone in their hands has now grown up now and doesn't know any other reality. This generation will be the one that determines our future.
In the end, we see one technology cycle end and another replace it. This concept of changing long periods fits neatly into the Kondratieff wave model.
Steam engines and trains, internal combustion engines, electricity and mobility have already changed our lives. Now it's IT and the Internet's turn to do so. It's just a fact of life.
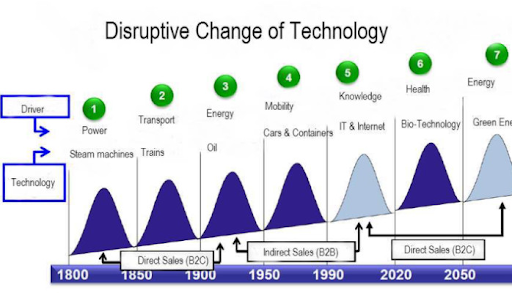
As we can see here, we're going the bottom point of the technological pattern change in the late 2010s - early 2020s. It's the end of the decline and the beginning of the depression phase. According to Kondratieff, the depression phase is characterised by record low inflation and interest rates. Credit is very cheap, but there's no demand for it. This phase is accompanied by overproduction in many sectors of the economy and rising unemployment. However, at the same time, this phase is rich in new fundamental inventions that lay the ground for a new growth phase. The beginning of this new phase is when all of these inventions will begin to be implemented on a mass scale, changing the established foundations both in the economy and in society as a whole.
The CoronaCrisis is launching a new wave of biotechnologies and green energy. Logically, the Coronavirus pandemic will become a catalyst for large-scale public investments in the medical sector. It will also include the development of biotechnology, bioengineering and microbiology. In this context, green energy will also be developed to minimize the impact of human activity on the environment. The rapid development of artificial intelligence and the maximum automation of processes is also highly probable to emerge.
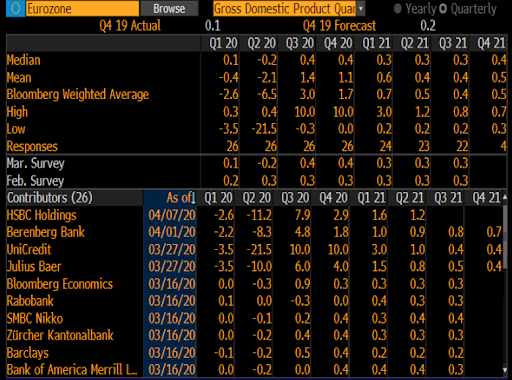
MACROECONOMIC FORECASTS
Note: Macroeconomic forecasts change constantly based on incoming data on the number of infections, changes in quarantine conditions, and inbound macro statistics. This makes it incredibly challenging to keep up with the most current data. The forecast data below is given as of 10 April 2020.
The Coronavirus pandemic has led to a global economic shift. Unlike the 2008-2009 crisis, this recession is more than just financial: it's economic. Supply chains are being ripped apart, resulting in international trade toppling like a house of cards. Consumption is decreasing; investment and production activities have collapsed. Quarantine measures have stymied economic growth and sparked unemployment.
Official forecasts
Official forecasts include all assessments provided by international financial organizations (IMF, World Bank, WTO and the top three credit rating agencies). These official estimates are generally conservative, but central banks and governments rely upon them in their decision-making.
International Monetary Fund (IMF)
According to the IMF, the global growth forecast for 2020 is negative, with a recession as severe or even worse than during the global financial crisis. The IMF expects global GDP to recover in 2021. (An official report with projections will be published in April 2020. It has not yet been published at the time of writing).
Developed economies have a higher capacity to fight the crisis, while many emerging markets and low-income countries face significant challenges. The severe impact of capital outflows and the measures taken by governments to counter the epidemic will have a drastic effect on domestic economic activity. According to the IMF, since the beginning of the crisis, investors have already withdrawn $83 billion from emerging economies, the most massive recorded outflow of capital in history.
The World Bank
The World Bank has not yet published its 2020 forecast, issuing only a few statements instead. The bank declares that, due to the Coronavirus pandemic, the pace of China's economic development may slow to 2.3% versus 6.1% in 2019. Following the most negative scenario, economic growth in China may almost stop, reaching only a 0.1% increase.
Economic growth in East Asia is also expected to slow to 2.1% in 2020 versus 5.8% last year, provided that the world economy recovers this summer.
Fitch
The baseline scenario provides a 1.9% fall in global GDP in 2020 with a deep recession. Based on the assumption that the health crisis will diminish in the second half of 2020, activity will gradually start to return after quarantine measures are lifted. Experts point to a decline in capital investment, increased unemployment, shock prices for raw materials and the situation on financial markets among the factors that will constrain the recovery.
GDP in the US, Eurozone and the UK will shrink by 3.3%, 4.2% and 3.9%, respectively. The global recession will limit the Chinese economy's recovery after the Q1 disruption, so its 2020 growth rate will fall below 2%. Experts estimate that the lockdown may lead to a 28-30% decline in the US and EU economies in Q2 2020.
Standards & Poor's Global Ratings (S&P)
The impact of the Coronavirus pandemic on economic activity and financial markets contributed to S&P's reduction of its global economic growth forecast to 0.4% in 2020. In 2021, it is expected to recover to 4.9%. Central banks and governments have stepped in to support financial systems and to protect the most vulnerable in this situation, which opens up an opportunity for subsequent recovery.
Analysts expect U.S. GDP to fall by 12% in Q2, but by 1.3% overall for 2020. The unemployment rate in the U.S. will exceed 10% in Q2, reaching its peak of 13% in May.
In 2020, the Eurozone's GDP will decline by 2%. Spain and Italy's GDP will decrease the most, by 2.6% and 2.1%, respectively; the UK's economy will decline by 1.9%.
S&P analysts predict a drop in China's economy by almost 10% in Q1 2020. In 2020, China will see GDP growth of 3.9% versus the December forecast of 4.8%.
Moody's
Moody's expects that the unprecedented global economic shock caused by the Coronavirus outbreak will develop rapidly. Aggressive fiscal and monetary policies might help limit the depth of the decline and create conditions for a potential recovery in the second half of the year. However, the quarantine measures introduced in the U.S. have paralyzed at least 29% of the country's GDP. Moody's predicts a 2% reduction in the United State's 2020 real GDP. The agency forecasts a modest decline in economic activity in Q1, a sharp drop in Q2 and a gradual return to growth in the second half of the year. The Fed is expected to keep interest rates close to zero in 2020, 2021 and early 2022 to ensure that borrowing costs remain low and to support economic recovery.
Consensus forecasts by analytical and investment companies
Private companies have more freedom to make their estimates and can sometimes make bold assumptions. What sets them apart, however, is that their forecasts are aimed at their client base. So to minimize capital outflow, investment banks always use a V-shaped model as the basis for crisis recovery. Basically, an optimistic quick recovery from the crisis.
Unlike investment banks, research companies take a more balanced approach to their forecasts because their assessments are always a result of analysis.
Before presenting private forecasts, we would like to note that a recession is officially considered to be a decline in the economy for two consecutive quarters. A decrease over one quarter is called a technical recession. Accordingly, the way out of a slowdown would be two consecutive quarters of growth.
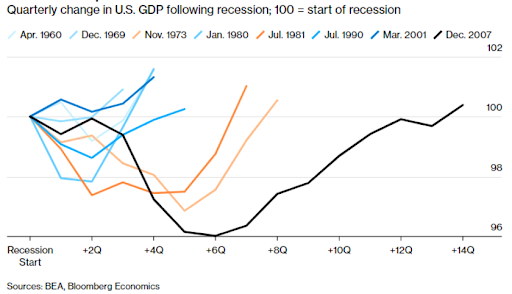
Source: Bloomberg
As history shows, the minimum recession period for the U.S. is 2-4 quarters. In the most challenging periods, the recession lasted 1.5 to 3 years. Several reputable research companies expect that it will take 2-3 years for economies to fully recover. The Coronavirus' average impact will be 5% of annual GDP; over 7% for China.
Investment companies' forecasts
To begin with, let's take a look at quarterly forecasts representing a quarter's relation to its previous quarter.
For the U.S., this would be a decline in Q1 and Q2 2020, with the most significant drop in Q2, (estimates range from 10% to 65%), followed by a recovery. However, as we previously mentioned, bankers are often optimistic about the recovery, so they prefer the V-shaped recovery scenario. Based on the most pessimistic estimates, the departure from recession in the U.S. can be expected no earlier than the end of 2021.
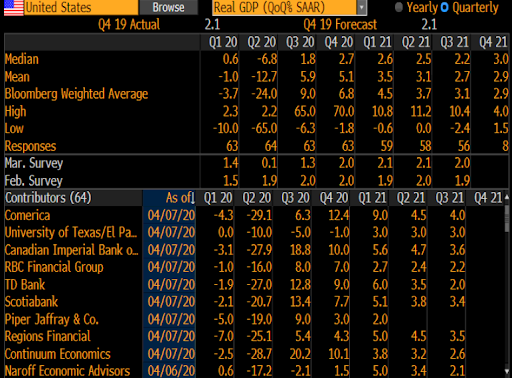
Source: Bloomberg
Here are the forecasts for China.
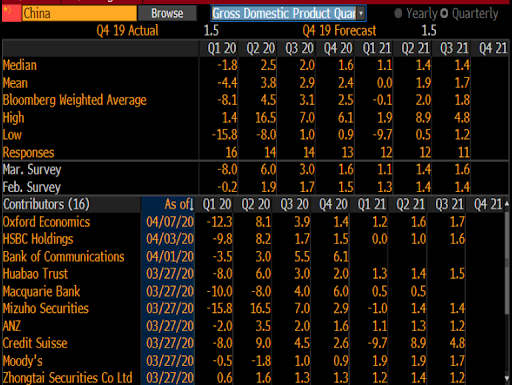
Source: Bloomberg
We can see that China has already passed through the bottom of the recession and will continue to recover, with its growth rate significantly slowed down.
The Eurozone is another economy that has a significant impact on the world.
Source: Bloomberg
Unlike the U.S., the situation in the Eurozone isn't so terrible, even according to the most pessimistic forecasts. The economy will reach zero as early as the end of 2020, but then an uneven recovery awaits it.
Annual growth forecasts are not so bright either.
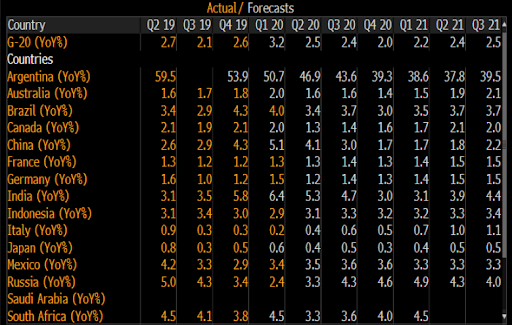
Forecast GDP dynamics of G-20 countries, Latin America and Eastern Europe
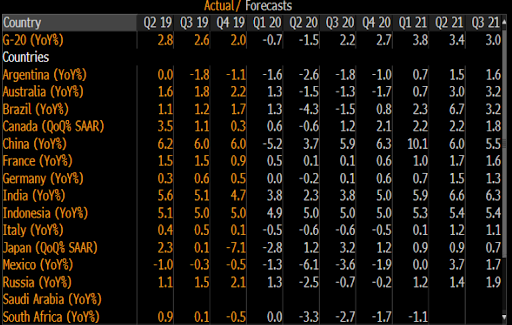
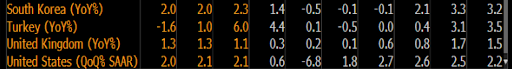


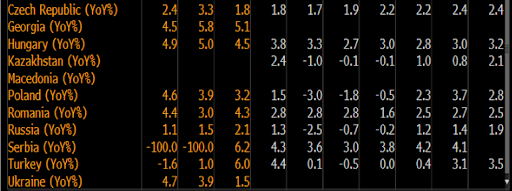
Source: Bloomberg
The economies of Latin America, Eastern Europe and the Russian Federation will be the most vulnerable. Commodity-based economies seem to have been struck by the drop in commodity markets and the lack of demand.
Looking ahead, we note that inflation is expected to rise in our baseline forecast and the consequences of the crisis. However, investment banks and companies still see a restrained growth rate for consumer prices.
Forecast inflation dynamics of G-20 countries, Latin America, and Eastern Europe
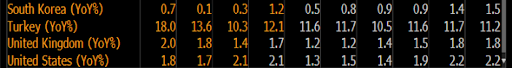


Source: Bloomberg
Argentina can expect to see the highest inflation. The country is experiencing defaults on external obligations and a collapse of the peso. High price pressure also awaits Turkey, China and India.
Meanwhile, the most interesting thing in these forecasts is the comparison of central banks low rates and developed countries' bond yields with inflation. Central banks are keeping rates close to zero, bonds have yields close to zero and inflation is burning liquidity right now, which devalues investments.
In conclusion, we'll present consensus forecasts on currency rates provided by investment banks and companies.
Consensus forecast for developed countries' base currencies.
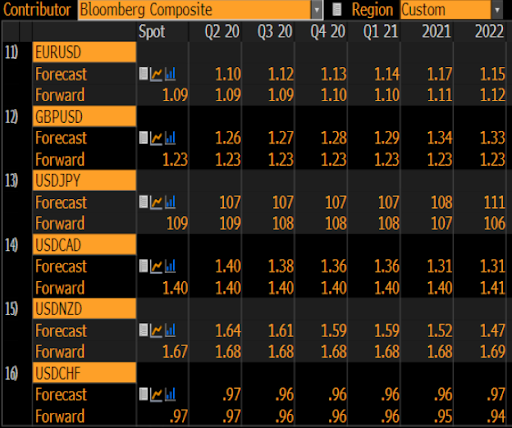
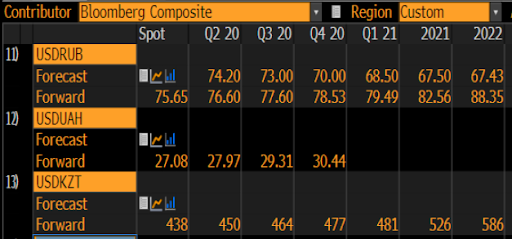
Consensus forecast for CIS countries' currencies.
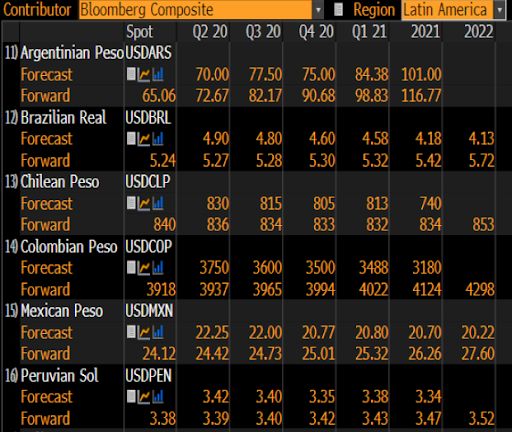
Consensus forecast for Latin American currencies.
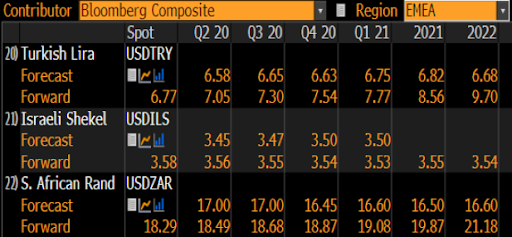
Consensus forecast for developing countries' currencies.
According to the basic consensus expectations presented by Bloomberg, investment companies expect the dollar to weaken against the major currencies of other developed countries. However, we disagree with the short-term forecasts. Historically, the dollar behaves differently during a crisis and shows growth against the background of capital outflows from emerging markets and growing investments in U.S. Treasury bonds. Such period lasts a couple of quarters on average, with reverse movement afterwards.
Consequences of the CoronaCrisis
Supply and demand imbalance
The crisis will not stop right after the pandemic has ended and quarantine measures are lifted. After the Coronavirus, this imbalance will be the primary problem for the world economy, being observed at both the micro and macro levels.
To understand the situation, let's look at the oil market. During the quarantine, there will be a massive amount of oil and petroleum products stocks in the world. This excess supply will put pressure on the market for a long time after consumption recovers. Also, if the pandemic ends by Summer 2020, the world will accumulate about 1 billion barrels of extra oil. It will take two years to use up this excess if demand exceeds supply by 1.5 million barrels per day. A similar effect will be seen for many other commodities. Many industries will face significant stockpiling.
On the other hand, diaper production may decline due to capacity downtime. In contrast, demand for diapers will be stable regardless of the quarantine as the product is essential for a specific population group. This will lead to product shortages and price increases. This will happen to many similarly positioned products, including almost all essential consumer goods, as well as medical equipment.
The global economy's downtime due to the pandemic will disproportionally hit demand and supply, causing imbalances. They can be grouped in the following way.
- Industries where aggregate demand will decline more than supply, such as the oil market. They will face a strong increase in inventories, preventing the market from regaining its previous balance and leading to low prices, suppressed investment and underutilization of production capacity.
- Industries where aggregate demand and aggregate supply will suffer proportionally. They will experience a definite downturn during the pandemic, but once it is over, these industries can recover quite quickly as business activity accelerates.
- Industries where supply will drop more than demand. These will cause shortages of goods (services) and put inflationary pressure on the economy. But they may recover the fastest after a pandemic. Investment activity will be the highest for these industries.
The second and third groups can quickly recover from the quarantine, but not completely since the first group — the weakest link — will interfere. Overstocking warehouses, and as a result, this group's low sales, low prices and low revenue will lead to low consumption growth rates. This will reduce total aggregate consumption which will cause the entire economy to suffer.
Division into the weak and the strong
The imbalance will also be observed in a regional context. Different countries' assistance to their economies will vary significantly in terms of both scale and efficiency. Some countries will receive more resources for recovery, and some will receive less. There will be more bankruptcies in weaker countries and businesses will lose working capital. This will make recovery more difficult.
Companies will also find themselves in different circumstances. Some will have enough money to rebuild their operations. Others will not survive and will go bankrupt. It is also worth saying that small businesses will be more vulnerable compared to large capital, as financial resources for the former are less available.
People's financial state will reflect the imbalance between industries, different countries and companies compared to the pre-crisis period. Many will be left without funds, resulting in their consumer activity not recovering quickly while others will actively satisfy deferred demand.
The world economy will start an uneven recovery after the pandemic. In the beginning, economic activity will increase sharply against the backdrop of a low base due to the economy kicking into gear. But it will not reach pre-crisis levels due to the emerging imbalance between industries, countries, companies and people. At some point, the pace of recovery will slow down sharply due to structural problems that have arisen.
Money and preconditions of inflation growth
The overall picture would be incomplete if we did not consider the imbalance in money. The decrease in some people's income is a consequence of the growth in others' savings. But a decline in salaries leads to bankruptcy and results in the depreciation of all debt obligations. If there are many bankruptcies, it will zero out the tremendous amount of debt obligations around the world. This zeroing out will hit the balances of the financial system that might potentially fall like dominoes, burying the savings of those who have them. As a result, both the weak and the strong can lose money. This could lead the financial world to a new great depression. If current events had happened 50 or 100 years ago, a depress would likely well have occurred.
However, since 2008, authorities have learned to keep the financial system afloat by turning on the money printing press. Almost any financial hole can be closed by issuing fiat money. The aftermath of the CoronaCrisis will be similar to the situation the world existed in for the last 11 years, after the 2008 crisis. Economies will be overflowing with fiat money, which will save the financial system from bankruptcy. But it will exceed all cumulative injections made between 2008 and 2019, as the volume of problem debt and assets will be huge. Money will be provided both through traditional methods of monetary stimulus and support for the financial system. It will also come through direct injections into the real economy and assistance to affected industries, companies and even countries' populations.
These actions will mostly have the effect of 'doubling' money. Old funds stored as unspent savings will be preserved, but new fiat money will also appear. And these funds will be distributed unevenly and most likely disproportionately to affected industries, companies and people because there is no perfect formula disseminating it.
Money from governments, of course, will slightly smooth out the problems of the real economy, the number of weak links will decrease and the imbalance between weak and strong companies and people will be less noticeable than it would be without support. At the same time, however, governments' actions will increase the monetary imbalance.
In the past, such measures didn't lead to a surge in inflation since the money stayed in the financial system. This time will be a different story. After the 2008 crisis, the world found itself with excess supply and a lack of demand. The real economy didn't have reasons to speed up inflation. As we've mentioned before, the current situation will experience three different stages of supply and demand imbalance at the same time. One of these stages is a supply shortage. This factor can trigger inflation for the global economy, especially when considering that there will be even more fiat money circulating in the world.
That can happen because all essential goods will still be in demand during the quarantine, but there may be supply shortages. That means that prices may surge even before the quarantine ends.
Let's now get back to the reference group wherein supply exceeds demand. At first, price recovery, as well as investments, will be suppressed, which results in reduced supply in the long-term. When stocks of goods run out, the deficit of these goods will come into play, just like in the third reference group. This will give a good reason for prices to rise and non-monetary factors for inflation to increase.
Considering the facts mentioned above, the global economic recovery will witness unstoppable inflation. The first goods to become more expensive will those in short supply. The prices of goods in slightly higher supply will follow. Governments will simply be unable to fight these non-monetary factors for inflation. Moreover, on the backs of huge amounts of money, this inflation will be reinforced by monetary factors. When inflation starts to surge, the excess trillions of dollars in capital will begin circulation, which may hasten inflation.
Increased budget deficits and government debt won't be payable. For example, the Fed can't simply sell Treasury bonds from its balance sheet without putting the U.S. debt market at risk. In the same vein, it can't withdraw the money it printed. No rate hike will help the situation and won't pay this money back, resulting in inflation spinning out of control.
Inflation will move funds around and write off debts.
The global debt that used to be problematic and a brake on economic development will fall in value as inflation surges. For example, at the current inflation rate of 2.4% in the United States, the yield on 10-year T-bonds is already around 0.6%. That said, keeping U.S. national debt in your portfolio will cost you -1.8% a year, with inflation already priced in. As inflation surges, this process will have no alternative but to accelerate. Monetary policymakers won't be able to exit dovish policy. Even after the pandemic ends, they will continue printing money to put pressure on government bond yields.
Growth and debt
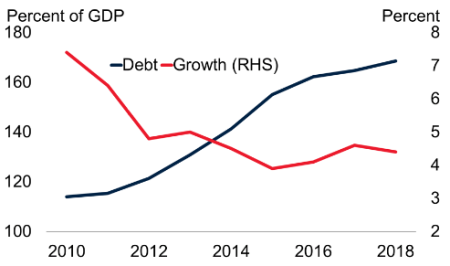
Source: https://thenextrecession.wordpress.com
Debt in emerging markets and developing economies, 1970-2018
Nevertheless, it has its advantages. As inflation due to non-monetary factors grows, it will become evident that keeping funds without investing is loss making. That means that capital not previously put in use will start to move, mostly because of price pressure. At the same time, investments and inflationary pressure will also grow. The post-Coronavirus world will experience another crisis due to high inflation levels and depreciation of excess funds.
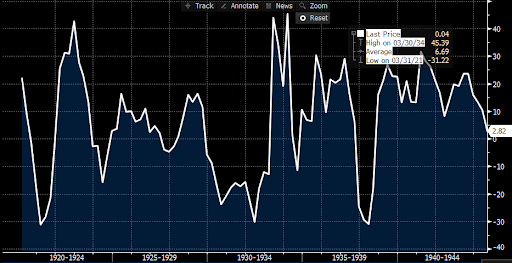
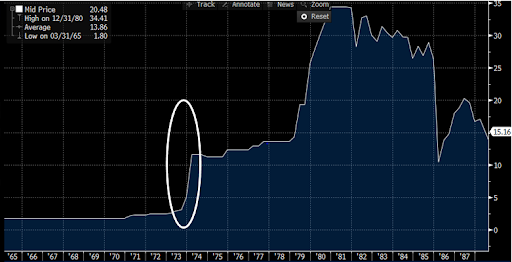
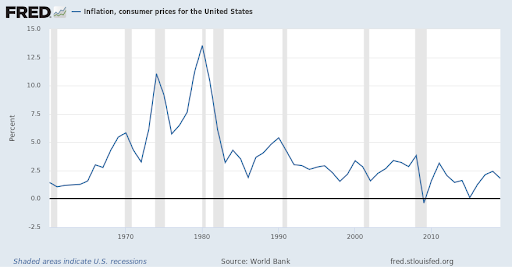
It's not all that bad. Although it sounds unnatural, global debt, which currently amounts to 230% of GDP (per IMF statements), is the main obstacle for future economic development. Depreciating to 80-100% of GDP will only do good. After capital is burned in the inflation fire, the world will be able to launch a new credit cycle in which the financial sector stimulates economic growth. The world has already seen it happen many times before. The financial system reset itself, cleared its balance and started a new cycle. The latest time it happened was in the 1970s when the U.S. economy was going through a period of stagflation (stagnation and inflation at the same time), with inflation levels climbing to as high as 12.5%. In 1973-1983, total inflation in the United States exceeded 100%, depreciating the dollar double-fold.
Source: https://fred.stlouisfed.org/
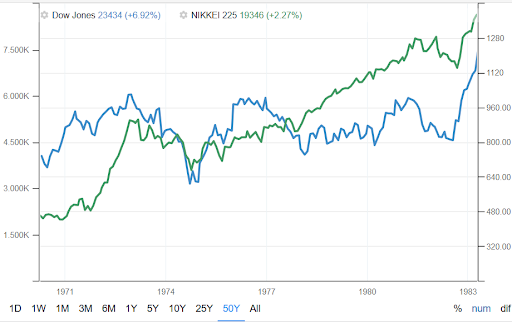
After that, however, in the 1980s and 1990s, the economy grew almost non-stop. In the late 1970s, the DowJones index stood at 800. In 2000, it was already trading as high as 11,000. After the reset in the 1970s, the world experienced a technological breakthrough that resulted in computerization. Flash forward to now, and history is most likely to repeat itself again. Once the old balance is brought tumbling down, the global economy will start looking for a new one. It will create a brand-new economic structure based on innovative technological achievements.
Prerequisites for growth
After several years of resetting, the world will finally be ready to start a new growth cycle. The CoronaCrisis and the inflation that follows will clear the road for future global economic development.
At this point, it's vital to understand that the CoronaCrisis is only a catalyst. It won't bring fresh ideas, create a new economy or serve as a foundation for future processes. All the processes that will develop either already existed or would have come to pass without the CoronaCrisis. The only difference is that in another scenario, it would probably run more smoothly and over an extended period of time.
Once the crisis comes to an end, the world will jump back into action like never before. Bankrupted companies will leave niches behind them. Those that survive will be delighted to fill the gap. Capital will flow to new, ground-breaking fields that will be burgeoning.
Many things that were discussed and developed in the last 10 years as part of the transition to a new technological paradigm will be adapted. Online trading will develop faster than the traditional setup. The crisis gave this trend, which was already in motion, has given things a new push. With most countries under quarantine, remote and online activities will be used more intensively. Everything that happens today is accelerating everything connected with the Internet. The quarantine will make people change their habits more quickly.
For example, without the CoronaCrisis, Family X would only start ordering food online five years from now. It would become a habit after seven. But life under quarantine is making people change their habits now. Family X is more likely to order food online today instead of several years from now. It's pretty indicative that:
- The search term "grocery delivery" has broken all records in the United States.
- Demand for click-and-collect services surged 83% in less than a month.
- One-third of all customers said they bought food online during the pandemic, while 41% did it for the first time.
The process of switching to remote work was already underway. The stay-at-home order will accelerate that as well.
Even before the crisis, many believed that biotechnologies would be the future. Combatting the Coronavirus will attract countless investments in this field. The world won't just research viruses and look for vaccines; it will also contribute to developing related fields.
Robotics, green energy, new materials (e.g., composites) and nanotechnologies existed prior to the crisis. During the crisis, these fields will become more attractive for investments. This will change our world and the economic structure while increasing labour efficiency. But there is one more thing to consider. The CoronaCrisis won't demolish infrastructure and goods, so the 'old' economy won't come to any harm. That means that there's no need to spend resources to restore it. As a result, the old investment requirement will be very low, which will save resources for the new.

Competition
This process, like any other evolutional process, will have its winners and losers. Many things that we're used to will change, since social issues, politics and the economy are closely intertwined.
Robotics and increased labour efficiency are more likely to widen the gap between the rich and the poor. During the last economic growth cycle in the 1970s, the main driving force belonged to developing countries whose share in the global GDP continually grew. That might not be the case for this economic cycle since robots are probably going to be more efficient than human workers. In the new scheme of things, the countries with the most capital-intensive economies will be among the winners. Most logically, those will be the richest countries. As a result, developed countries will evolve more quickly than developing ones.
The demographic boom that developing countries experienced over the last 50 years in combination with their future underdevelopment can lead to significant social turbulence, which may even result in large-scale wars. Climate change will compound these problems.
Another factor that will impact competition is changing of the guard between generations of Western decisionmakers. An emblematic politician in this regard is Donald Trump, who is more partial to protectionism and less open to globalisation. It's worth mentioning that the world's most influential people belong to the so-called Beatles Generation. These are democratic and open-minded people, the hippie generation that protested against the Vietnam War. The new generation to come will be more conservative.
These two factors will significantly change globalisation, with second- and third-world countries on the losing end of the stick.
On the political side, the CoronaCrisis will aid protectionist and conservative views to gain traction. Trump's trade war that took place even before the pandemic is most likely to mark a starting point for similar processes.
The Chinese economy, which has been growing non-stop since the 1970s, probably won't be among the leaders of the next growth cycle. The crisis can spark irreversible internal processes that may start a 'fire' in the country. The first spark was seen in Hong Kong protests.
China's growth significantly boosted the large bourgeoisie class, which is clenched by the Communist Party's top-down command structure. The coexistence of these two powers was possible during the booming growth, but a crisis may change all that. With the country hit hard, a conflict between these two forces may nix the Chinese economy's future growth. China probably won't be the world's new hegemon. On the contrary, it will likely recede. There are many historical examples to illustrate similar cases. The Russian Empire at the beginning of the 20th century and the USSR's unexpected collapse. China most probably won't fall apart, but an internal conflict won't allow it to take leading positions in the upcoming competition. Nevertheless, with the rarest earth elements, the country may maintain its influence over the West. Furthermore, between 2005 and 2019, China issued loans worth $2.2 trillion to the world's economies, actively expanding its influence in Africa and Latin America.
Protesters and the police in the streets of Hong Kong, 29 September 2019

Robotics won't be the only industry to develop more quickly. Green energy will most likely follow. With new materials appearing, the value of different natural resources may be reviewed, which will lead to regional changes. In the new world paradigm, yesterday's commodity kings may be ousted from their long-held thrones.
The world we knew is going to change. This will apply to the economy and its structure, as well as to technologies, social structure and the pace of countries' development. This is a natural process. The world has always evolved and changed. Most of the time, drastically. The new realities to come were always seen as something eccentric by the people living in those times.
But look to history. In 1975, few could imagine the USSR falling, global computerisation and the Chinese economic miracle. In 1930, nobody had a clue of what the world would have to go through in the next 50 years. If we take any relatively long period of time, we'll always find changes that were initially hard to believe in. That's why we don't need to fear the future. The world has been challenged dozens of times but never stopped growing and developing. We will overcome this crisis, too!
The impact on different asset groups based on various scenarios
Stocks
The Chinese economy shrank in Q1 2020 after weeks of economic activity were lost due to quarantines, production stoppages and business lockdowns. For example, in January and February, manufacturing output fell by 13.5% year-over-year while retail sales dropped by 20.5%. Investment in equity declined by 24.5%.
In late March, the first signs of a rebound could be seen, with the curve of new Coronavirus cases flattering and the travel restrictions gradually lifted. Still, the economy will have a hard time recovering in 2020 with weak external demand, as the rest of the world deals with the consequences of the Coronavirus outbreak.
The only thing that's clear at this point is that the economy was walloped. Nevertheless, the extent of the pandemic's impact on the GDP growth rate depends entirely on how long the current situation will last.
No matter how long the economy will be on lockdown, the short-term impact and long-term prospects for specific industries will only be negative (see the table). Air travel, tourism and local businesses will be hardest hit since the majority of the people who planned to travel in June-August have already cancelled their plans (see the figure).
Source: The Wall Street Journal
Government spending, assistance packages and central banks' interventions supported the key indexes during the last ten days of March when the assistance package was approved and began to hit the market. Locally, the bottom was reached in mid-March.
The transport industry, specifically, airlines, were devastated after the virus prompted a travel ban.
The energy sector, including oil and gas companies, lost over 30% since the end of January 2020. The price for this industry's equities was pressured by a sharp decline in prices for energy commodities.
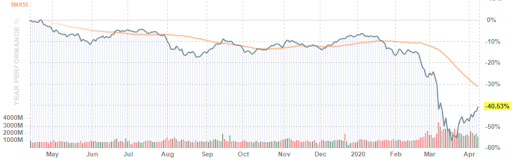
The financial sector, particularly, banks, wasn't spared the same fate. The market is concerned about losses in the credit sector and liquidity shortages. Still, the assistance packages and the central bank's initiatives supported this sector.
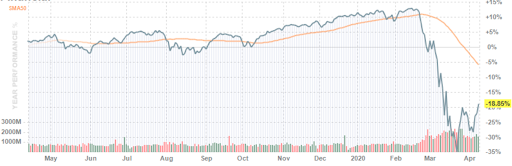
The technology, media and telecoms sector wasn't affected much, mostly due to its relative independence from fall in consumer spending. Nevertheless, it was negatively impacted by supply chain ruptures, production delays and other problems. In the best-case scenario, the technology sector's growth will slow to 2%. With a full-fledged recession in place, we can expect a 2% fall in 2020.
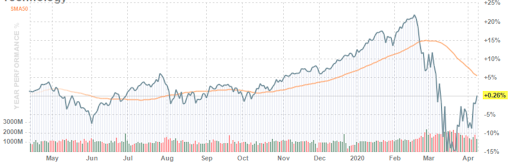
The production sector is one of the hardest hit, with factories standing idle and travel bans causing delivery delays. It's experienced the highest job losses since 2009. Despite China coming back into play again, most European manufacturers will have their facilities entirely or partially closed until the COVID-19 situation in Europe stabilises.
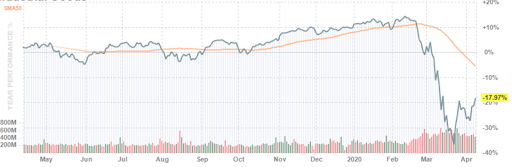
The healthcare, science and biotechnologies sector has a more positive outlook than the rest of the market. It has long-term growth potential if consumers start spending more on vaccines and new research will attract more investments.

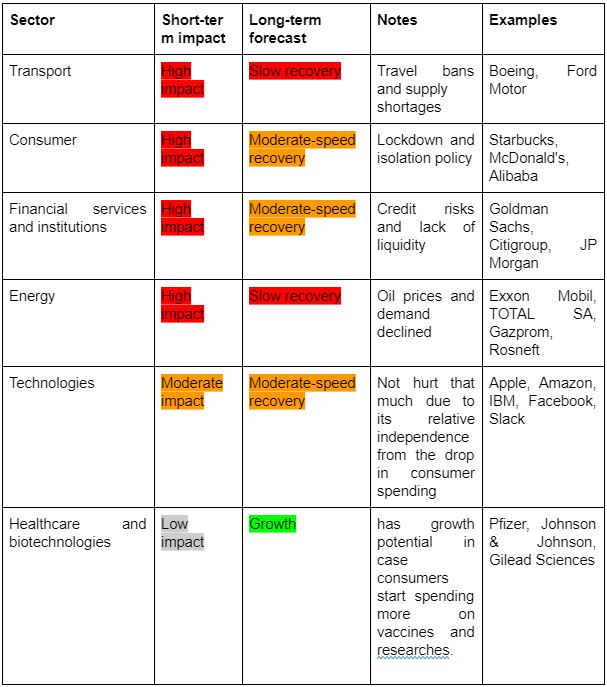
Bottom line: Considering all the aforementioned and the data available as of writing this report, we recommend a portfolio-balance approach for indexes and stocks. You can choose between major indexes of the sector and stocks of companies that belong to this sector. The technology and healthcare sectors are going to carry the most weight in the investment portfolio since they both performed quite well and are resistant to global panic. Invest 30% in each for a combined total of 60%. Invest 15% in both the financial and consumer sectors. They were both hit hard, but are going to recover moderately within 6-12 months as people get back to normal life. The other 10% should be split evenly between the energy and transport sectors that suffered the most.
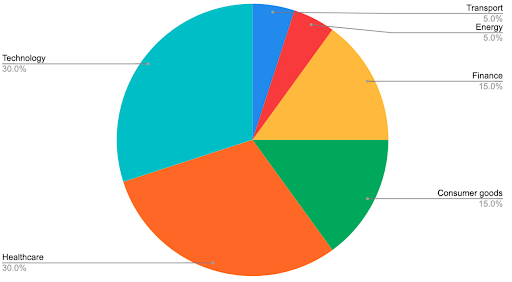
This is how you might split your portfolio between industry leaders' stocks:
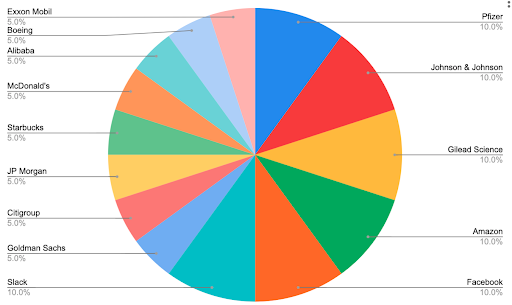
Regionally, take into account economic forecasts for the chosen countries and regions, as well as when they will hit bottom and the extent to which they will suffer from the consequences. For example, significantly lower growth potential for China (see the Macroeconomic Forecast section) will also negatively impact the economies that depend primarily on supply from China. These are Japan, Australia, South Korea and Indonesia, among others. Developed countries are going to be pressured by the decline in consumer and business sentiment, supply disruptions and weakened external demand. On the other hand, access to unlimited liquidity will support and stimulate GDP and inflation growth. For emerging markets, the forecasts remain mostly negative.
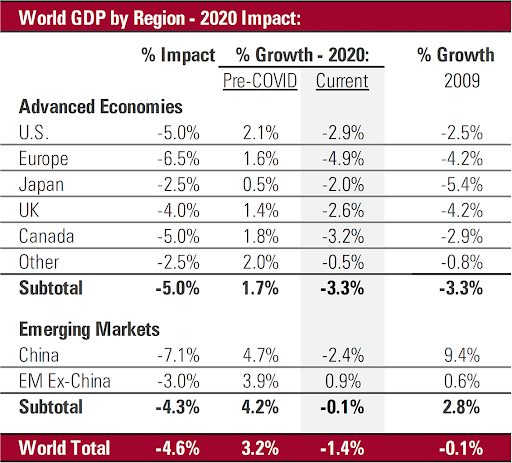
Source: Morningstar (www.morningstar.com.au)
The growth forecasts for 2020 and recovery prospects in 2021 suggest a portfolio with country indexes. The biggest share should be given to American indexes. Split the risks evenly between the technology sector (NASDAQ), major companies' index (Dow Jones 30) and minor companies' index (Russell 2000). Our choice fell on the Dow Jones 30 since its companies also pay high dividends. Another share of the portfolio will be spared for northern European countries, such as the Netherlands and Germany, that have little to no credit risks. The rest is allocated to the emerging economies of Chile and Mexico.
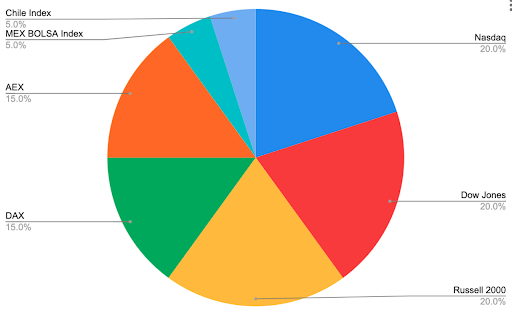
It may take 6-9 months to build up this portfolio, which should be kept for over 12 months.
Commodity market
Oil
During the COVID-19 outbreak, with major economies under rigorous quarantine, the daily global oil demand contracted by 15 million barrels, per OPEC+ data. The world's leading investment banks estimate this number to be about 25 million barrels. Global oil demand was 100 million barrels per day before the epidemic.
After OPEC+ failed to agree to a new deal, and Russia and Saudi Arabia started a price war in the midst of the pandemic, the global oil industry faced an unprecedented crisis. This is more than producing countries and companies' losses. A vast oversupply could lead to a quick rise in oil reserves. Further on, the production cuts caused by it may get out of hand.
Facing a real threat, producing countries and companies did what they had to do. They teamed up, leaving the clash behind to fight the threat that could wreak havoc on the sector. Even the United States, which had always previously insisted on low prices, was willing to discuss higher prices and production cuts.
The CoronaCrisis highlighted a fundamental factor for the oil market: one of its strong players, the United States, is vulnerable to oil prices below $30. To save itself, this player is willing to negotiate, even with OPEC+.
The OPEC+ decision to cut production by 9.7 million barrels per day will support oil prices. Another equally important aspect is how OPEC+ once again proved its ability to bring members together and negotiate to solve issues.
Agricultural commodities
With almost all kinds of financial assets being sold off during the COVID-19 pandemic, agricultural commodities remained mostly intact. Wheat, coffee and soya beans fell only 1-9% since the beginning of the year.
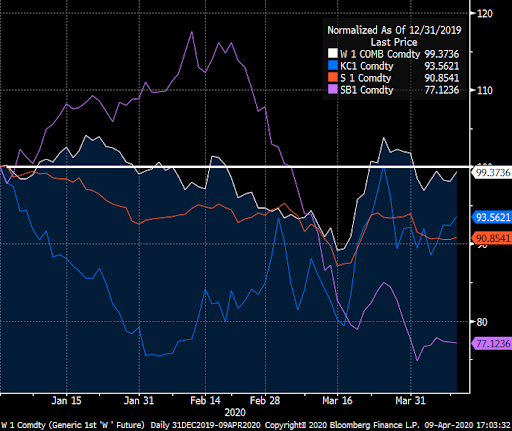
Source: Bloomberg
No matter how bad the situation with COVID-19 gets, these assets are not expected to fall significantly. Even with longer lockdowns, food prices are only expected to rise. Still, the financial markets are definitely not pricing it in yet.
We suggest that the movement of this group of tools in 2020 will be routinely defined by weather conditions. When considering large-scale natural disasters, prices for specific goods are likely to climb higher. If the COVID-19 pandemic becomes critical, agricultural assets will be considered undervalued and may grow significantly.
Metals market
When looking back to the 2000 and 2008 crises, we can see that gold, a typical safe-haven asset, either grew or traded in a range while the S&P 500 declined.
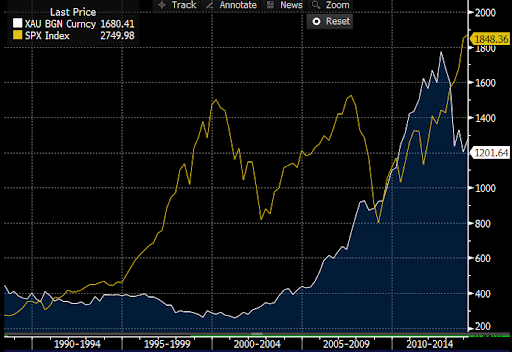
This movement is backed up by a logical shift from high-yielding risky assets to safe havens.
Nevertheless, during the pandemic, gold may not surge due to decreased demand. For example, central banks will need less gold as their main task is stimulating the economy, not building up gold reserves. Moreover, some part of these reserves may be sold out, which will constrain growth. However, it is most likely that the precious metal will be able to stay at its levels or even move upward. This is because the world's economies entered the crisis with debts at their maximum level (total global debt exceeds the 2008 amount by almost double), while central banks are extremely dovish. In the times of an ever-falling interest rate and large-scale money injections, gold is the best option for savings, and institutional investors understand that. Demand for gold ETF funds is showing a solid rise, once again hitting highs last seen in 2012.
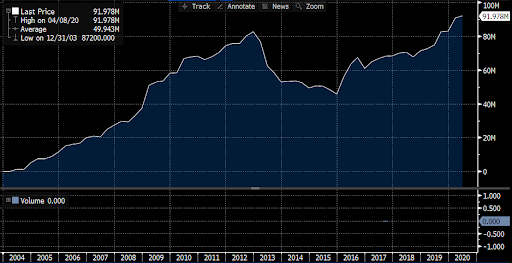
The crisis is very likely to drive many businesses to bankruptcy. A vast amount of commercial and industrial chains have been disrupted, entire countries are on lockdown and demand for commodities is low, which makes them cheap. With energy commodities getting hit, industrial metals are also likely to follow in their path. Still, after the crisis peaks within 6-12 months, some resource restrictions are likely to be introduced (as a number of companies will have likely failed), and the deficit will push prices higher.
Silver will follow nearly the same pattern. Moreover, the gold/silver ratio is currently at its all-time high. This leaves one to assume that undervalued silver is likely to grow faster than gold.
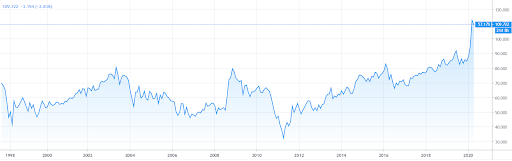
A wise strategy would be to buy precious metals during pullbacks. Gold may hit $1900 per ounce while silver can climb to $20.40.
Platinum metals are trading in the opposite direction. After retreating from its highs, palladium is gaining momentum again. Platinum is trading close to 16-year lows. Considering the fact that these metals play an essential role in the manufacturing sector, particularly in automotive catalysts, they are very likely to continue facing downward pressure during the crisis and the first months after it. One of the reasons for this is that this sector entered the crisis already in bad shape. In particular, China and Germany experienced a drop in car manufacturing in the last two and three years, respectively.
Data for the beginning of 2020 is even more dismal. Automotive production in China fell by 25%, making it the largest drop since 1999 when the metric was created. South Korea experienced a 29% slide while the United Kingdom saw a 14% drop. In Germany, the sector fell by 9% in January. Furthermore, the lockdown imposed on entire countries negatively affects all production cycles, including the automotive industry's. This will determine the drop in demand for palladium. Nevertheless, the resource restrictions mentioned above may result in a metal deficit, which will cause prices for it to go up. As such, a wise strategy for platinum metals would be to sell during the next 2-3 months and buy (partially, on pullbacks) starting in the mid-Summer 2020. If events take a positive turn, palladium may return to its February 2020 highs of around $2800.00.
China, the biggest copper consumer, is reopening. Still, it won't allow the red metal to resume growth just yet. In the upcoming months, prices for it may continue to drop to around 1.95. At this level, it's already a good buying opportunity as long as the COVID-19 situation doesn't fall out of control. In this way, the strategy for copper is very similar to the one for platinum metals.
FOREIGN EXCHANGE
During the crisis, the Forex market will be volatile as it reacts to the economic stimulus measures, how the Coronavirus plays out and restrictions in place, as well as the safety margin accumulated in the years prior to the crisis. Foreign trade and the debt load will also be key factors.
The most protected currencies during the CoronaCrisis are from the countries that have already passed the epidemic's peak and are waiting to restart production and put people back to work or already have done so. In this sense, the Chinese yuan is of interest. Nevertheless, this currency is very risky in terms of manual regulation by the Chinese government. One sunny morning, you may learn that the People's Bank of China suddenly decided to cut interest rates, to add liquidity or to change the fixed exchange rate for the U.S. dollar.
Countries that have decided not to quarantine themselves, such as Belarus and Sweden, will also be vulnerable since they depend on the external demand. The Belarusian ruble has already lost 23% year-to-date, while the Swedish krona fell by 10.8% in March on the wave of neighbouring European countries' lockdowns.
Currencies backed by gold and currencies of the countries with vast reserves are becoming particularly attractive. — for example, the Swiss franc and the Japanese yen. In Q1, JPY/USD grew by 1.3%, while CHF/USD rose in value by 0.6%. Despite experiencing high volatility, their traditional safe-heaven role has attracted investors.
During the CoronaCrisis, the Eurozone will be vulnerable, although a restrained budgetary policy will prevent the euro from sinking too low in the long term. Vast internal consumption and a low debt load will support the European currency. Still, significant decentralisation risks are landing at the region's doorstep, as it dives deeper into the crisis. Italy, Spain and France, which have been the hardest-hit countries in Europe, will be willing to stimulate their economies more eagerly. Considering calls for independence from the EU even before the crisis, the situation may get complicated. If that happens, EUR/USD will experience dramatic pressure that may push it to parity. Nevertheless, it won't happen overnight. Exiting the EU would require an internal referendum, which would be followed by long negotiations that could take years as we already saw with Brexit.
Despite trillions of liquidity injections, the dollar will be in demand during the first stage of the crisis. Worldwide demand for U.S. Treasury bonds and capital flow from emerging markets will support the American currency. It is essential to understand that the dollar's upsurge during the first four to six months of the crisis is historic. Nevertheless, by Autumn 2020, the trend may reverse, which would be confirmed by accelerated inflation. High inflation and low Treasury yields may trap the dollar, resulting in it beginning to slide downward.
During the first and second waves of the recession, commodity currencies will be toxic since energy commodities and industrial metals will be under pressure. It will take a long time for demand to recover. For example, metal is widely used in construction and car manufacturing. With the real estate sector stagnating, construction projects will be put on halt, especially in regions with high tourism, meaning that demand for metal will be low. A similar situation may be seen in the automotive industry, where production fell by over 75% in Q1 2020. As a result, currencies of countries that depend on the ferrous and non-ferrous metal industry will be under pressure. By way of example, the Chilean peso lost 13.8% in Q1 2020.
A similar occurrence happened in the oil and gas market, which experienced a dramatic downfall that required major oil-producing countries to take action. The currencies of those countries also dropped significantly: Russia, Kazakhstan, Norway, Mexico, Canada and even Saudi Arabia, whose national currency, the riyal, also lost value. Most importantly, there are reasons to believe that demand won't recover, and despite higher oil prices, these countries' currencies will still be under pressure due to low export levels.
The Black Sea Region and Latin America countries that export agricultural products will also be under pressure, as they react to the pricing environment. For these countries, debt and investment activities are playing a key role. That's why it's important to track the debt load and reserves for them, which should be enough to cover the trade balance deficit and budget expenses. Most of these countries will rely on IMF assistance.
To understand if the commodity countries crisis has bottomed out, track the Baltic Dry Index, which should begin to recover.
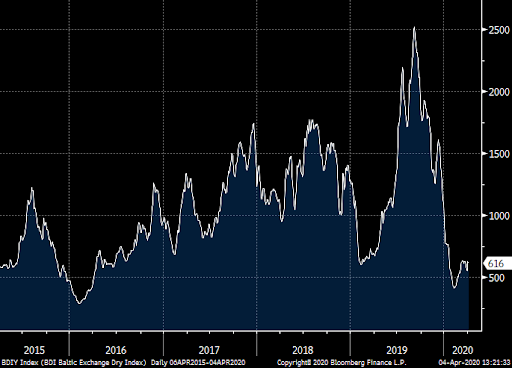
Source: Bloomberg
Finally, it's worth noting that in the upcoming 4-6 months, the dollar will strengthen against most currencies. Its index may trade as high as 115. It will reverse as inflation in the United States exceeds 5-6% while Treasuries yields remain low.
The Japanese yen and Swiss franc will appear to be stronger than the market. These currencies can be kept long-term alongside the dollar.
The euro will be under pressure. During the 2008 crisis, EUR/USD fell by almost 20% in 3 months. Currently, its bottom is at the 1.0 parity level. Still, a lot will depend on market sentiment and the economic state of fringe countries.
Commodity currencies, as well as overly indebted countries' currencies, will be particularly vulnerable. The basic tactic for them is to sell.
Cryptocurrencies
The cryptocurrency market has finally found out what a crisis feels like. Indeed, it was right at the height of the last financial crisis, back in 2008, when a person or group of people going by the alias Satoshi Nakamota published a white paper describing the protocol and operating principle of Bitcoin. And by January 2009, the Bitcoin mining network was already up and running.
This event showcases that during a financial crisis, society looks for alternatives to replace standard money and payment methods.
The current pandemic and the economic consequences that follow are no exception. Therefore, cryptocurrencies, specifically Bitcoin, are likely to grow in the near future.
Inflation and commodity currencies' devaluation will be the main drivers behind cryptocurrencies' rally. These global risks have never been closer, which makes alternative digital money that is inflation-free incredibly attractive and increases demand for it.
Recent Google Trends search query statistics show that as soon as the financial markets descended into panic at the beginning of March, interest in purchasing Bitcoin went sky high.
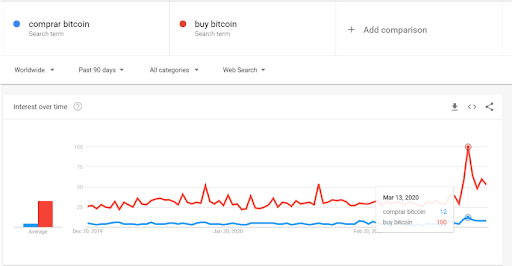
Upon a closer analysis by region, we see that several African countries were among the leaders. It's interesting to note that the number of these search queries increased as African countries' national currencies rapidly devaluated against the dollar. The Nigerian naira, for example, hit its all-time low again, while the Ghanaian cedi was down by 7.5%. This once again shows that during a crisis, people tend to look for "alternative money", especially in countries where the government is not able to provide the population with access to a large enough supply of US currency, and where the level of economic and political risk is much higher.
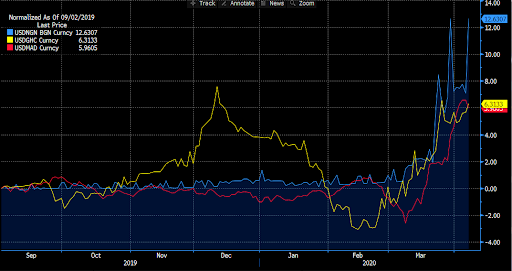
Countries with commodity-based economies are in the risk zone due to the threat posed to their national currencies by the global economic downturn and fall in commodity prices. This can start a chain reaction when national currency inflation and devaluation urge people around the world to buy cryptocurrency, just like what happened in Africa.
In the United States and Europe, cryptocurrencies will also be in demand due to slowly creeping inflation. These countries announced unprecedented monetary stimulus measures. The Fed is prepared to buy up Treasury obligations and other bonds and is also ready to grant loans to companies and small business owners. The ECB also previously announced its monetary stimulus, which includes quantitative easing worth 750 billion euros. Similar measures were taken by the Bank of England, the Reserve Bank of Australia, the Bank of Canada and the Bank of Japan. Although this stimulus aims to support the economy and help it recover, it will inevitably trigger inflationary processes.
That being said, there will be a significant surge in demand for cryptocurrencies, which aren't affected by global devaluation and inflation. When the share of people possessing this asset increased, businesses that switched to online and remote operation will follow this trend, thus cementing widespread cryptocurrency use.
The top 5 most promising cryptocurrencies
Bitcoin. The cryptocurrency with the highest capitalization rate. The most popular and well-known, which gives it the largest growth potential. Bitcoin Cash. An improved version of Bitcoin with a lower fee and faster transaction speed, which will be as popular as its 'older brother'. Ripple. Most likely to be popular among businesses. Essentially, it is an alternative banking system that has several advantages, including fast international transactions. Ethereum. The biggest platform for creating decentralized online services based on blockchain technology, which is widely used in many operating projects. EOS. It uses Ethereum technology and has some advantages and differences. It is used on an industrial scale.
We suppose be right to focus on as few cryptocurrencies as possible. on as few cryptocurrencies as possible. The first to move will be the cryptocurrencies with the highest capitalization and capacity. First up is Bitcoin. It will be the first to trigger a move in other cryptocurrencies.
Be careful when trading cryptocurrencies that aren't in the Top 30. These are high-risk currencies. Due to high risk we think that if will be better avoiding cryptocurrencies whose capitalisation doesn't put them in the Top 100. avoiding cryptocurrencies whose capitalisation doesn't put them in the Top 100. Most of the time, these are so-called 'trash' cryptocurrencies, which have a high risk of being manipulated.
Appendix 1
A summary table of all the crises, including their name, depth, duration of the stock market fall, reasons why and actions taken.
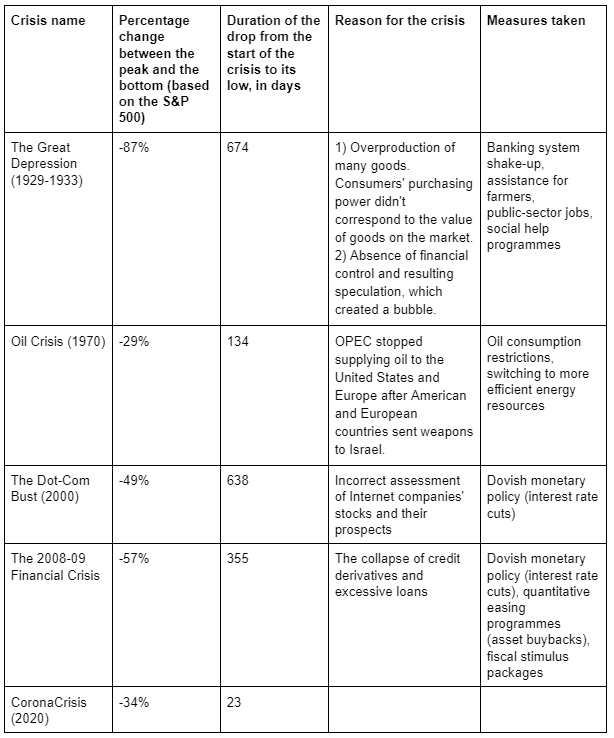
DISCLAIMER: The content of this material represents a general view of the market news and does not take into consideration individual readers’ personal circumstances, investment experience or current financial situation. The content of this material constitutes Marketing Communication or Investment Rеsеаrсh and does not constitute Investment Аdviсе. Indication Investments Ltd and/or its brands may provide general commentary that is not intended as investment аdviсе and must not be construed as such. Indication Investments Ltd shall not accept any responsibility for any losses of traders due to the content of this material or its use.
Indication Investments Ltd assumes no liability for errors, inaccuracies or omissions. Further, it does not guarantee the accuracy or completeness of information, text, graphics, links or other items contained within these materials.
Pronto ad iniziare?
Unisciti alle migliaia di utenti di Libertex.
L’83% dei conti degli investitori retail perde denaro