

Amazon (AMZN) Stock Price Prediction 2026
Prepared by the Libertex team
Content reviewed internally in accordance with regulatory standards.
Amazon is a globally operating company specialising in e-commerce, artificial intelligence, cloud computing, and streaming. It is one of the Big Five U.S. technology companies, alongside Alphabet (Google), Apple, Microsoft, and Meta – a market giant with strong long-term fundamentals and consistently high investor interest
Whether you are considering investing in Amazon shares through Libertex or simply tracking AMZN's potential, this article compiles forecasts from multiple independent sources alongside technical and fundamental analysis to give you a well-rounded picture.
Is Amazon's stock future bright enough to consider? Read on to find out.
Key Takeaways
- For 2026, LongForecast and Kursprognose project AMZN closing prices ranging from approximately 261 USD to 269 USD in December, reflecting a bullish near-term sentiment.
- For 2027, forecasts diverge: LongForecast projects an aggressive rally toward 384 USD by December, while Kursprognose anticipates a steadier rise to around 373 USD.
- For 2028, LongForecast projects continued growth to approximately 385 USD year-end; Kursprognose estimates a range of 296–463 USD.
- Long-term through 2030, CoinPriceForecast estimates AMZN reaching approximately 466 USD at year-end, representing a potential 83% gain from current levels.
Recent Updates
- AMZN is currently trading at approximately 254.98 USD (as of 24.09.2026), with a 0% change over the past 30 days. Average daily volume: 38.9M. Market capitalisation: 2.74 trillion USD.
- Latest 2026 forecasts for December show a range of 269 USD (LongForecast) to 261 USD (Kursprognose), a spread of approximately 3.1%.
- For 2027, LongForecast maintains an aggressive growth scenario up to 384 USD; Kursprognose projects a steadier rise toward 373 USD by December.
- Technical analysis as of 24.09.2026 shows 8 oscillators signalling Buy, 2 Sell, and 1 Neutral among momentum indicators, while 10 of 12 moving average signals point to Buy and 2 to Sell — indicating a strong bullish short-term direction.
Amazon (AMZN) Current Stock Price
Amazon at a Glance
Amazon, Inc. was founded on 5 July 1994 by Jeff Bezos in Seattle, Washington. Starting as an online bookstore, it grew within a few years into one of the world's largest technology conglomerates. Today Amazon specialises in e-commerce, cloud computing (AWS), digital streaming, and artificial intelligence, operating in over 200 countries with more than 1,556,000 employees worldwide.
| Name | Amazon, Inc. |
| Traded as | AMZN |
| Website | www.amazon.com |
| Industry | E-Commerce & Cloud Computing |
| Founded | July 5, 1994 |
| Founder | Jeff Bezos |
| CEO | Andy Jassy |
| Market Capitalisation | 2,740,000,000,000 $ |
| Equity | 285.0 bn $ |
| Free Cash Flow | 38.5 bn $ |
| All-Time High | 287.2 $ |
| Revenue (TTM) | 716,920,000,000 $ |
| P/E Ratio | 31.7 |
| EPS | 7.29 $ |
| ROE | 18.89 |
| Average Volume | 38,924,500 |
| Number of Employees | 1,556,000 |
Source: Web3Forecast (24.09.2026)
Amazon Stock Price Prediction for 2026 — LongForecast
LongForecast projects AMZN to close 2026 at approximately 269 USD in December, with monthly closing prices ranging from 236 USD to 269 USD over the remainder of the year.
| Month | Min – Max (USD) | Closing Price (USD) | Change, % |
| September 2026 | 222 – 268 | 248 | -0.4% |
| October 2026 | 216 – 273 | 247 | -0.8% |
| November 2026 | 217 – 255 | 236 | -5.2% |
| December 2026 | 236 – 291 | 269 | 8% |
Source: LongForecast (24.09.2026)
Amazon Stock Price Prediction for 2026 — Kursprognose
Kursprognose's latest data for Amazon shows a positive trend toward end-2026. In December 2026 the average closing price is projected at approximately 261 USD, within a range of 229–282 USD, implying a 2.4% change from current levels.
| Month | Low – High (USD) | Closing Price (USD) | Total, % |
| September 2026 | 222 – 273 | 253 | -2.7% |
| October 2026 | 216 – 270 | 239 | -8.1% |
| November 2026 | 211 – 247 | 229 | -11.9% |
| December 2026 | 229 – 282 | 261 | 0.4% |
Source: Kursprognose (24.09.2026)
Amazon Stock Price Prediction for 2027 — LongForecast
Producing a precise long-range forecast is inherently difficult. The figures below represent one quantitative scenario rather than a certainty.
According to LongForecast, Amazon's stock is projected to appreciate significantly in 2027, starting from approximately 239 USD in January and rising toward 384 USD by December. Monthly growth rates in this scenario point to a strongly bullish full-year outlook.
| Month | Min – Max (USD) | Closing Price (USD) | Change, % |
| January 2027 | 220 – 269 | 239 | -4% |
| February 2027 | 239 – 297 | 275 | 10.4% |
| March 2027 | 254 – 298 | 276 | 10.8% |
| April 2027 | 261 – 307 | 284 | 14.1% |
| May 2027 | 270 – 318 | 294 | 18.1% |
| June 2027 | 271 – 319 | 295 | 18.5% |
| July 2027 | 274 – 322 | 298 | 19.7% |
| August 2027 | 298 – 356 | 330 | 32.5% |
| September 2027 | 306 – 360 | 333 | 33.7% |
| October 2027 | 327 – 383 | 355 | 42.6% |
| November 2027 | 328 – 386 | 357 | 43.4% |
| December 2027 | 353 – 415 | 384 | 54.2% |
Source: LongForecast (24.09.2026)
Amazon Stock Price Prediction for 2027 — Kursprognose
According to Kursprognose, Amazon's stock shows a broadly positive trajectory in 2027. Projected average monthly prices range from approximately 232 USD to 373 USD, with forecast lows near 213 USD and highs reaching 403 USD.
| Month | Low – High (USD) | Closing Price (USD) | Total, % |
| January 2027 | 213 – 261 | 232 | -10.8% |
| February 2027 | 232 – 288 | 267 | 2.7% |
| March 2027 | 247 – 289 | 268 | 3.1% |
| April 2027 | 254 – 298 | 276 | 6.2% |
| May 2027 | 263 – 309 | 286 | 10% |
| June 2027 | 264 – 310 | 287 | 10.4% |
| July 2027 | 267 – 313 | 290 | 11.5% |
| August 2027 | 290 – 347 | 321 | 23.5% |
| September 2027 | 298 – 350 | 324 | 24.6% |
| October 2027 | 317 – 373 | 345 | 32.7% |
| November 2027 | 319 – 375 | 347 | 33.5% |
| December 2027 | 343 – 403 | 373 | 43.5% |
Source: Kursprognose (24.09.2026)
Amazon Stock Price Prediction for 2028 — LongForecast
LongForecast projects Amazon's stock to open 2028 at approximately 414 USD and close the year at around 385 USD. The data suggests a volatile path within the year, with a trough near 331 USD in April and a peak near 474 USD in October.
| Month | Min – Max (USD) | Closing Price (USD) | Change, % |
| January 2028 | 381 – 447 | 414 | 66.3% |
| February 2028 | 377 – 443 | 410 | 64.7% |
| March 2028 | 341 – 410 | 371 | 49% |
| April 2028 | 305 – 371 | 331 | 32.9% |
| May 2028 | 330 – 388 | 359 | 44.2% |
| June 2028 | 349 – 409 | 379 | 52.2% |
| July 2028 | 366 – 430 | 398 | 59.8% |
| August 2028 | 392 – 460 | 426 | 71.1% |
| September 2028 | 407 – 477 | 442 | 77.5% |
| October 2028 | 436 – 512 | 474 | 90.4% |
| November 2028 | 371 – 474 | 403 | 61.8% |
| December 2028 | 354 – 416 | 385 | 54.6% |
Source: LongForecast (24.09.2026)
Amazon Stock Price Prediction for 2028 — Kursprognose
Kursprognose projects Amazon's stock in 2028 within a range of approximately 296 USD to 463 USD depending on the month, with an overall positive annual trend and moderate volatility.
| Month | Low – High (USD) | Closing Price (USD) | Total, % |
| January 2028 | 370 – 434 | 402 | 54.6% |
| February 2028 | 366 – 430 | 398 | 53.1% |
| March 2028 | 331 – 398 | 360 | 38.5% |
| April 2028 | 296 – 360 | 322 | 23.8% |
| May 2028 | 321 – 377 | 349 | 34.2% |
| June 2028 | 339 – 397 | 368 | 41.5% |
| July 2028 | 356 – 418 | 387 | 48.8% |
| August 2028 | 381 – 447 | 414 | 59.2% |
| September 2028 | 395 – 463 | 429 | 65% |
Source: Kursprognose (24.09.2026)
Amazon Long-Term Stock Price Forecast 2030–2035 — CoinPriceForecast
CoinPriceForecast projects strong long-term appreciation for Amazon's stock. By year-end 2030 the price is estimated at approximately 466 USD (+83% from today), with the uptrend continuing toward 670 USD by 2035. These figures assume continued growth in AWS, advertising, and AI-related revenues.
| Year | Mid-Year (USD) | Year-End (USD) | Today / Year-End, % |
| 2030 | 443 | 466 | 87 |
| 2031 | 474 | 513 | 106 |
| 2032 | 551 | 589 | 136 |
| 2033 | 601 | 614 | 146 |
| 2034 | 627 | 641 | 157 |
| 2035 | 655 | 670 | 169 |
Source: CoinPriceForecast (24.09.2026)
Amazon Stock Technical Analysis (24.09.2026)
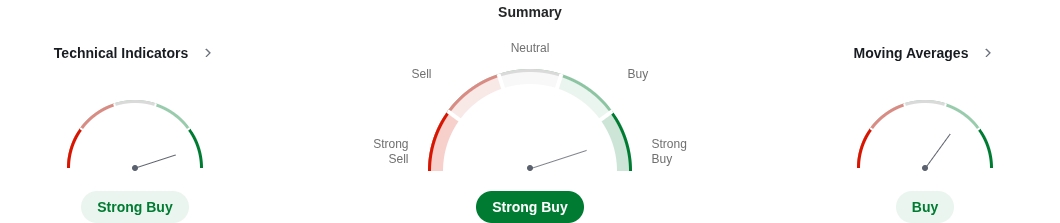
Technical analysis uses historical price data to identify potential future trends. The tables below reflect indicator readings as of 24.09.2026 and are provided for informational and educational purposes only — they do not constitute trading signals or investment advice.
Oscillator Readings:
| Name | Value | Action |
| RSI(14) | 56.31 | Buy |
| STOCH(9,6) | 69.2 | Buy |
| STOCHRSI(14) | 32.29 | Sell |
| MACD(12,26) | 22.23 | Buy |
| ADX(14) | 26.87 | Sell |
| Williams %R | -41.59 | Buy |
| CCI(14) | 65.8 | Buy |
| ATR(14) | 33.96 | High Volatility |
| Highs/Lows(14) | 0 | Neutral |
| Ultimate Oscillator | 58.1 | Buy |
| ROC | 6.476 | Buy |
| Bull/Bear Power(13) | 20.37 | Buy |
Source: Investing (24.09.2026)
Moving Average Values:
| Name | Simple Value | Simple Action | Exponential Value | Exponential Action |
| MA5 | 257.92 | Sell | 251.73 | Sell |
| MA10 | 244.31 | Buy | 245.93 | Buy |
| MA20 | 230.73 | Buy | 231.22 | Buy |
| MA50 | 181.69 | Buy | 197.38 | Buy |
| MA100 | 153.56 | Buy | 157.86 | Buy |
| MA200 | 88.79 | Buy | 112.17 | Buy |
Source: Investing (24.09.2026)
Pivot Points:
| Name | S3 | S2 | S1 | Pivot | R1 | R2 | R3 |
| Classic | 215.28 | 235.15 | 247.46 | 267.33 | 279.64 | 299.51 | 311.82 |
| Fibonacci | 235.15 | 247.44 | 255.04 | 267.33 | 279.62 | 287.22 | 299.51 |
| Camarilla | 250.92 | 253.87 | 256.82 | 267.33 | 262.72 | 265.67 | 268.62 |
| Woodie | 211.5 | 233.26 | 243.68 | 265.44 | 275.86 | 297.62 | 308.04 |
| DeMark's | - | - | 241.3 | 264.25 | 273.48 | - | - |
Source: Investing (24.09.2026)
The purpose of technical analysis is to estimate the probability of price direction based on historical patterns. As of 24.09.2026, the oscillator and moving average readings indicate a broadly bullish short-term bias, with the majority of both oscillators and moving averages signalling Buy. Investors with a longer time horizon should weigh technical signals alongside the fundamental and forecast data in this article. Please conduct thorough research before making any investment decision — no forecast or technical reading can replace independent due diligence.
How Amazon Stock Forecasting Methods Work and Their Reliability
The forecast figures presented above come from services that use different methodologies. Understanding these differences helps readers interpret the often wide divergence between projections.
There are three principal approaches used by the agencies cited here. Quantitative and algorithmic models — used by services such as WalletInvestor and LongForecast — feed historical price data, volume patterns, and statistical regression into automated systems to generate forward projections. Trend-extrapolation models — used by Kursprognose — extend observed price trajectories using moving averages and seasonality factors. Fundamental-hybrid models — used by CoinPriceForecast — layer in earnings estimates and revenue growth assumptions alongside price-based inputs.
Short-term forecasts (three to six months) tend to carry materially higher reliability than five-to-ten-year projections, as near-term input variables are better constrained. Multi-year forecasts depend on assumptions about revenue growth, discount rates, and competitive dynamics that can shift dramatically over time.
| Service | Model Type | Reliability Horizon | Key Input |
| WalletInvestor | Algorithmic / ML | 1–12 months | Historical price patterns |
| LongForecast | Trend extrapolation | 3–12 months | Moving averages, seasonality |
| Kursprognose | Statistical regression | 3–12 months | Price history, volatility bands |
| CoinPriceForecast | Fundamental-hybrid | 1–5 years (approx.) | Earnings estimates + price momentum |
Accuracy of Amazon Forecasts: Past Predictions vs Reality
A concrete illustration of forecast limitations: in 2022, most algorithmic models had projected AMZN would hold or rise from its late-2021 levels. Instead, the stock fell approximately 50% over the calendar year — driven by inflation, aggressive Federal Reserve rate hikes, and slowing post-pandemic e-commerce demand. These macroeconomic shocks fall outside the predictive range of models calibrated on pre-2020 data.
| Year | Consensus Forecast (start of year) | Actual Year-End Result | Variance |
| 2022 | $3,400 (pre-split equivalent) | $84 post-split ($1,680 pre-split equiv.) | -50% |
This does not invalidate forecasting as a discipline — it underscores the importance of treating any single model output as one data point among many, not a guaranteed outcome.
Amazon Business Fundamentals: AWS, Prime, AI, and Profit Margins
AMZN's stock price is driven not only by headline revenue growth but by the profitability mix across its business segments.
Amazon Web Services (AWS)
Despite representing a minority of Amazon's total revenue, AWS contributes over 60% of the company's total operating income. AWS operating margins exceed 25%, against retail margins of roughly 2–4%. Quarterly AWS results are the single most closely watched metric by equity analysts. When AWS revenue growth decelerated to approximately 20% year-on-year in Q4 2022, it contributed meaningfully to AMZN's 49% annual price decline that year. Conversely, AWS re-acceleration has been the primary driver of the stock's subsequent recovery.
Amazon Prime
Prime membership creates predictable recurring revenue that financial models value at a premium compared with one-time transactional revenue. The Prime ecosystem amplifies retail margin through increased purchase frequency and basket size. Amazon's annual Prime Day event is a documented stock catalyst. Between Amazon Prime's 2005 launch and the company's first Prime Day in 2015 — a full decade later — AMZN shares rose 225% in the first five years alone, and shares are up over 650% since.
Amazon Bedrock and Generative AI
Amazon Bedrock — Amazon's managed generative AI platform within AWS — positions the company in direct competition with Microsoft Azure OpenAI Services and Google Vertex AI. Since Bedrock's commercial launch, analyst price targets for AMZN have increasingly incorporated an AI-revenue premium, with several banks revising 2026–2030 targets upward on the basis of projected enterprise adoption.
Segment Margin Comparison
| Segment | Approx. Operating Margin | Impact on Stock |
| AWS | 25%+ | Primary earnings driver; beats/misses move the stock most |
| Advertising | 20%+ | Fast-growing high-margin segment; anchored by Fire TV ecosystem |
| Retail (NA + International) | 2–4% | Volume driver; low margin; stabilises revenue base |
How to Value Amazon Stock: P/E, P/S, and DCF Explained
Forward P/E. Amazon's trailing P/E has historically been distorted by volatile quarterly earnings, making the forward P/E more useful. Current forward P/E for AMZN is 31.7x. Historically Amazon has traded in a range of 30–80x forward earnings.
P/S (Price-to-Sales). During periods when Amazon's net income was near zero, the P/S ratio served as a more stable valuation anchor. Dividing the current market capitalisation by trailing twelve-month revenue (716,920,000,000 USD) gives a current P/S for comparison against the 2–4x range of Amazon's slower-growth years.
DCF (Discounted Cash Flow). A DCF model discounts Amazon's projected future free cash flows back to present value. The critical sensitivity is the discount rate: when U.S. Treasury yields rise – as in 2022 – the discount rate increases, reducing the present value of future profits and compressing growth stock multiples. In 2022, rapid rate hikes compressed AMZN's forward P/E from 60x to 30x, contributing directly to the 50% price decline.
Big Tech Peer Comparison:
| Company | Forward P/E (approx.) | Revenue Growth (TTM) |
| Amazon (AMZN) | 31.7x | 14.2% YoY |
| Microsoft (MSFT) | 30–35x | 15% YoY |
| Apple (AAPL) | 28–32x | 5% YoY |
Value investors applying a sub-30x forward P/E screen would currently exclude AMZN – it remains a growth investment requiring a multi-year horizon to justify its premium.
What Affects Amazon Stock Trading?
- Competition. The retail business is highly competitive. Other companies invest a lot in online sales channels in response to evolving consumer tastes. Right now, Amazon is one of the giants on the market, but the company has to work tirelessly to hold this position.
- Supply and demand. Amazon is quick to answer customer needs, creating new offers like Amazon Prime, Amazon Virtual Health, and Amazon Pharmacy. The 2002 launch of Amazon Web Services saw the share price rapidly grow from about $16 to $52.
- Economy. The state of the world's economy affects Amazon's share price forecast. For example, during the pandemic, people started to use e-commerce services more often, and Amazon's share price rocketed.
- Dollar rate. To buy an American stock, you need US dollars. That is why the performance of the US dollar in the international area is highly important.
- Management. Every year, Amazon organises a so-called Prime Day, a day of wild discounts. Between Amazon Prime's 2005 launch and the company's first Prime Day in 2015, AMZN shares rose 225% in the first five years. Since 2015, shares are up over 650%.
- Index membership and institutional flows. AMZN is a large-cap component of both the Nasdaq-100 and the S&P 500. Because passive index funds and ETFs automatically hold AMZN in proportion to its index weight, broad institutional rebalancing moves the stock even on news-free days. In Q1 2022, a 20% Nasdaq-wide sell-off pulled AMZN down faster than the index, reflecting its high-beta relationship with the broader tech sector.
- Interest rates and the bond market. Rising Treasury yields increase the discount rate used in DCF models, reducing the present value of Amazon's future cash flows and compressing its valuation multiple. Rate hikes in 2022 pushed AMZN's forward P/E from 60x to 30x, accounting for a large portion of that year's price fall. Conversely, rate cuts tend to expand growth stock multiples — a tailwind for AMZN in a lower-rate environment.
Wall Street Analyst Ratings and Market Sentiment for AMZN
The retail forecast services cited above use quantitative price models. Investment banks use fundamentals-based research with access to management and proprietary financial models. The two perspectives frequently diverge and are worth comparing.
Institutional analyst consensus for AMZN is broadly bullish — the majority of covering analysts maintain buy or outperform ratings, with an average 12-month price target reflecting a meaningful premium to the current price. This buy-dominant rating profile is consistent with the broader Big Tech sector: Microsoft and Alphabet carry similarly positive consensus ratings, reflecting institutional confidence in cloud and AI growth despite near-term macro headwinds.
Jefferies
Jefferies maintains active equity research coverage of Amazon. Their price targets are derived from proprietary DCF and sum-of-parts models that value AWS, retail, advertising, and logistics separately. Jefferies' analysts have historically been among the more precise in modelling AWS margin expansion as the primary AMZN re-rating catalyst.
Roth Capital Partners
Roth Capital Partners provides an additional data point for the analyst consensus range. Aggregating multiple bank price targets into a consensus range — rather than relying on any single forecast — is the standard institutional approach, as it averages out model-specific biases. Analysts at institutions such as Roth have fiduciary obligations that differentiate their research from purely algorithmic retail services.
S&P Global Ratings
S&P Global Ratings maintains an investment-grade credit rating for Amazon, signalling financial resilience and the capacity to service debt at low cost. Strong investment-grade status signals to equity investors that Amazon's balance sheet is unlikely to become a source of financial distress over the forecast horizon.
Key sentiment indicators to monitor alongside analyst ratings: the AMZN put/call ratio, short interest as a percentage of float, and institutional buying/selling flows from 13F filings.
How Has the Price of Amazon Stock Changed Over Time?
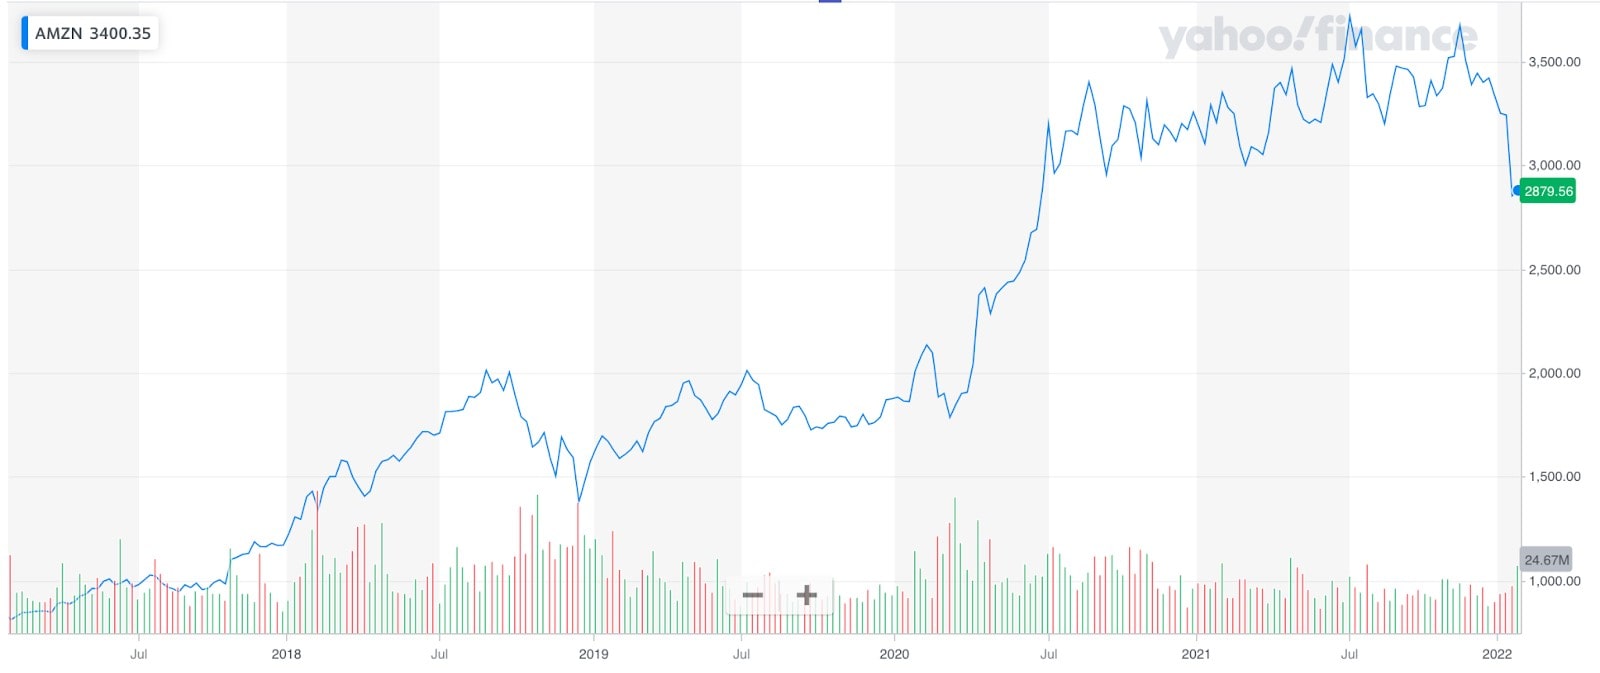
Let's look at the key milestones in AMZN's price history:
- IPO, March 1997, $18 per share. Amazon went public at $18. The first years brought neither notable success nor exceptional performance.
- Dot-com bubble, 1999–2001. The tech bubble pushed AMZN to a peak of approximately $107 (split-adjusted equivalent) before a catastrophic 94% drawdown to below $6. Amazon survived where many competitors did not, thanks to its diversified product offering. Investors who held through the collapse were ultimately rewarded as Amazon became one of the most value-creating stocks in history.
- Recovery and growth, 2004. By 2004, the share price had recovered to around $52 as the company's popularity and revenue base expanded materially.
- 2017 growth spike. Amazon reported 165% growth versus the prior three years, driven by AWS scale and Prime ecosystem expansion.
- China tensions, 2018. Deteriorating US-China trade relations drove AMZN below $1,500 briefly; the stock recovered to a record $2,050 by September 2018.
- Pandemic surge, 2020. E-commerce acceleration during COVID lockdowns drove AMZN to a peak of $3,499.12 in September 2020.
- 20-for-1 stock split, June 2022. Amazon executed a 20:1 stock split to improve accessibility for retail investors. All prices since June 2022 reflect the post-split scale (current price $244 vs pre-split equivalent $4,880).
- Jeff Bezos transition, 2021. Bezos announced his transition to Executive Chairman in February 2021, with Andy Jassy — the architect of AWS — becoming CEO in July 2021. The initial market reaction was cautious, but Jassy's deep AWS background ultimately reassured investors that Amazon's most profitable division would remain strategically prioritised.
- 2022 decline. Amazon's worst year on record: the stock fell 50%. The mechanism was two-fold: demand normalisation post-pandemic in retail, and Federal Reserve rate hikes that compressed AMZN's growth-stock valuation multiple from 60x to 30x forward earnings via the DCF discount rate channel.
- Recovery, February 2023. Amazon announced a 9% year-on-year revenue increase, exceeding Wall Street expectations by $4 billion and signalling a return to growth momentum.
What did Amazon's historical price look like?
In February 2019, Amazon's stock fell to $1,626.23 (pre-split equivalent) due to concerns about new Indian e-commerce regulations. Analysts lowered their price targets but remained confident about long-term revenue growth — confidence that proved justified as the stock resumed its upward trajectory through 2019.
2020 brought the COVID-19 pandemic — a shock that paradoxically accelerated Amazon's core e-commerce business as lockdowns redirected consumer spending online. Net retail sales surged, and Amazon shareholders benefited accordingly.
2022 then delivered the steepest decline in Amazon's post-IPO history outside the dot-com crash. Rampant inflation, aggressive rate hikes, and customers returning to physical retail combined to nearly halve the stock. Yet Amazon's February 2023 earnings announcement — +9% revenue, beating Wall Street by $4 billion — marked the inflexion point of the subsequent recovery.
Are Amazon Shares a Good Investment?
The short-term price forecasts reviewed above point to a choppy, broadly range-bound outlook through the end of 2026, with LongForecast projecting a net decline toward the 216 USD area by December. The long-term projections through 2030 from CoinPriceForecast imply a significantly wider return range. The following scenarios are calculated from the approximate current AMZN price and are provided as neutral reference points – not investment advice.
| Scenario | Source | Target Year | Implied Year-End Price | Potential Return, % |
| Base case (2026 year-end) | Kursprognose | 2026 | 222 USD | -6.7% |
| Optimistic (2030) | CoinPriceForecast | 2030 | 435 USD | 86 |
| Conservative (2030) | WalletInvestor | 2030 | 409.74 USD | – |
Investor type considerations. Long-term passive investors with a five-plus-year horizon and tolerance for volatility have historically been rewarded by holding AMZN through drawdowns. Active swing traders rely more heavily on the technical signals discussed above. Conservative income investors should note that Amazon does not pay a dividend – AMZN is a growth and capital appreciation vehicle, not an income stock.
Risk factors. AWS competitive pressure from Microsoft Azure and Google Cloud, regulatory scrutiny in the EU and US, macroeconomic slowdown reducing consumer spending, and further interest rate increases are the primary downside risks to the forecasts presented.
Any decision to invest in Amazon shares through Libertex's platform – which offers commission-free investments in real stocks as well as CFD trading with leverage of up to 30:1 for retail clients – should be based on independent research, personal financial circumstances, and risk tolerance, not on the basis of any single forecast or recommendation.
FAQ
What is the Amazon stock price prediction for 2026?
For 2026, LongForecast projects a closing price of approximately 269 USD in December and Kursprognose forecasts an average of 261 USD – implying a range of approximately 2.4%–5.5% from current levels depending on the model.
What will Amazon stock be worth in 2027?
For 2027, LongForecast anticipates a more aggressive rally to around 384 USD by December, while Kursprognose projects a steadier rise toward approximately 373 USD.
What will Amazon stock be worth in 2028?
For 2028, LongForecast projects continued appreciation toward approximately 385 USD by year-end, while Kursprognose estimates a range of 296–463 USD. These are model-based projections and carry significant uncertainty
What will Amazon stock be worth in 2030?
For 2030, CoinPriceForecast estimates a year-end price of approximately 466 USD (+83% from current levels). Long-range forecasts carry significant uncertainty and should be treated as directional scenarios rather than targets.
What is the analyst price target for AMZN?
Wall Street institutional analysts maintain a broadly bullish consensus on AMZN. Investment banks such as Jefferies and Roth Capital Partners publish proprietary price targets based on AWS valuation models and earnings forecasts. Consensus targets are updated following each quarterly earnings release.
Will Amazon stock go up or down in 2026?
The majority of forecast models reviewed here project modest to moderate upside for AMZN over the second half of 2026, though projections vary in magnitude. Technical analysis as of 24.09.2026 shows strong bullish signals: 8 of 11 oscillators (excluding ATR) indicate Buy, 2 Sell, and 1 Neutral, while 10 of 12 moving average signals point to Buy – together pointing to a broadly bullish short-term outlook. Whether the stock rises or falls will ultimately depend on AWS quarterly results, broader Nasdaq direction, and macroeconomic developments – particularly interest rate trajectory.
What factors affect Amazon's stock price the most?
The most influential factors are: (1) AWS quarterly revenue growth and margin – the primary earnings driver; (2) Federal Reserve interest rate decisions – which directly affect AMZN's growth-stock valuation multiple via DCF discount rates; (3) Nasdaq-wide sentiment – Amazon's high index weighting means it moves with broad tech sentiment; and (4) Prime Day and seasonal e-commerce catalysts.
Is Amazon stock a good long-term investment?
Amazon's long-term investment case rests on continued AWS margin expansion, Prime ecosystem stickiness, and AI/Bedrock revenue growth. The consensus long-term forecasts reviewed here are broadly positive. However, AMZN carries a significant valuation premium and does not pay a dividend. Whether it suits a given portfolio depends on individual investment horizon, risk tolerance, and existing holdings.
Disclaimer: The information in this article is not intended to be and does not constitute investment advice or any other form of advice or recommendation of any sort offered or endorsed by Libertex. Past performance does not guarantee future results.
Why trade with Libertex?
- Get access to a free demo account free of charge.
- Enjoy technical support from an operator 5 days a week, from 9 a.m. to 9 p.m. (Central European Standard Time).
- Use a multiplier of up to 1:30 (for retail clients).
- Operate on a platform for any device: Libertex and MetaTrader.