

Apple (AAPL) Stock Forecast 2026
Prepared by the Libertex team
Content reviewed internally in accordance with regulatory standards.
Not many publicly-traded companies manage to achieve the delicate balance between being a significant option for market participants and a favourite among the general public.
Apple Inc. has not only achieved this balance but very masterfully maintained it over the years, with the company's market capitalisation reaching $4,940,000,000,000.
While competitors have made massive investments in artificial intelligence, Apple has pursued a more measured strategy. This became especially clear after the announcement of the Chinese AI model DeepSeek, developed for just $5.6 million. While tech giants such as Nvidia, Microsoft, and Alphabet suffered significant stock market losses, Apple's (AAPL) share price rose by nearly 4%. Investors considering Apple shares or CFDs can access both through Libertex.
Discover what makes AAPL stock so popular, the factors that can drive its price up or down, and the analyst predictions for Apple stock in 2026 and beyond. You will also find technical analysis and the current readings of key indicators.
Key Takeaways
- Current Price: AAPL is currently trading at $336.13.
- 2026 Forecast: Kursprognose projects AAPL to trade between approximately $396 and $464 by December 2026, implying a 27.9% increase from current levels.
- 2027 Forecast: WalletInvestor anticipates continued movement in AAPL through 2027, with the price expected to reach approximately $424.76 by December.
- Long-Term 2030: According to CoinPriceForecast, AAPL could reach approximately $663 by year-end 2030, representing a 97.2% increase from today's price.
Recent Updates
- AAPL is currently trading at $336.13 USD (as of 2026-09-21), with roughly a 6% increase over the past 30 days. Market capitalisation: $4,940,000,000,000 USD.
- Analyst update: Evercore ISI raised its Apple price target to $380 from $365 on 18.09.2026.
- 2027 outlook: CoinPriceForecast projects continued growth, with projections reaching approximately $471 by end-2027 – an increase of around 40.1% from current levels.
- Long-term 2030: CoinPriceForecast projects AAPL to reach approximately $663 by year-end 2030, implying a 97.2% increase from today's price.
Apple (AAPL) Current Stock Price
Apple (AAPL) at a Glance
| Metric | Value |
| Current Price | 336.13 |
| Market Capitalisation | 4,940,000,000,000 |
| Volume (24h) | 86,200,000 |
| All-Time High | 344.57 (2.45 from ATH) |
| All-Time Low | 243.42 (38 from ATL) |
| Momentum | Neutral |
| RSI | 71.09 (Buy) |
| Vol/MCap Ratio | 0.59 |
| Revenue (TTM) | 466,820,000,000 |
| Net Income | 128,930,000,000 |
| EPS | 8.72 |
| P/E Ratio | 38.6 |
| ROE | 151.91 |
| Profit Margin | 27.62 |
| Shares Outstanding | 14,690,000,000 |
Source: Web3Forecast (21.09.2026)
Apple (AAPL) Stock Price Forecast for 2026 – Kursprognose
According to Kursprognose, Apple's stock price will show a notable upward movement in 2026. In September 2026, the price is expected to range between approximately $308 and $387.
The positive movement is projected to continue through Q4 2026, with the price potentially reaching $430 in December – a total gain of approximately 27.9% compared to current levels.
| Month | Low – High (USD) | Closing Price (USD) | Total, % |
| September 2026 | 308 – 387 | 358 | 12.9 |
| October 2026 | 316 – 424 | 393 | 24 |
| November 2026 | 371 – 435 | 403 | 27.1 |
| December 2026 | 396 – 464 | 430 | 35.6 |
Source: Kursprognose (21.09.2026)
Apple (AAPL) Stock Price Forecast for 2027 – Kursprognose
According to Kursprognose, Apple's stock will see significant appreciation in 2027. Early in the year, the price is expected to range between approximately $408 and $480, with a closing value of around $444.
By December 2027, the price is projected to range between $685 and $805, closing at approximately $745 – a total gain of roughly 73.3% from the start of the year.
| Month | Low – High (USD) | Closing Price (USD) | Total, % |
| January 2027 | 408 – 480 | 444 | 40.1 |
| February 2027 | 444 – 526 | 487 | 53.6 |
| March 2027 | 452 – 530 | 491 | 54.9 |
| April 2027 | 460 – 540 | 500 | 57.7 |
| May 2027 | 466 – 546 | 506 | 59.6 |
| June 2027 | 470 – 552 | 511 | 61.2 |
| July 2027 | 492 – 578 | 535 | 68.8 |
| August 2027 | 521 – 611 | 566 | 78.5 |
| September 2027 | 566 – 673 | 623 | 96.5 |
| October 2027 | 623 – 772 | 715 | 126 |
| November 2027 | 662 – 778 | 720 | 127 |
| December 2027 | 685 – 805 | 745 | 135 |
Source: Kursprognose (21.09.2026)
Apple (AAPL) Stock Price Forecast for 2027 – WalletInvestor
According to WalletInvestor's forecast for Apple stock in 2027, the price will continue to rise at a moderate pace. At the start of the year, the price is expected to trade between approximately $322 and $360.
Over the course of the year, the price is projected to reach approximately $424.76 by December.
| Month | Opening Price (USD) | Closing Price (USD) | Min Price (USD) | Max Price (USD) | Change |
| January 2027 | 339.17 | 325.05 | 322.36 | 359.67 | -4.81 |
| February 2027 | 332.72 | 334.54 | 330.07 | 340.18 | 2.92 |
| March 2027 | 342.43 | 360.96 | 327.86 | 367.74 | 7.9 |
| April 2027 | 360.42 | 354.35 | 354.33 | 389.71 | -1.83 |
| May 2027 | 362.79 | 354.05 | 337.78 | 372.99 | -0.08 |
| June 2027 | 346.42 | 329.14 | 301.9 | 347.46 | -7.04 |
| July 2027 | 322.04 | 350.57 | 311.24 | 350.57 | 6.51 |
| August 2027 | 352.6 | 360.9 | 345.48 | 361.44 | 2.95 |
| September 2027 | 369.49 | 390.06 | 356.42 | 399.76 | 8.08 |
| October 2027 | 380.81 | 375.44 | 370.65 | 389.85 | -3.75 |
| November 2027 | 383.52 | 416.08 | 377.84 | 417.52 | 10.82 |
| December 2027 | 419.40 | 424.76 | 419.40 | 436.37 | 2.09 |
Source: WalletInvestor (21.09.2026)
Apple (AAPL) Stock Price Forecast for 2028 – Kursprognose
Kursprognose projects Apple's stock to continue its trajectory in 2028. In early 2028, prices are expected to range between approximately $696 and $816.
By the end of the available 2028 forecast period, the stock is projected to close at approximately $705 – representing a change of roughly -5.4% compared to the year's opening price of $745.
| Month | Low – High (USD) | Closing Price (USD) | Total, % |
| January 2028 | 696 – 816 | 756 | 139 |
| February 2028 | 665 – 781 | 723 | 128 |
| March 2028 | 614 – 723 | 667 | 110 |
| April 2028 | 629 – 739 | 684 | 116 |
| May 2028 | 593 – 697 | 645 | 104 |
| June 2028 | 627 – 735 | 681 | 115 |
| July 2028 | 667 – 783 | 725 | 129 |
| August 2028 | 657 – 771 | 714 | 125 |
| September 2028 | 649 – 761 | 705 | 122 |
Source: Kursprognose (21.09.2026)
Apple (AAPL) Stock Price Forecast for 2028 – WalletInvestor
WalletInvestor's 2028 forecast for Apple projects a continuation of the moderate growth pattern seen in prior years, with prices expected to range between approximately $395 and $432 in early 2028.
The price is expected to reach approximately $475.63 by December 2028.
| Month | Opening Price (USD) | Closing Price (USD) | Min Price (USD) | Max Price (USD) | Change |
| January 2028 | 424.28 | 428.73 | 394.68 | 432.32 | 0.93 |
| February 2028 | 418.55 | 387.25 | 381.02 | 419.21 | -9.68 |
| March 2028 | 395.38 | 405.03 | 395.38 | 432.83 | 4.59 |
| April 2028 | 405.75 | 446.22 | 405.75 | 456.66 | 10.17 |
| May 2028 | 446.55 | 438.56 | 409.92 | 459.71 | -1.72 |
| June 2028 | 443.67 | 452.06 | 434.39 | 458.70 | 3.08 |
| July 2028 | 452.33 | 471.71 | 448.56 | 473.76 | 4.35 |
| August 2028 | 472.57 | 420.05 | 420.05 | 472.82 | -10.95 |
| September 2028 | 425.46 | 447.63 | 411.65 | 447.63 | 6.57 |
| October 2028 | 438.11 | 438.27 | 422.36 | 441.79 | -2.09 |
| November 2028 | 436.84 | 431.32 | 426.92 | 454.80 | -1.59 |
| December 2028 | 435.36 | 475.63 | 435.36 | 476.45 | 10.27 |
Source: WalletInvestor (21.09.2026)
Apple Stock Price Target 2026 to 2037 — CoinPriceForecast
According to CoinPriceForecast data, based on Apple's average annual stock growth over the past 10 years, the price is projected to reach approximately $403 by year-end 2026, representing a 20% increase.
In 2027, the price is expected to continue rising, with projections of approximately $444 at mid-year and $471 at year-end. For 2030, the positive trend is forecast to persist, with the year-end price potentially reaching $663 – a 97.2% increase from today.
| Year | Mid-Year (USD) | Year-End (USD) | Today / Year-End, % |
| 2026 | 289 | 403 | 20 |
| 2027 | 444 | 471 | 40 |
| 2028 | 478 | 481 | 43 |
| 2029 | 553 | 618 | 84 |
| 2030 | 626 | 663 | 97 |
| 2031 | 674 | 729 | 117 |
| 2032 | 739 | 768 | 128 |
| 2033 | 784 | 801 | 138 |
| 2034 | 818 | 836 | 149 |
| 2035 | 855 | 875 | 160 |
| 2036 | 896 | 918 | 173 |
| 2037 | 941 | 965 | 187 |
Source: CoinPriceForecast (21.09.2026)
Apple Stock Technical Analysis (21.09.2026)
The most reliable indicators for forecasting Apple's stock price performance come from technical analysis. The tables below reflect current readings and are provided for educational purposes only. They do not constitute trading signals or investment advice.
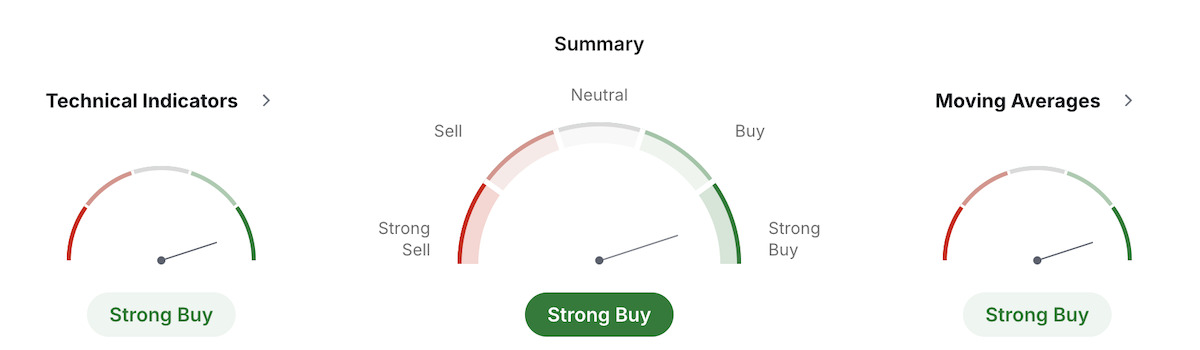
Technical analysis uses historical price and volume data to identify potential future trends, distinct from fundamental analysis, which focuses on earnings and revenue. The indicators below show AAPL's current positioning as of 21.09.2026.
Technical Indicators:
| Name | Value | Action |
| RSI(14) | 71.09 | Buy |
| STOCH(9,6) | 65.97 | Buy |
| STOCHRSI(14) | 98.06 | Overbought |
| MACD(12,26) | 29.9 | Buy |
| ADX(14) | 46.27 | Buy |
| Williams %R | -5.899 | Overbought |
| CCI(14) | 172.88 | Buy |
| ATR(14) | 31.39 | High Volatility |
| Highs/Lows(14) | 44.84 | Buy |
| Ultimate Oscillator | 63.06 | Buy |
| ROC | 61.94 | Buy |
| Bull/Bear Power(13) | 75.48 | Buy |
Source: Investing (21.09.2026)
Moving Average Values:
| Name | Simple Value | Simple Action | Exponential Value | Exponential Action |
| MA5 | 312.66 | Buy | 310.56 | Buy |
| MA10 | 288.4 | Buy | 291.99 | Buy |
| MA20 | 260.5 | Buy | 269.23 | Buy |
| MA50 | 215.73 | Buy | 222.79 | Buy |
| MA100 | 157.58 | Buy | 174.07 | Buy |
| MA200 | 90.5 | Buy | 119.02 | Buy |
Source: Investing (21.09.2026)
Pivot Points:
| Name | S3 | S2 | S1 | Pivot | R1 | R2 | R3 |
| Classic | 282.35 | 291.46 | 304.15 | 313.26 | 325.95 | 335.06 | 347.75 |
| Fibonacci | 291.46 | 299.79 | 304.93 | 313.26 | 321.59 | 326.73 | 335.06 |
| Camarilla | 310.86 | 312.85 | 314.85 | 313.26 | 318.85 | 320.85 | 322.85 |
| Woodie | 284.15 | 292.36 | 305.95 | 314.16 | 327.75 | 335.96 | 349.55 |
| DeMark's | - | - | 308.71 | 315.54 | 330.51 | - | - |
Source: Investing (21.09.2026)
Golden Cross and Death Cross Signals for AAPL. The golden cross — when the 50-day moving average crosses above the 200-day — is historically a bullish regime signal for AAPL. The inverse, a death cross, signals a potential bearish trend. Both are lagging indicators: they confirm a trend already in motion rather than predicting turning points, making them more useful for position management than precise entry timing. When a golden cross forms alongside a non-overbought RSI (below 65), the historical probability of sustained upside for AAPL has been higher. The 50-day and 200-day MAs are the most widely watched: AAPL trading above its 50-day EMA indicates a bullish medium-term trend; sustained trading below the 200-day SMA may signal entry into a bear trend.
According to Investing, the current technical readings for Apple indicate: Technical indicators are broadly bullish as of 2026-09-21: oscillator signals show 9 out of 11 Buy readings, with RSI at 71.1 and MACD confirming upward momentum. All six monitored moving averages (MA5 through MA200) issue Buy signals on both simple and exponential bases, yielding a strong buy consensus from moving average analysis. Please conduct independent research before making any investment or trading decision.
How Apple Stock Forecasting Methods Work and Their Reliability
The forecast services cited above use different methodologies. Understanding these differences helps interpret the divergence between projections.
Statistical regression models – used by Kursprognose – extend observed price trajectories using historical price ranges and volatility data. Algorithmic / ML models – used by WalletInvestor – feed historical price and volume patterns into automated systems to generate forward projections. Fundamental-hybrid models – used by CoinPriceForecast – combine earnings growth assumptions with price momentum inputs.
Short-term forecasts (3–6 months) carry materially higher reliability than 5–10 year projections. Multi-year forecasts depend on assumptions about iPhone cycle growth, Services margin expansion, and macro conditions that can shift dramatically.
| Service | Model Type | Reliability Horizon | Key Input |
| Kursprognose | Statistical regression | 3–12 months | Price history, volatility bands |
| WalletInvestor | Algorithmic / ML | 1–12 months | Historical price patterns |
| CoinPriceForecast | Fundamental-hybrid | 1–5 years (approx.) | Earnings estimates + price momentum |
Accuracy of Apple Forecasts: Past Predictions vs Reality
A concrete illustration: most models in early 2022 projected AAPL to hold or rise from $180. Instead, the stock fell 27% over the calendar year, as Federal Reserve rate hikes compressed Apple's growth-stock valuation multiple. This macroeconomic shock – rapid rate normalisation – fell outside the predictive range of models calibrated on prior years. The lesson: treat any single forecast as one data point among many, not a guaranteed outcome.
About Apple (AAPL) Stock
Apple Inc., formerly known as Apple Computer, Inc., is an American multinational technology company that manufactures personal computers, tablets, smartphones, and computer software. Headquartered in Cupertino, California, Apple was the first successful personal computer company and popularised the graphical user interface.
Apple is the largest information technology company by revenue. In August 2018, it became the most valuable publicly traded company in the world by crossing a market capitalisation of $1 trillion; in August 2020, it reached $2 trillion. Today, Apple's market capitalisation stands at $4.94 trillion.
Before trading or investing in AAPL CFDs or shares, it is important to understand the factors that can affect Apple's stock price. The following factors have influenced AAPL in the past and are likely to continue doing so.
What Affects Apple's (AAPL) Stock Price?
iPhone Sales
The iPhone has long been the largest revenue generator for Apple. Over the years, in many financial quarters, the revenue iPhone brought to the company was more than half the total revenue. Penetration in current and new markets, such as in China, could increase Apple's market share in the smartphone industry. At the same time, competition from an increasing market share of Android phones could hurt Apple's standing.
iPhone earnings dynamics are binary: when iPhone unit sales beat analyst consensus estimates, AAPL reliably rallies; when they miss, even minor shortfalls trigger disproportionate declines given iPhone's revenue weight. Apple's fiscal Q1 (October–December) is historically the strongest quarter annually due to new iPhone model launches and holiday purchases – this seasonal pattern is a well-documented AAPL trading catalyst. In emerging markets, India represents the next major iPhone growth opportunity as China faces macro headwinds, while China's large existing installed base is simultaneously Apple's largest single-country risk given geopolitical uncertainty.
Apple's near-$5 trillion market capitalisation limits explosive percentage returns compared to smaller-cap peers – a company of this scale cannot grow at startup rates. However, its free cash flow yield, dividend growth programme, and buyback activity offer a different value proposition for long-term holders.
iPad and Mac Sales
Sales of laptops, tablets and computers to individuals and corporations are another major contributor to Apple's revenue. In fiscal 2025, Mac net sales increased 12% to $33.7 billion and iPad net sales increased 5% to $28.0 billion Competition from rival brands and the resulting consumer response remain factors to consider.
New Products: Wearables, Vision Pro, and Future Catalysts
The release of new products – such as the HomePod, launched in February 2018, and the Apple Watch, launched in April 2015 – can also increase public interest in the company and lead to a surge in the Aapl future stock price. Apple's electric car project was cancelled in February 2024.
Apple Watch holds approximately 30%+ of the global smartwatch market, driven by an annual upgrade cycle centred on health features (ECG, blood oxygen detection, crash detection). Apple Watch success demonstrates a key capability that bullish analysts apply to Vision Pro: Apple can build dominant new product categories beyond iPhone.
AirPods are the most successful new hardware line Apple has launched in the post-iPhone era by market share in the premium wireless earbuds category. AirPods work best within the Apple ecosystem, meaning each unit sold both generates direct revenue and deepens iPhone and Mac retention.
HomePod serves as a premium smart home hub anchoring users within HomeKit and Apple Music services. While its market share is smaller than Amazon Echo and Google Nest, HomePod's strategic value lies in keeping premium users within the Apple ecosystem rather than generating standalone hardware revenue.
Apple Vision Pro as a long-term catalyst: the historical pattern from Apple Watch (dismissed as niche in 2015, multi-billion dollar segment by 2020) provides the bull-case template for Vision Pro. At a $3,499 entry price point, near-term adoption is limited – but the spatial computing platform being established now could support material revenue by 2027–2030 as price points decrease and developer content matures. Analysts modelling upside scenarios for AAPL in the 2026–2030 horizon increasingly incorporate Vision Pro adoption assumptions.
Market Sentiment
Although this is a tangible factor, it has a significant effect on the stock price of not just Apple but usually most other publicly-traded companies. Investors expect Apple to beat the estimates for their financial performance, and if the company is able to surpass the estimates by a large margin, it increases investor confidence in the company.
Apple Services Revenue: The Engine Behind AAPL's Premium Valuation
Apple's Services segment includes the App Store, Apple Music, iCloud, AppleCare+, Apple TV+, Apple Pay, Apple Arcade, and Apple Card. While Services represents approximately 20% of total revenue, it is the fastest-growing and highest-margin segment, making it disproportionately important to AAPL's stock valuation.
Margin differential. The gross margin from services is approximately 70%+ versus approximately 35% for hardware. This differential is the quantitative reason analysts assign a higher P/E multiple to Services revenue growth: one dollar of Services earnings is worth more to investors than one dollar of iPhone earnings. Growing Services penetration mechanically expands Apple's blended gross margin, supporting EPS growth independent of unit volume.
App Store. The largest and highest-profile Services revenue component, generating billions annually through a 15–30% commission on app purchases and subscriptions. The key bear-case risk for this revenue stream is antitrust regulatory pressure in the EU and US, where investigations could force Apple to reduce commission rates or allow alternative app distribution. This represents a meaningful downside scenario investors should weigh against the segment's attractive margin profile.
iCloud. The stickiest Services component by switching cost: users who store years of data and settings in iCloud face very high friction to leave the Apple ecosystem. This structural lock-in is why iCloud subscription revenue is considered more durable than hardware revenue by fundamental analysts.
Apple Pay and Apple Card represent Apple's fintech expansion, i.e., transaction fees and financial partnerships that deepen ecosystem lock-in. Users who depend on Apple Pay for daily transactions have an additional reason to remain within the Apple ecosystem beyond device attachment.
Apple Music, with 100+ million subscribers, illustrates the scale of Apple's subscription model. Recurring subscription revenue differs from one-time hardware sales in predictability and margin, explaining why growth in subscriber counts directly supports analyst EPS growth forecasts.
| Segment | Approx. Revenue Share | Approx. Gross Margin | Growth Trend |
| iPhone | 52% | 35% | Cyclical, launch-driven |
| Services | 20% | 70%+ | Faster than hardware; expanding |
| Mac | 10% | 35% | Steady |
| iPad | 8% | 35% | Steady |
| Wearables | 10% | 35% | Growing; led by Apple Watch/AirPods |
Apple Stock Price in the Past
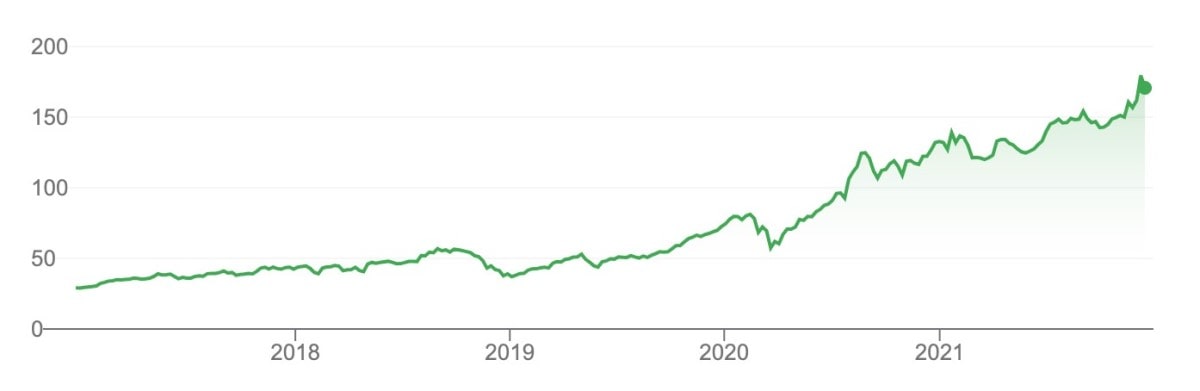
Let's have a look at the historical data of how Apple's shares have performed in the past:
- Over the past 5 years, the stock price of Apple has increased by 400%.
- Due to the coronavirus pandemic, the stock price fell to $56.56 from $81.73 in less than 30 days.
- Apple recovered gradually, and in September 2020, it was able to gain a value of $133.88, more than double the low of $56.56 in March 2020.
- AAPL vs the S&P 500 benchmark. Apple's 400% 5-year return materially outperformed the S&P 500 over the same period, generating significant positive alpha. Apple's large S&P 500 weighting means passive index funds must hold AAPL proportionally, creating structural price support beyond pure fundamental drivers. Active fund managers face career risk from meaningfully underweighting the index's largest component, which creates institutional demand floors independent of Apple-specific news.
- Market correlation and beta. Even with strong fundamentals, AAPL is not immune to broader market downturns. The COVID crash example — a 31% decline in under 30 days — illustrates Apple's positive beta to the broader equity market. In periods of broad-based selling (2022 rate-hike cycle, 2020 pandemic), AAPL declines with the index regardless of company-specific performance.
That said, historical performance does not reflect future results. For forward-looking expectations, let's consider what experts predict for AAPL.
Apple Stock Forecast by Analysts
Although it is essential to conduct your own research before making any trading decision, it helps to understand how industry experts and leading institutions view Apple's prospects.
TD Cowen raised its Apple price target to $350 (from $335) following the WWDC announcements in June 2026, citing continued AI feature integration and Services revenue growth as the primary catalysts.
Maxim also raised its Apple price target to $350 (from $310) in June 2026, reflecting a positive assessment of Apple's AI roadmap and the upgraded Siri voice assistant unveiled at WWDC.
In general, institutional analyst consensus for AAPL remains broadly bullish, with average 12-month price targets reflecting a premium to current prices. Most financial experts expect Apple's stock to continue rising, driven by strong brand recognition, a loyal and growing customer base, and ongoing innovation across hardware and services.
Apple stock forecasts for the longer term (beyond 2028) should be treated with additional caution – there are too many variables at play to quote specific values with high confidence. That said, these projections can still inform strategic thinking about long-term investment horizons.
Apple Dividend History, Free Cash Flow, and Shareholder Return Programme
Apple reinstated its dividend in 2012 and has grown it every year since – a signal of consistent financial discipline and management confidence in future cash flows. The current annual dividend yield is approximately 0.51%, which is below the S&P 500 average of 1.5–2%. However, this comparison is misleading without accounting for Apple's buyback yield: the total capital returned to shareholders (dividends plus buybacks) as a percentage of market cap is substantially higher than the headline dividend yield suggests.
Free cash flow engine. Apple generates approximately $80–100 billion+ in annual free cash flow (operating cash flow minus capital expenditure). This financial firepower funds both the dividend and one of the largest buyback programmes in corporate history. The buyback mechanism directly supports EPS growth: as Apple retires shares, each remaining share represents a larger portion of total earnings, mechanically growing EPS independent of revenue growth. This is a key insight that distinguishes Apple from pure-growth tech names paying no dividend.
Consistency through cycles. Apple maintained and grew its dividend even during the 2020 COVID year, evidencing the business model's resilience. This consistency differentiates AAPL from more cyclical technology names and broadens its appeal to income-oriented investors who would normally exclude pure-growth tech from dividend portfolios.
Long-Term Apple Stock Price Prediction 2026–2030
Apple stock forecasts for longer timeframes come with inherently wider uncertainty. Too many factors could influence the price at any given moment. That said, since AAPL is not a highly volatile stock relative to its market cap, long-term forecasts can still provide useful directional context for investment planning.
Vision Pro as a long-term catalyst. Apple Vision Pro's trajectory may mirror the Apple Watch launch template. In 2015, the Apple Watch was widely dismissed as a niche luxury product with limited mass-market appeal. By 2020, it had become the world's best-selling watch brand and a multi-billion-dollar revenue line. Applying this template to Vision Pro: near-term adoption is constrained by the $3,499 price point, and limited developer content, but the spatial computing platform being established now could support significant revenue contribution by 2027–2030 as successive product generations lower price points and expand use cases. Bullish analyst scenarios for the 2026–2030 forecast horizon increasingly include Vision Pro adoption as an upside variable.
Augmented reality. Apple's ambitions in the augmented reality sector represent additional long-term option value that conservative forecast models do not fully capture. These remain speculative catalysts, but the potential total addressable market is large enough to be material to analyst upside scenarios.
Wallet Investor, CoinPriceForecast, and other services have published forecasts projecting continued AAPL appreciation through 2026–2030, though estimates vary significantly by model. CoinPriceForecast data is presented in the table above for reference. All long-range forecasts are approximations: the further out they are, the wider the confidence interval.
Are Apple Shares a Good Investment?
The experts at CoinPriceForecast believe Apple shareholders can expect continued positive returns. However, when buying or selling stocks, the situation can change at any moment. Yesterday's positive price forecast may not reflect tomorrow's reality.
The following scenarios are calculated from the approximate current AAPL price and are provided as neutral reference points, not investment advice or a recommendation to buy or sell.
| Scenario | Source | Target Year | Implied Year-End Price (USD) | Potential Return from Current Price |
| Base case (2026 year-end) | Kursprognose | 2026 | 430 | 35.6% |
| Optimistic (2030) | CoinPriceForecast | 2030 | 663 | 97 |
| Moderate (2027) | WalletInvestor | 2027 | 190.21 | – |
Investor type considerations. Long-term passive investors (5+ year horizon, high risk tolerance) have historically been rewarded by holding AAPL through drawdowns. Active traders rely on the technical signals discussed above. Dividend-oriented investors should note that Apple's 0.51% yield is low on its own. The value proposition lies in the combined dividend-growth plus buyback return profile over time. Unlike Amazon or Meta, Apple pays and consistently grows a dividend, differentiating it from pure-growth tech names.
Key risks. App Store antitrust pressure (potential Commission reduction), iPhone revenue concentration (>50% of sales), China geopolitical risk, broader market rate-sensitivity (growth-stock valuation compression in rising rate environments), and competitive pressure in AI from Microsoft/Google/Meta.
You can open a Libertex demo account to practise trading AAPL CFDs in a risk-free environment before committing real capital. Libertex offers commission-free investments in real Apple shares (market spread apply) as well as CFD trading with leverage of up to 30:1 for retail clients.
FAQ
Is Apple a buy or sell?
The market is volatile. While Apple has established itself as a reliable company with strong fundamentals and consistent cash flow, shareholders should evaluate their own strategy and risk tolerance before making any investment decision. Technical analysis and analyst consensus as of 2026-09-21 indicate a broadly bullish / strong buy signal, with the majority of oscillators and all tracked moving averages aligned to the upside.
What is the Apple stock forecast for 2026?
For 2026, Kursprognose projects AAPL to reach approximately $430 by December, with a potential gain of 27.9% from current levels. WalletInvestor and CoinPriceForecast also project a broadly positive year, though forecasts vary in magnitude.
What will Apple stock be worth in 5 years?
Over a 5-year horizon (to approximately 2031), CoinPriceForecast projects AAPL to reach approximately $729, representing a potential gain of 116.9% from current levels. WalletInvestor's 5-year view is more moderate at approximately $524.13. These are model-based projections and carry significant uncertainty – treat as directional guidance only.
What will Apple stock be worth in 2030?
Most forecasts for 2030 project Apple to continue performing well. CoinPriceForecast estimates AAPL could reach approximately $663 by year-end 2030 – a potential gain of 97.2% from today. Estimates vary significantly across models, and long-range projections carry inherently wide uncertainty bands.
What is the analyst price target for AAPL?
Wall Street institutional consensus remains broadly bullish on AAPL. As of 2026-09-21, recent price target upgrades include TD Cowen and Maxim both raising their targets to $350. Analyst consensus targets are updated following each quarterly earnings release and represent the median view of analysts with fiduciary obligations – differentiating them from purely algorithmic retail forecast services.
Will Apple stock split soon?
As of 2026-09-21, there are no reports or confirmed indications of an imminent Apple stock split. Apple's most recent split was a 4-for-1 split in August 2020.
Is Apple a good long-term investment?
Estimates by most leading experts and investors conclude that Apple's stock price is likely to continue rising over the next several years, supported by Services margin expansion, iPhone ecosystem stickiness, and new product category growth (Apple Watch, AirPods, Vision Pro). Therefore Apple appears to be a candidate for long-term portfolios – but nothing is guaranteed, and investors should conduct independent due diligence.
Does Apple stock pay dividends?
Yes, Apple pays quarterly dividends. The annual dividend yield is approximately 0.51% ($0.25 per share). Apple has grown its dividend every year since reinstatement in 2012. However, the total shareholder return picture is more attractive than the yield alone suggests: Apple's buyback programme retires hundreds of billions of dollars in shares annually, mechanically growing EPS and returning capital beyond what the headline yield reflects.
Will Apple stock go up or down in 2026?
The majority of forecast models reviewed here project a broadly positive trajectory for AAPL in 2026, though the magnitude varies significantly. Key upside catalysts include AWS-equivalent Services margin expansion, Vision Pro adoption progress, and continued iPhone upgrade cycles. Key downside risks include App Store regulatory pressure, China macro headwinds, and interest rate sensitivity. Technical indicators as of 2026-09-21 show a strong buy signal, with all monitored moving averages and the majority of oscillators aligned bullishly.
Is Apple overvalued?
Considering that Apple's growth rates are not fully keeping pace with its market capitalisation expansion, some analysts consider the stock overvalued at current levels. The forward P/E of approximately 34.1x sits above the historical 30–40x range, suggesting a premium that requires sustained Services growth and new category success (Vision Pro, autonomous) to justify. Value investors applying sub-30x screens would currently exclude AAPL.
Disclaimer: The information in this article is not intended to be and does not constitute investment advice or any other form of advice or recommendation of any sort offered or endorsed by Libertex. Past performance does not guarantee future results.
Why trade with Libertex?
- Get access to a free demo account free of charge.
- Enjoy technical support from an operator 5 days a week, from 9 a.m. to 9 p.m. (Central European Standard Time).
- Use a multiplier of up to 1:30 (for retail clients).
- Operate on a platform for any device: Libertex and MetaTrader.