
Everything You Need to Know About the Aroon Indicator for Your Trading Strategy
Prepared by the Libertex team
Content reviewed internally in accordance with regulatory standards.
Prices in the market are not always the same. Both high and lowprices can be experienced in such unpredictable times. This is why it's best to have the right technical assistant tools to detect possible highs and lows in the trends. These tools might help traders decide when is the right time to buy and when is the right time to sell. One of the most important ones is the Aroon Indicator, which can be used to determine the direction and strength of a trend.
Learn more about Aroon Indicators and the strategies you can apply to use the tool properly with your investment.
Defining the Aroon Indicator
The Aroon Indicator was developed by Tushar Chande in 1995. Aroon is a Sanskrit word that means "Dawn's Early Light", indicating that the tool is capable of picking up on new trends. This is why Aroon is used to determine the start of a new market range.
Moreover, you can use the indicator to determine the trend in market prices.
How Aroon Indicator Works
To properly use and take advantage of the Aroon Indicator, you need to know how the AroonUp and AroonDown lines work and how they are used in the market. Upon interacting with the tool, you'll notice that the default time for the indicator is usually 25 days.
The indicator is composed of the Aroon Up line, which detects the overall strength in an uptrend. On the other hand, the Aroon Down line traces the strength of the downward trend.
The Up line indicates the number of days or periods you are away from a high in 25 days, while the Down line indicates how far you are from a low.
Generally, the indicator works to determine the beginning of an uptrend or downtrend and the changes you can encounter.
Setting Up Your Aroon Indicator
Here's how to set up your own Aroon Indicator:
- Look for a platform to set up technical indicators. Some allow you to use multiple emailaddresses to sign up.
- Search for the menu dedicated to indicators. Look for Aroon and add the indicator to the Active indicators.
- Specify the time interval to compute for the Aroon lines. If you're new to trading, you can set seconds period time intervals, but if you're a long-term trader with your own determination, you're more likely to set weekly period intervals.
- You can also change the colours of the Aroon Up and Aroon Down lines. The default colours are green and red, but you can alter them depending on your preference.
- Always monitor your trade or set your own particular security to avoid any hacking incidents.
Aroon Indicator Strategies
If you're searching for more advantages in your trading with this indicator, you can use the following Aroon Indicator strategies to determine breakouts and hop on to the trend the moment you see the potential opportunity:
Breakout Trading Strategy
Breakout strategy helps to detect when the price is above a resistance level or below a support level. You can use the Aroon Up and Aroon Down lines to gain insights: If the up and down lines are parallel, you will know that the prices are integrating. This means there are no changes made in a specifiedperiod.
When consolidations are detected, you can choose whether to wait for a breakout and ride with the direction of the breakout or be patient enough to have an Aroon crossover to be more confident with the direction of the trade.
Trend Strength Strategy
When you are ready to move on using the trend, one good strategy is to observe the Aroon lines. If the Aroon Up lines continue to go to a level of 100, know that the market action is quite strong. If this happens, you can expect two things when the trend is strong: a trend reversal or a pullback.
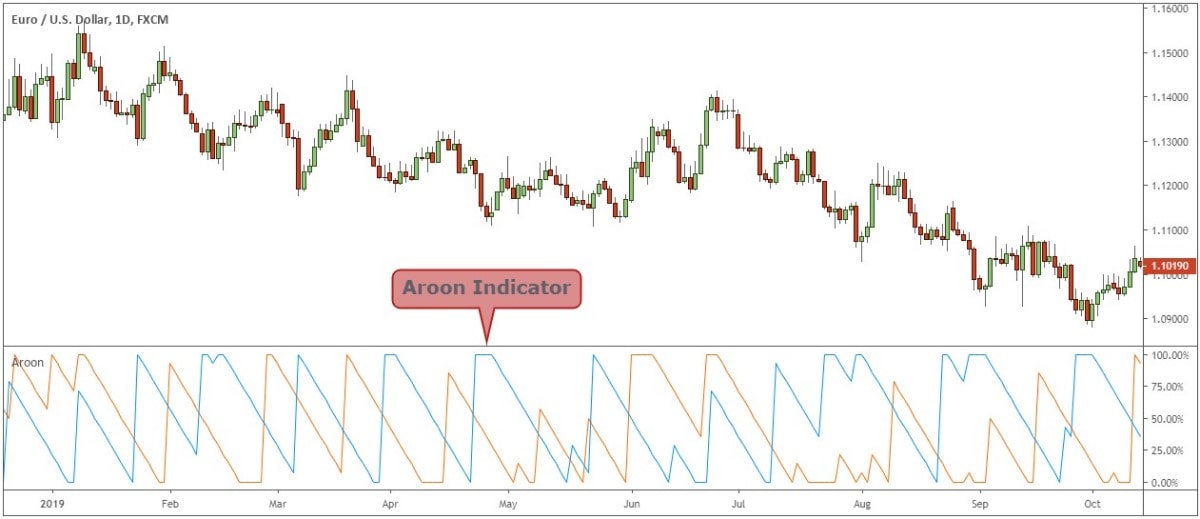
Charts
When you look at an Aroon chart, you can observe the following:
- Long positions when the green line or Aroon up line starts moving up from the zero lines and the red line or the Aroon Down line starts falling from the 100 mark.
- The positions are closed when the green line starts coming down from 100 in the Aroon chart. A strong downtrend is when the green line touches zero, and the red line touches 100 showing trend reversal.
- When the green line is above the red line, it is an uptrend. When the red line is above the green line, it is a downtrend. The lines must be in opposite directions to show a strong trend. Conversely, when the red line crosses a green line, it is the start of a downtrend. When the green line crosses a red line, it is the start of an uptrend.
- When the green and red lines are very close together in the Aroon chart, the trend is weak. If the green and red lines are not near each other, the trend is strong.
Aroon Indicator Formula
You can track the highs and lows using the Aroon Indicator Formula, with the results apparent in the percentage range. The closer the values calculated are to 100%, the stronger the trend. Here are the steps to calculate the Aroon up and down:
- Set up a period. Usually, the default time is 25 days. However, you can choose the default time or a shorter period of 14 days.
- You can use the formulas:
Aroon Up=(Period - No. of days since the period day high) * 100 /period
Aroon Down=(Period - No. of days since the period day high) * 100 /period
- Compute and interpret the results.
Suppose you chose the 25 days. You can determine the time when the price was highest and lowest within that time frame. Let's say that the price was at the highest three days ago.
Aroon Up = (25 - 3) * 100/25 = 88
The strength of the trend is 88%.
Aroon Indicator vs ADX
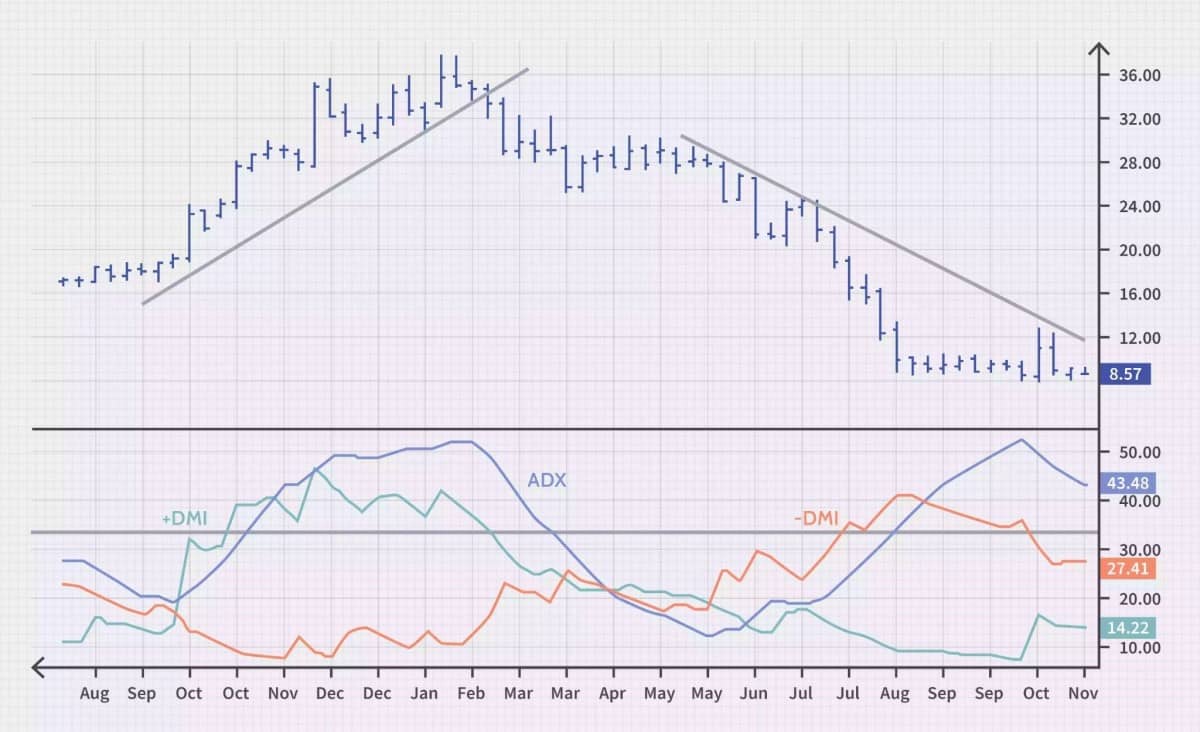
The Aroon Indicator and Average Directional Index (ADX)are used to determine the trend's strength. However, the two indicators have their differences:
- Aroon indicates the strength and direction of the trend, while ADX only indicates the strength of the trend.
- Aroon Up and Aroon Down use the periods in the parameter for calculating. ADX uses a complex formula involving Average True Range(ATR).
- ADX comprises three lines: ADX, plus directional indicator (DI+), and minus directional indicator (DI-). On the other hand, Aroon has two lines known as the Aroon Up and Aroon Down.
- ADX reacts much slower to changes in prices than Aroon Indicator.
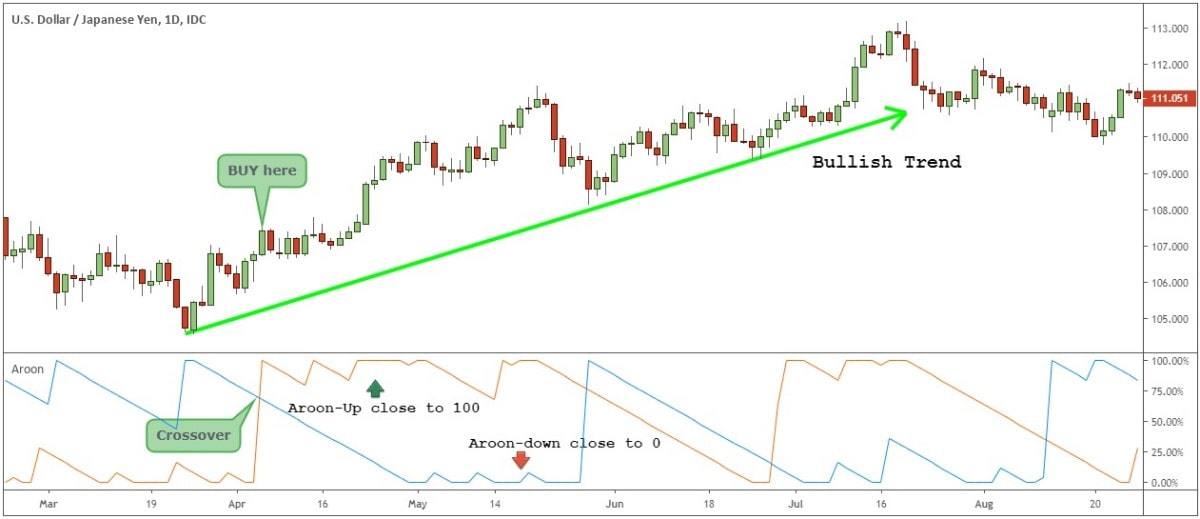
How to Trade With the Aroon Indicator
Aroon Indicator might be good signal for many traders because it lets the traders know when to buy and sell at a certain time while range trading, especially in regard to price trends.
A helpful trading strategy is to observe the Aroon Up and Aroon Down lines. You can watch for a crossover between the two lines to analyse the market, but you still need to double-check with other tools before deciding on making trades. The results of the Aroon Indicator are not guaranteed. So, it is better to check against your other technical analysis strategies to be more certain.
Which Indicator Works Best With Aroon?
The Aroon Indicator alone can't give the most accurate trend prediction in the market. With that said, using additional tools is advisable to help you with your predictions. One of these is the Aroon Oscillator.
The Aroon Oscillator functions within the parameters of -100 to 100. A high oscillator valueindicates an uptrend. Conversely, a low oscillator value calls for a new downtrend.
When the oscillator moves up, you can infer that the Aroon Up line crosses above the Aroon down. When the oscillator moves up, you will know that the price is at a new high. You don't have to evaluate the lines. Instead, you can easily view the oscillator.
That being said, when the oscillator moves down to zero, you know that the Aroon Down is crossing below the Aroon Up. A new low price occurs, dictating that there's a new low.
You can also use the Fibonacci Retracement to know where the previous prices started to fall. You'll see the significant ups and downs of the prices by retracing the past records. You can support your decisions when you use Aroon by the retracement.
Lastly, you can also pair your Aroon Indicator with Volume Oscillator to know the strength of any price movements. You'll be able to counter-check whether the Up and Down lines with Aroon are significant when you trade.
Advantages and Disadvantages
Advantages of the Aroon Indicator:
- The lines can be easily interpreted since there are only two lines used with different colours.
- The indicated changes in trends can be immediately noticed through line crossovers.
- The length of the period can be customised when you calculate for Aroon lines depending on your trading patterns.
Disadvantages:
- Delays in trend analysis since the indicators are looking backwards instead of predicting.
- The lack of concrete indicators on the period the changes in trends can occur.
- The fact that using Aroon Indicator without other tools means low accuracy.
Differences Between Aroon Indicator vs Aroon Oscillator
The Aroon Indicator and Oscillator can sometimes be confused and interchanged since Tushar Chande created them to both detect highs and lows in market prices. However, the Aroon Indicator was first created, and then the Aroon Oscillator followed with a much-improved system to detect strength in trends.
However, Aroon Indicator is used to determine the Aroon Up and Aroon Low to show the trend of the prices. On the other hand, Aroon Oscillator is used to confirm the estimate of the indicator. Also, Aroon Oscillator values range from -100 to 100, while Aroon Indicator is from 0 to 100.
Conclusion
Aroon Indicator is a good tool to know if there are new highs and lows in market prices to identify new trends, evaluate how strong the trend is, know the consolidations and breakout times, and anticipate any reversals. When you're equipped with the knowledge of using Aroon as a technical indicator, you'd have an added parameter when deciding when to buy and sell your shares.
A demo account with Libertex will allow you to get used to this indicator and even create your own settings. If you're a new trader, you'll gain the experience you need before diving into actual trading. Please note that trading CFDs with leverage can be risky and can lead to losing all of your invested capital.
Here are some of the most frequently asked questions about the Aroon indicator:
FAQ
What Is the Aroon Indicator?
The Aroon Indicator is a technical tool used by traders to predict a strong uptrend and downtrend. It is also used to identify new trends, evaluate how strong the trend is, know the consolidations and breakout times, and anticipate any reversals.
How Do You Use Aroon?
With the Aroon Up and Aroon Down line, you'll easily get to know how to use the Aroon Indicator. You can use the timeframe for settling on the up or down the line, or you can utilise the 25 days' default period. The indicator works to determine the beginning of an uptrend or downtrend, including the changes you can encounter.
The Aroon Up line detects the overall strength in an uptrend, while the Aroon Down line determines the strength of the downward trend. You will use the Up line to indicate the number of days or periods you are off from a high. Then, the Down line gives you cues on how far you are from a low.
How Do You Calculate Aroon Indicator?
You can track the highs and lows using the Aroon Indicator Formula. The result is expressed as a percent value. So the closer the values calculated are to 100%, the stronger the trend is. Here are the steps to calculate the Aroon up and down:
Set up the period you wish to use. Then you can use the formulas:
Aroon Up = (Period - No. of days since the period day high) * 100 / period
Aroon Down = (Period - No. of days since the period day high) * 100 / period
Compute and interpret the results.
What Are the Types of Indicators?
The four types of indicators are the following:
- Trend measures the direction and strength of a trend.
- Momentum determines how fast the price moves by comparing previous close prices to the current ones.
- Volatility measures how fast the price moves without considering the direction.
- Volume determines the strength of the trend depending on the volume of shares.
Disclaimer: The information in this article is not intended to be and does not constitute investment advice or any other form of advice or recommendation of any sort offered or endorsed by Libertex. Past performance does not guarantee future results.
Why trade with Libertex?
- Get access to a free demo account free of charge.
- Enjoy technical support from an operator 5 days a week, from 9 a.m. to 9 p.m. (Central European Standard Time).
- Use a multiplier of up to 1:30 (for retail clients).
- Operate on a platform for any device: Libertex and MetaTrader.