What Is the Average Stock Market Return?
Prepared by the Libertex team
Content reviewed internally in accordance with regulatory standards.
The average stock market return is one of the most important considerations for investors. It can help them create a financial plan, especially if they want to hold stocks over long periods of time.
If you aren't sure how to find average stock market returns or don't know how to analyse the figures, read on! We'll give you a look into average returns over various timeframes and show you how you can use that information when building your own portfolio!
All right, let's kick things off with a clear definition of average returns.
Average stock market return refers to how much the market increases or decreases in value from one period to the next.
These periods can be of any length of time — for instance, 10, 20, 30 or even 50 years. And the rates of returns can be expressed as a percentage or as a decimal. So, if you're reviewing charts of historical returns, -1.37% and -1.37 can be considered the same.
So, why is the average stock market rate of return important? Well, it helps individual investors predict how much they might earn on their investments over the long term. Although the rate of return isn't guaranteed, savvy investors analyse trends and make better-informed decisions about where to put their money. As such, it's a really useful factor to consider when diversifying your portfolio!
Let's take the S&P 500, for instance. This index experiences an average stock market return of around 10%. So, if you invest your money into stocks listed on the index, you may expect to see it grow by 10% on average over the long term. But!! It's more complicated than that.
You see, indices don't carry an equal amount of stocks from each sector. And, what's more, certain sectors perform vastly better than others. If a beginner investor blindly puts money in stocks expecting 10% returns, they could end up very disappointed. So, it's necessary to examine the average rate of return for each market sector, not just the index as a whole. We'll show you how to do this later on in the guide.
There's another important thing you need to know about the average rate of return: different indices experience different rates of return. For instance, some countries follow the S&P 500 for market insights, while other countries follow the FTSE 100 to get the average stock market return. In this article, we'll be pulling data from the FTSE 100. Just keep in mind that no matter which index you follow, you can not guarantee returns. Even if a company is included in an index, it may experience a poor year, causing investors to lose money.
There are no guarantees in the stock market. For example, in May 2022, the Dow Jones Industrial Average posted its biggest loss since 2020 - down 1,100 points. And in 2020, it plummeted by nearly 3,000 points.
What Is the Average Rate of Return in the Stock Market?
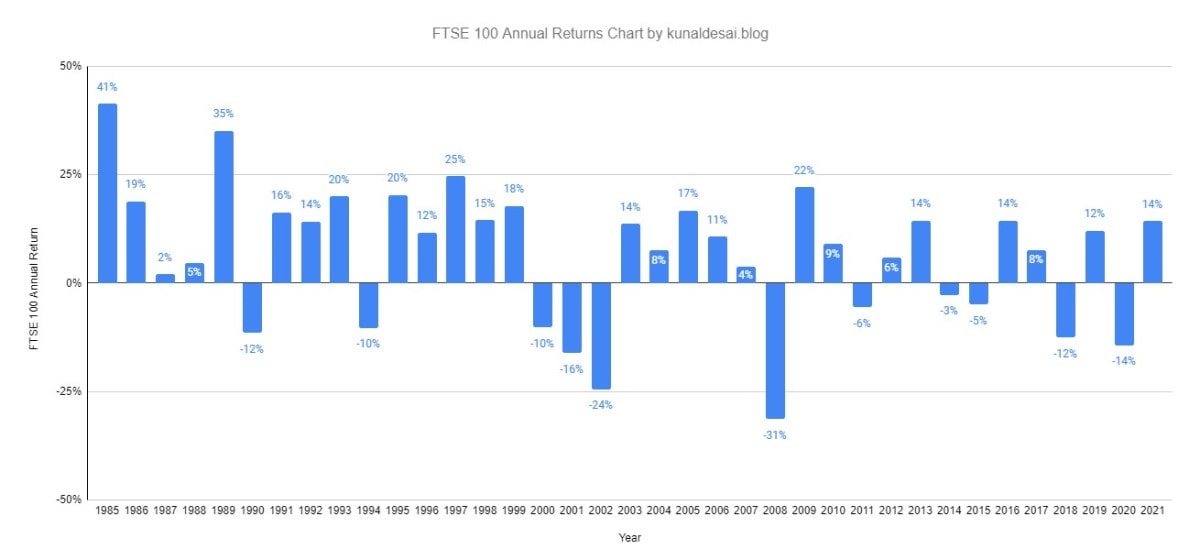
While you can find line charts of the average rate of return, we prefer bar charts, as they help visualise positive and negative rates of return much better. In the chart below, you can see the FTSE 100 annual returns from 1985 through 2021.
3- to 10-Year, 20-Year & 30-Year Results
We'll take a look at the average stock market return over various time periods, and, as mentioned above, the data will be pulled from the FTSE 100. This index comprises the 100 companies with the highest market capitalisation on the London Stock Exchange. When the index was launched in 1984, it replaced the price-weighted FT30 as investors' go-to performance benchmark.
Something to keep in mind: while the FTSE 100 is a commonly-used market indicator, it doesn’t give the greatest overview of economic conditions, as 100 companies is quite a limited number. If you want a more comprehensive economic overview, you can check out the FTSE All-Share Index, which comprises about 650 companies.
That being said, here are the average stock market returns for the FTSE 100:
|
Period |
Annualised Return |
|
3 Years (2019-2021) |
4% |
|
5 Years (2017-2021) |
1.6% |
|
10 Years (2012-2021) |
3.4% |
|
20 Years (2002-2021) |
2.9% |
|
30 Years (1992-2021) |
4.9% |
|
Since Inception (1984-2021) |
6.65% |
These are the current figures as of the time of writing (3 April 2022), but what if you find this article after a year or two? Well, it's fairly simple to calculate the annualised return percentage. Simply add the returns for each year in the period and divide it by the number of years. So, if the rates were 10%, -2%, and 5% in the last 3 years, the average rate of return for the 3-year period would be 4.33%.
Generally, the longer the time period, the less volatile annualised returns will be. There are more chances for positive and negative outliers to balance each other out. For instance, if you entered the market in 2000 and only stayed for three years, you would have experienced an average return of -16%.
But if you had held on for another 3 years, that would have balanced the market back out to exactly 0% returns. It may not be an exciting prospect to be back where you started, but it's certainly better than losing money.
Of course, this isn't to say that you definitely would have experienced the same returns as the overall index: remember, the performance of the index as a whole isn't indicative of individual stocks' returns.
Another thing to note: if you find yourself upset about the average rate of return for this index, you aren't forced to stick with it. You can choose to use the S&P 500 as your benchmark. After all, the FTSE 100 only has, as its name implies, 100 companies, so one company's demise has a bigger impact on the overall average return.
For reference, the S&P 500 has experienced an average return of 10.5% over the last 50 years, 10.72% over the last 30 years, and 57.08% over the last 3 years. Yet, even with that positive figure, there have been tumultuous years. The largest drawdown was -31.3% in 2008. This illustrates the volatility of the market; invest could lose their money at any time, and nothing is guaranteed.
3-Year Return: 4%
Turning our eyes back to the FTSE 100, let's examine the reasons behind its annual return performance. The index would have had much better performance over the last 3 years if not for dismal returns in 2020. Brexit uncertainty and COVID-19 wreaked havoc upon the blue-chip companies listed on the index, leading to its largest decline since 2008. Things went much better the next year, though, with 2021 bringing 14% in returns. But just as investors lost money in 2008, you could lose money today.
10-Year Return: 3.4%
By 2012, the market had mostly recovered from the financial crisis of 2008, which we'll address next. When reviewing the average rate of return in the stock market for the last 10 years, you may note a global stock market selloff from 2015 to 2016. It led to a decline in stock prices across the board, although it didn't cause the price to drop into negative territory. However, there was a dive in 2018 that did cause a year of negative returns: the dive was due to the US-China Trade War, scandals with big tech companies, and Iran sanctions. If such a situation were to happen again, traders would almost certainly lose money.
20-Year Return: 2.9%
In this timeframe, the world experienced two huge market crashes: one in 2002 and the other in 2008. Between the two points in time, there were five years of positive growth, with returns growing as high as 17% in 2005. In the infamous crisis of 2008, returns plummeted to -31%.
This is why holding investments for a really long time period can be beneficial for investors. If you only hold it for five years and such a crisis happens, it is much less likely that your losses will be recouped. On the contrary, huge losses could be incurred.
30-Year Return
Looking back 30 years, there is a much happier history for the FTSE 100 and the global markets. Between 1992 and 2000, there was only one year of negative returns, in 1994. That year, the Great Bond Massacre occurred. There was a sharp selloff of bonds, with bondholders suffering over $1 trillion in losses. So, again, this goes to show that you should be careful when trading — or you could become one such person suffering losses.
What Is the Rule of Thumb About Average Stock Market Returns?
As we mentioned above, it depends on which index you're using as a benchmark. With the S&P 500, there is a 10% rule of thumb, but that isn't the case if you've chosen the FTSE 100 as your benchmark. Since its inception, the FTSE 100 has experienced a 6.65% average rate of return, so you can consider that to be its rule of thumb.
Remember: this rule of thumb doesn't apply to individual companies or to single-year timeframes. It's just indicative of the index's overall health in the long run.
What Makes the Strongest Impact on the Stock Market?
There are countless factors that impact the stock market. There are a lot of things that can cause a fall in the average stock market return, including dividends, political and economic conditions, global events and earnings reports. And subsequently, the market's average return will fluctuate.
Other factors that can affect the stock market include interest rates, inflation and the strength of the economy. And when you have many negative factors combined (high inflation, poor economic strength and geopolitical conflicts), you end up with worldwide market crashes like the one experienced in 2008.
Read on, and we'll give you a deeper look at some events that have affected the stock market drastically, for better and for worse.
Dot-Com Bubble
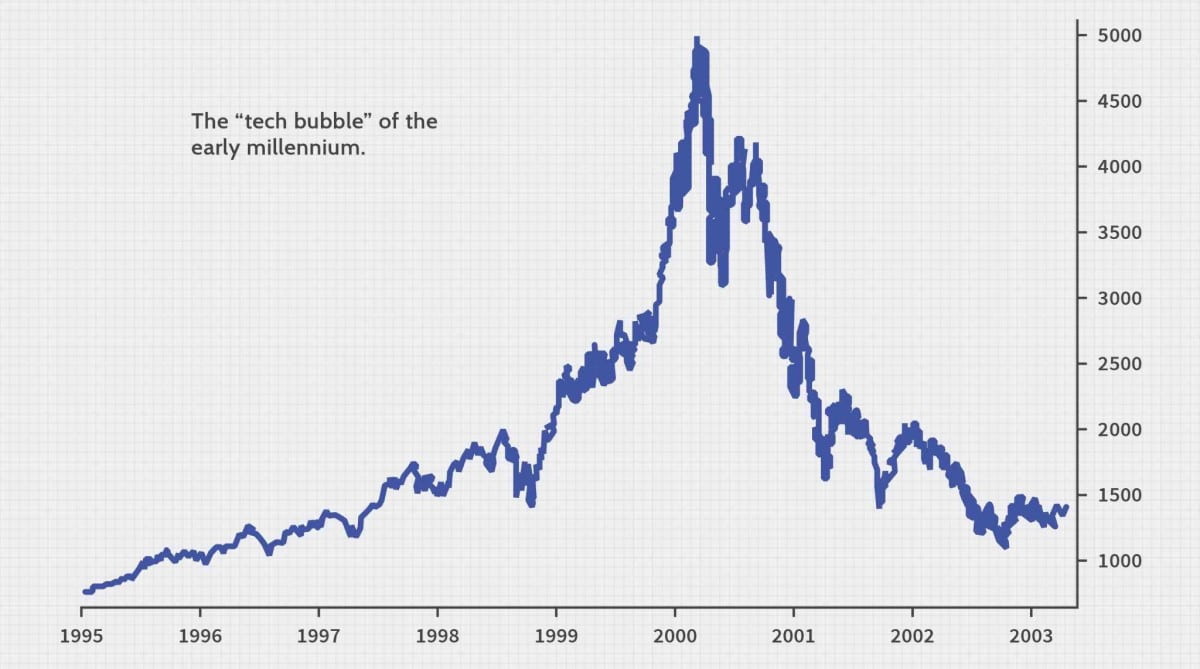
Even if you've never invested before, you've likely heard of the dot-com bubble. In the mid- to late-1990s, there was a historic economic bubble, which is when internet-based companies experienced excessive speculation from hopeful investors.
1995 to 1997 is considered the 'pre-bubble', which is when web companies started to build hype. Things picked up from there, with prices building to a frenzy up until their peak in March 2020. After the peak, the prices of dot-com companies declined by 78%, reaching a low point in October 2022.
The internet is heavily ingrained in our daily lives, so why did such a crash occur? Well, this phenomenon is referred to as "irrational exuberance", a term that was coined during the bubble, actually! Essentially, it's when the market is driven by psychological factors rather than fundamental valuation. It leads to unearned optimism about a sector's growth potential, resulting in stock prices that don't align with actual earnings.
Many dot-com businesses were funded by venture capitalists who expected a quick turnaround after said businesses went public. However, this overabundance of funding led to companies going public without a viable business plan or a product-market fit. After the bubble burst, hundreds of businesses failed.
Financial Crisis of 2008
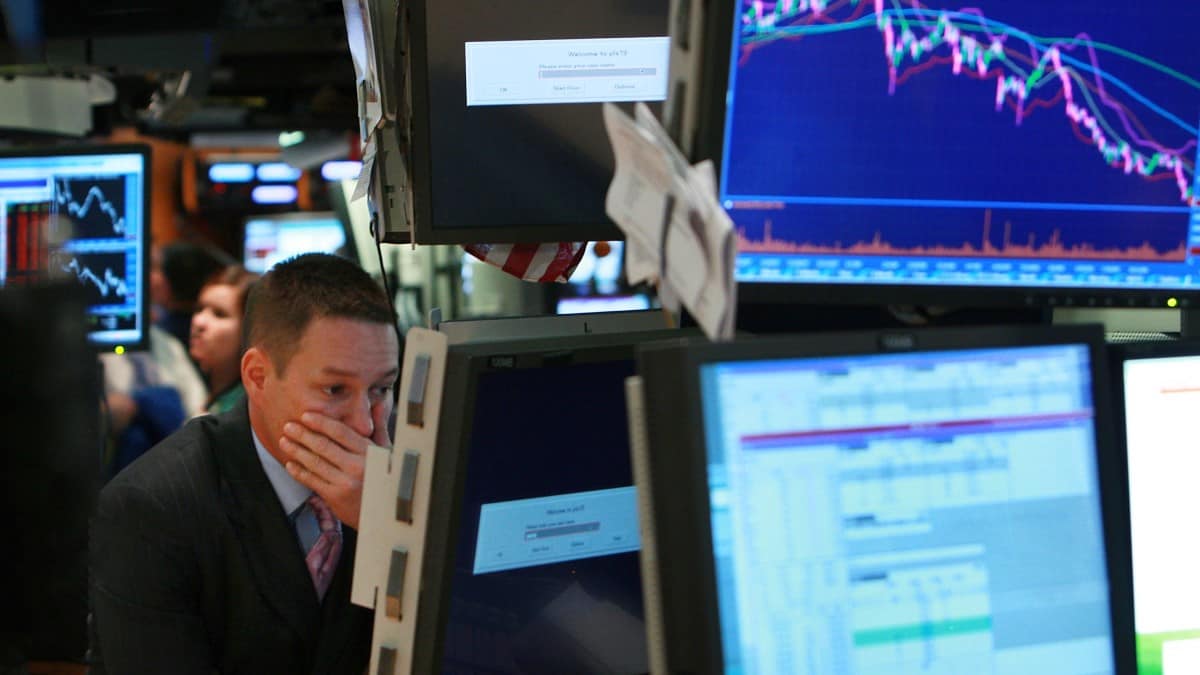
The financial crisis of 2008 was a global financial crisis that began in the United States, sparked by a bust in the nation's housing market. This crisis is also referred to as the "Great Recession" and is the worst global economic crisis since the Great Depression.
Besides the housing market bust, the 2008 crisis was caused by:
- Easy credit conditions, leading to high levels of consumer debt
- Deregulation of the banking industry
- Securitisation (packaging mortgage debt into financial instruments akin to bonds)
Market Recovery
Thankfully, there are periods of market recovery in between events like the ones mentioned above. This is what keeps investing interesting. Otherwise, there would be no point in buying shares.
A stock market recovery is a point at which the stock market rebounds from a significant downturn. This can be a gradual process, or it can happen quickly. The rebound might not be uniform across all stocks, and it doesn't last forever. Economic crashes will always be a part of the financial world. But during these periods, the market can move beyond recovery and into prosperity, experiencing incredible returns. For instance, in 2009, the average rate of return in the FTSE 100 rose from -31% to 22%. That's a gain of 53% in total!
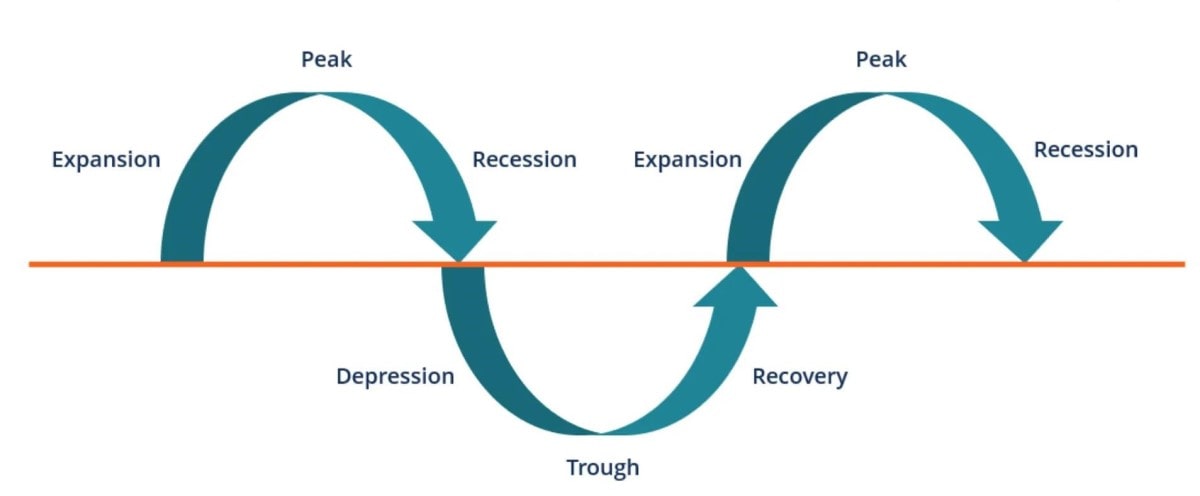
That's the general pattern investors experience: good growth, a buildup to a climax, a crash, a heavy rebound, balanced growth once more, another buildup, then another crash. It's the market cycle. These phases of growth and decline are called expansions and contractions, respectively.
How to Use the Average Stock Market Return
Now that you know about average stock market returns and the pattern of the market cycle, how do you apply it? It depends on what kind of investor you are: the level of risk you're comfortable with, your time horizon, your sector allotment, and so on.
We aren't going to recommend any strategy in particular. Instead, we'll introduce you to some popular schemes, so you can choose ones to research further.
Different Market Sectors Have Different Returns
Savvy investors know that market sectors have different returns, regardless of the average rate of return of an index. Perhaps one year, energy and tech companies have excellent returns, while the real estate sector plummets.
You can't just look at an index's overall performance and assume each sector will align with it. We wish it was that easy, but you have to put in much more work: mainly by researching the individual sectors and allocating your capital to the ones that are the most promising.
Some investors simply choose an index and follow its allocation: for instance, the largest sector within the S&P 500 index is Information Technology, at 28.1%. In FTSE 100, on the other hand, the heaviest weighted sector is Consumer Staples at 17.91%, barely edging out Financials (17.82). In fact, Information Technology only has a weight of 1.41% in this index!
Of course, you don't have to blindly follow an index. You can consider economic strength and allocate your funds to sectors that do well in times of growth and recession. For example, consumer discretionary companies thrive when the economy is up, whereas utilities and healthcare tend to do better when the economy is down.
Market Timing Affects Your Potential Return
This is where the market cycle comes into play. Short-term investors often attempt to time the market — in other words, to predict the upcoming price movements. The goal of this strategy is to buy assets when their prices are low and sell them as high as possible. It's tricky to time it just right, though, and you have to protect yourself from psychological factors like greed. Crashes can happen practically overnight. So, if you hold off on selling for too long in hopes of even better payouts, you might lose your chance and have to wait for the next market cycle or sell at a loss.
Attempting to predict future movements is a risky proposition. However, there are plenty of trading indicators and tools to help you back up your predictions with data. For instance, on the Libertex platform, traders can use all sorts of charts and timeframes. They can even use demo accounts to hone their skills at market timing.
How Does Inflation Affect the Rate of Potential Return?
Inflation affects the rate of return of the stock market in two ways. First, consumers' money has less purchasing power. And second, the costs of goods and services increase. During periods of inflation, valuestocks tend to perform better. These are the stocks of companies that trade lower in comparison to their earnings and growth potential. However, stock prices as a whole are much more volatile. What's more, growth stocks don't do well during times of high inflation. These are stocks of companies that are expected to grow at a higher rate than the market average.
Equipped with this knowledge, some investors incorporate inflation into their strategy, choosing to allocate more funds to growth stocks during times of low inflation.
Other Investing Considerations
Before investing in the stock market, read up on taxes, fees, and risks. We'll give you an introduction to all three subjects, along with resources that you can learn more from.
Taxes
Different countries impose their own tax rules for trading gains. Your country might charge a higher tax rate if you hold your positions for a short amount of time. Make sure to carefully research your country’s regulations on capital gains.
Fees
When you purchase stock, you aren't just paying the share price. You also have to consider the associated fees. These include trading fees, broker fees, commissions, expense ratios and more. Fees can also increase depending on the level of management you receive: for instance, passive mutual funds come at a much lower fee than actively managed ones. For a full breakdown of fees, check out this guide from Investopedia.
Risks
Lastly, it's important to know that there is always risk involved when it comes to the stock market. No matter how carefully you study technical indicators and analyse sector performance, there's a chance of market mistiming, an economic crash, or a number of other things that may not be in your control. You could even end up losing the entire capital of your investment. So, before you begin investing, determine the level of risk you are comfortable with.
Disclaimer: The information in this article is not intended to be and does not constitute investment advice or any other form of advice or recommendation of any sort offered or endorsed by Libertex. Past performance does not guarantee future results.
Why trade with Libertex?
- Get access to a free demo account free of charge.
- Enjoy technical support from an operator 5 days a week, from 9 a.m. to 9 p.m. (Central European Standard Time).
- Use a multiplier of up to 1:30 (for retail clients).
- Operate on a platform for any device: Libertex and MetaTrader.