What Is a Forex Momentum Indicator?
Prepared by the Libertex team
Content reviewed internally in accordance with regulatory standards.
One of the most critical aspects of the market for traders is price movement. For this exact purpose, there are many technical indicators used in the forex market. The one we'll be discussing today, the momentum indicator, helps determine the price fluctuation in the market and identify trends and their strength.
For a better understanding of how to utilise the indicator, this article will tackle how it works and how it's used in forex trading.
Momentum Indicator: How It Works
To analyse a market on a technical level, a trader has to understand the prevailing trend: if it's present or not, if it's just starting or if it's already ending. In doing so, a trader also has to know and judge how strong the trend is. This is where momentum indicators are used.
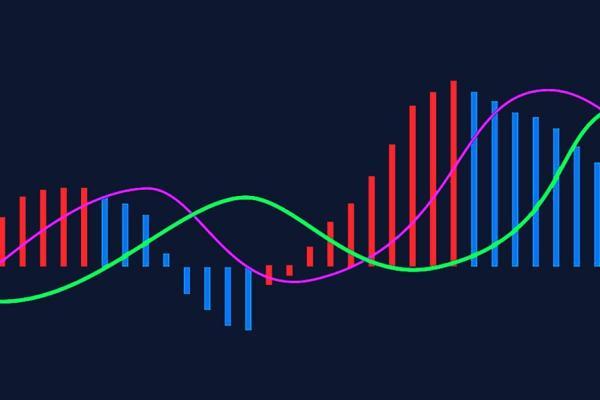
The momentum indicator is a kind of forex technical indicator known as an oscillator, which is used to identify the speed and strength of a price movement and trends in the market.
The momentum indicator can be used as a tool to identify and measure the momentum of a specific currency pair. It compares the existing and current prices to previous prices within a certain period and measures the velocity of these changes. Traders also use it in determining overbought and oversold conditions in the market.
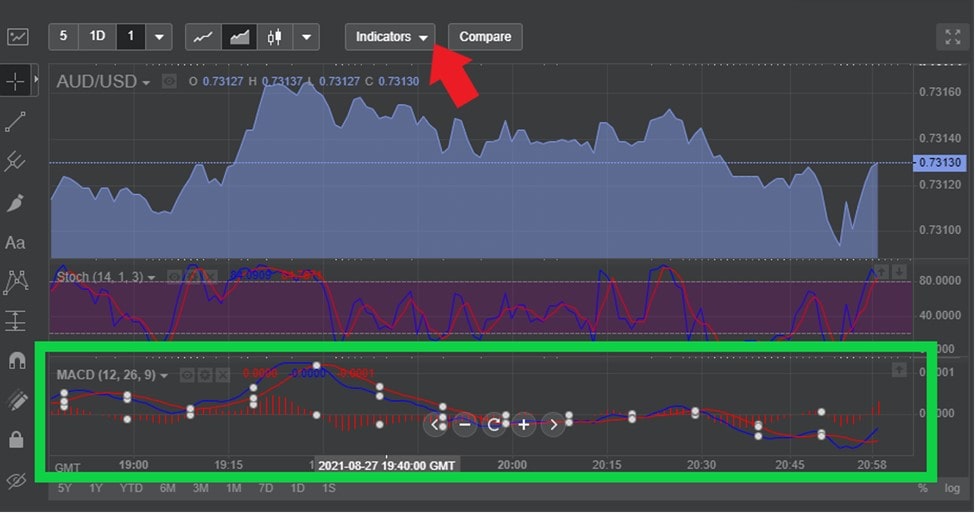
Traders use popular forex momentum indicators like the Moving Average Convergence Divergence (MACD), Relative Strength Index (RSI) and Stochastic Oscillator. A single line usually represents the momentum indicator in a particular section of the chart.
How to Calculate Momentum Indicator
Since it's plotted as a single line on the chart, you must calculate the difference between the previous and current prices. There are various trading tools and software you can use to automatically calculate the momentum. But it's still best if you know how the calculation works.
A price's momentum is easy to determine since there are many versions of its formula you can use. However, the principle remains the same: you compare the current price and the previous price in a specific timeframe.
Let's go over the parameters and variables:
Let CP1 denote the current closing price, while the previous closing price from n periods ago is CPx. With this, the momentum indicator formula goes like this:
Momentum = (CP1/CPx)*100
Thus, you can determine whether the current price is better than the previous one and how fast the price is moving.
Based on this formula, we can observe the following:
- Since the value you get will be in percentage, we'll identify it based on percentage.
- If the obtained percentage is above 100, the current price is higher or more significant than its previous price. But when it's lower, it's the exact opposite: the current price is lower.
- The distance of the obtained percentage from 100 shows how fast the price movement is. For example, if you get 133%, you can say that it's moving up and increasing faster than a momentum with 130%.
Advantages and Disadvantages of a ForexMomentum Indicator
A momentum indicator has its benefits and drawbacks.
Advantages:
- It's easy to distinguish. Since momentum indicators are plotted as lines, you can easily interpret them without any complicated mathematical calculations. A momentum indicator shows the price movement and its strength no matter what direction it moves in.
- It has a flexible calculation. As shown in the previous section, you can quickly determine the momentum even when changing the price's past performance period.
- It can be used with other technical indicators. You can combine it with other indicators, especially those that show the price movement's direction.
- It's an efficient signal. It signals a change in trend, whether there's an increase or loss in the momentum.
- It can identify reversal points in the market. With a momentum indicator, a trader can spot where the market can reverse. This is done by observing the divergence of the price movement and momentum.
Disadvantages:
- It should be used with other indicators. Although this may seem like a pure advantage, it can also be a drawback because it means that the momentum indicator can't provide accurate signals or data all the time. It requires working with other indicators to do so.
- It's significantly influenced by time. Even if it deals with the movement of prices, the momentum indicator is more affected by time. It depends only on the periods where high and low instances are observed. It doesn't say anything about the magnitude of the change that can happen.
- It only shows several pieces of data. There isn't much information you can get by looking at this indicator on the chart, especially if the price is moving aggressively.
- It's a lagging indicator. Since you'll use past prices, there can be a delay before observing the chart's momentum indicator compared to other indicators.
A Guide to Using Momentum Indicator in Trading
Although it may seem complicated, using the indicator is quite simple and easy. You can follow the steps below to use it in trading.
Step 1 - Open Your Trading Account
Create a trading account and log in to the platform.
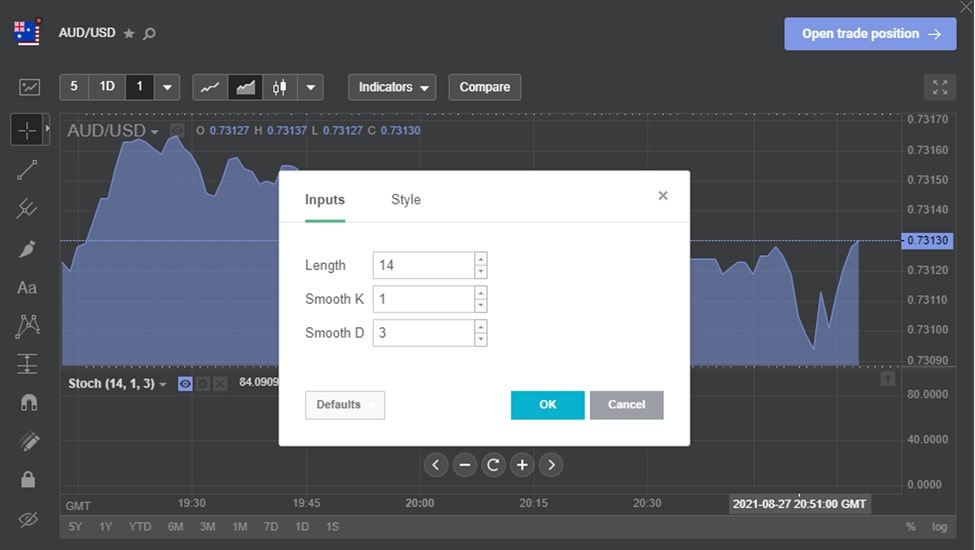
Step 2 - Display the Momentum Indicator
Use the available chart analysis settings and choose the momentum indicator. For most platforms, you can customise the indicator's colour and width.
Step 3 - Indicate Your Momentum Setting
Choosing the right momentum setting is essential. Select what timeframe you want and focus on a specific period. A separate window or an additional chart extension will display the momentum just beneath the price chart.
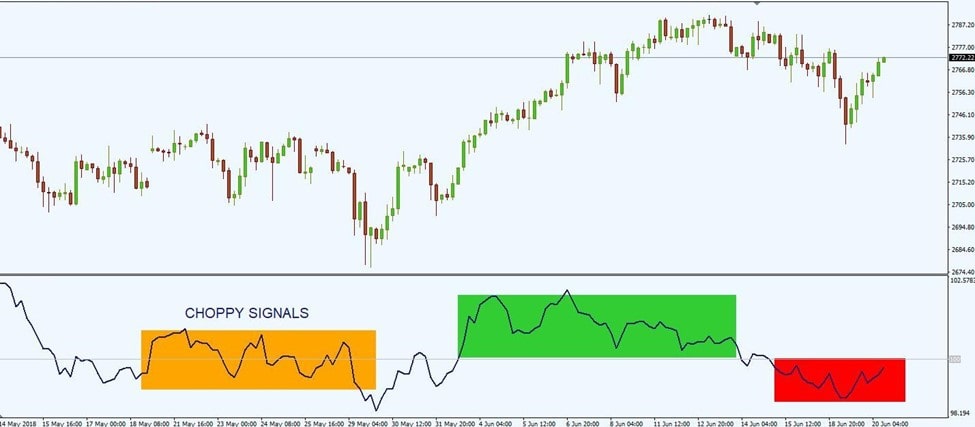
The most commonly used settings are 7, 14, and 21. Settings over the value of 21 are less sensitive, thus creating less noise and a smoother line on the chart. Values less than 10, however, are too sensitive and result in more market noise.
Step 4 - Observe and Read the Momentum Indicator
Look out for trend conditions on the chart. Here are some indications from the movement of momentum.
If momentum is above 0, and the price is increasing:
- The uptrend is accelerating.
- There's a strong upward trend that's likely to continue.
If momentum is above 0, and the price is decreasing:
- The trend is losing upward momentum and is a warning that the momentum is getting weaker.
- However, this doesn't mean that there will be a reversal.
If momentum is below 0, and the price is decreasing:
- The downtrend is accelerating.
- It's a strong trend that's likely to continue.
If momentum is below 0, and the price is increasing:
- The trend is losing downward momentum and is a warning that the momentum is getting weaker.
- However, this still doesn't mean that there will be a change in trend.
Step 5 - Pay Attention to Signals
You can take signals when the momentum crosses 0. When it crosses 0 upward, the indicator generates a buy signal, but when it crosses 0 downward, the momentum indicator generates a sell signal.
Step 6 - Use Supporting Technical Indicators
Since there are instances that not all generated signals are reliable all the time, it's best to use two indicators to generate more accurate signals.
Step 7 - Open Your Positions
After assessing the overall price movement, you can open either two types of positions: short or long. Let's say your momentum settings for the two indicators are 20 and 7.
You can open a long position when you confirm an uptrend with the momentum. You can do so by observing the movement of the two momentum indicators. If the momentum of 20 moves 0 upward, wait for the other momentum to cross 0 and continue to rise.
You can open a short position, on the other hand, if there's a confirmed downtrend on the chart. Observe if the momentum of 20 is moving under 0 since this will signify a downtrend. Then wait for the other momentum to cross downward and move below 0. When all of these happen, you can open a short trade.
More Efficient Ways of Using the Momentum Indicator
The best way to use a momentum indicator is in combination with other indicators. Here are the most efficient combinations you can use.
Momentum Indicator + Momentum Indicator
Traders use this combination as a way to confirm trends. When the second momentum confirms the prevailing trend in the first one, you can decide to open a long or short position.
Momentum Indicator + Volatility Indicator
This is a popular strategy used by many traders. This combination of momentum and volatility measures forms a squeeze forex momentum indicator.
Since the volatility indicator indicates the market's current volatility, the squeeze will be revealed and narrow down to a historically low level of volatility. Moreover, the squeeze momentum indicator will gauge the direction of the sudden movement that comes after the squeeze.
Momentum Indicator + Moving Average
This combination shows the momentum indicator and a trend-like indicator in one chart. The moving average line will appear and stretch across the momentum line upon completing the moving average settings. Based on this combination, trades can buy when the momentum crosses above the MA line and sell if the momentum indicator crosses below it.
The Best Momentum Indicator Trading Strategies
Momentum indicators are also beneficial in various trading strategies. Here's how the indicator is used in the most popular forex trading strategies.
The Momentum Indicator in Swing Trading
Swing trading is a strategy that utilises small price shifts in a more significant trend. It's based on the idea of price trends being rarely linear and focuses on the oscillations caused by bears and bulls.
With the momentum indicator, swing traders can trade within a shorter time frame. They can also hold their trades for as long as the momentum lasts.
The Momentum Indicator in Trend Trading
This significantly focuses and depends on trends. Since it's not easy to analyse the momentum in a particular direction, momentum indicators are used.
With momentum indicators, the magnitude of the recent price changes can be measured by trend traders and evaluate overbought or oversold conditions.
The Momentum Indicator in Intraday Trading
The timeframe greatly influences this. Since the goal of intraday traders is to trade as quickly as possible, the momentum indicators help them spot time frames in the market with a high volume. With this, they can buy and sell quickly and without interruption.
The Momentum Indicator in Scalping Trading
Scalping traders focus on trading off based on the small changes in prices. With a momentum indicator, traders can get signals of prices' actual movement quickly, even before it occurs.
Conclusion
Momentum indicators are good technical indicators. However, it works more accurately when combined with other indicators and trading strategies. The best way to fully grasp how to use this is to practice. To do that, you can open a Libertex demo account and practise trading using any momentum indicator without any risk.
FAQ
What Is the Momentum Indicator?
It's a technical indicator focused on the market's momentum. A momentum indicator is used to measure the fluctuation rate or trend of a price. It shows how fast and how strong the price will move and is moving in the market.
How Do You Read a Momentum Indicator?
Momentum indicators are often associated with price acceleration and deceleration. When the price increases rapidly, the momentum significantly increases and significantly decreases if the price rapidly decreases. Moreover, if the momentum indicator is above 0, there's an uptrend. If it's below 0, there's a downtrend.
What Is the Momentum Indicator Used For?
It's mainly used to determine the speed and strength of a price movement in the market. But, it works best when it's used with other technical indicators. It can act as a supporting indicator and a confirmation, too. It's also a valuable tool in various trading strategies.
Disclaimer: The information in this article is not intended to be and does not constitute investment advice or any other form of advice or recommendation of any sort offered or endorsed by Libertex. Past performance does not guarantee future results.
Why trade with Libertex?
- Get access to a free demo account free of charge.
- Enjoy technical support from an operator 5 days a week, from 9 a.m. to 9 p.m. (Central European Standard Time).
- Use a multiplier of up to 1:30 (for retail clients).
- Operate on a platform for any device: Libertex and MetaTrader.