
How to Research Stocks: Everything a Beginner Should Know
Prepared by the Libertex team
Content reviewed internally in accordance with regulatory standards.
When you're thinking about investing your money in the stock market, it's important to do your research first. This means looking into the company, the sector it operates in and the market as a whole.
Research helps you evaluate an asset's strengths, weaknesses and growth potential. No matter whether you're buying stock, an ETF, trading CFDs or a relatively predictable savings bond, you need to examine the pros and cons.
With thorough research, you can minimise your chances of loss. There are several ways that you can go about researching stocksand other tradable assets. The most important thing is to make sure that you're using multiple sources of information and interpreting that information correctly. In today's article, we'll explain where to find information on stocks and which factors you should pay close attention to.
Please note: there's no such thing as a guaranteed investment. Even if you do all of your research, there's still a risk that you could lose your money. So, before investing in the stock market, make sure that you're comfortable with the level of risk — only invest money that you can afford to lose.
Where to Find Stock Research Materials
Investors can use various sources when looking for reliable and credible stock research materials. Here are a few to get you started:
Stock Research Sites
A variety of subscription-based and free websites focus on providing investors with analyst recommendations, forecasts, newsletters, calendars, charting tools, etc. For instance, credible websites include The Wall Street Journal's Markets section and Bloomberg's Investing section. If you just want objective information, such as historical price data, market cap, earnings calendars, etc., Google Finance is an excellent resource.
"State of the Market" Reports
Remember how we mentioned that it's important to assess the overall industry's health before selecting stocks? These reports can help you make an informed decision. Keep in mind, though, that many organisations charge hefty fees for access to these reports. To easily find publicly available ones, just Google "State of the [Market] Industry Reports filetype:pdf". Then you can access numerous reports in PDF format immediately.
Broker Website
Your broker of choice may provide educational materials, so you can research shares. For instance, at Libertex, investors and traders can view webinars, read informative articles, etc.
Company's Financial Reports:
You can gather financial reports from companies you're interested in investing in, such as their Form 10-K and 10-Q. The former includes independently-audited financial statements, including the balance sheet, revenue, expenses and sources of income. The latter is the company's quarterly update on financial results and operations.
The Two Main Ways To Research Stocks
There are two main ways how to research a stock — fundamental and technical.
Fundamental Analysis
This measures a stock's intrinsic value and determines whether a share is currently overpriced or underpriced. To do so, you can gather information on each of these factors:
|
Company |
Industry |
Economy |
|
Financial stability and performance |
Industry growth rate |
The country's GDP |
|
Growth rate |
Type of industry — defensive, cyclical |
Inflation rate |
|
Operating efficiency |
Supply sector |
Investment rate |
|
Market share |
State of technology |
Economic forecasts |
|
Company profits |
Industrial policies |
Tax structure |
Technical Analysis
Technical analysis is all about identifying short-term trading opportunities by observing charts. You'll keep an eye out for price trends and patterns rather than paying attention to how the market will perform months or years from now.
Some indicators to consider during technical analysis include:
- Simple moving average
- Exponential moving average
- Stochastic oscillator
- Bollinger Bonds
- MACD
- Relative Strength Index
If you aren't sure what these indicators mean, your broker website of choice should have educational materials that guide you through each one. And, with a demo account, you can practice reading charts and pinpointing potentially advantageous entry/exit points.
What to Look for When Researching Stocks
At this point, you know where to gather research and which points are relevant to fundamental and technical analysis. So, you've likely compiled materials — perhaps you sit in front of a quarterly earnings report or a State of the Industry breakdown. But what do you do with the information therein? It's easy to get overwhelmed by the sheer amount of data that these documents contain. We'll show you how to do stock researchand which areas to focus on.
Common Analysis of the Industry
We've mentioned it before, but we'll highlight it again since it's so crucial: before you dive too deep into stocks, you need to make sure that the market sector is viable. You don't want to invest in a company in a dying industry, as it is likely that their stock will drop in value. And if you're planning to trade on short timeframes, you need to identify stocks that are priced low but are expected to enter a bull market.
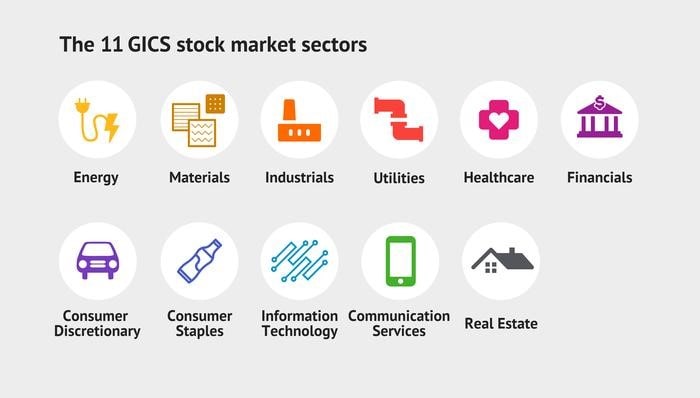
First, familiarise yourself with market sectors — there are 11 outlined by the GICS.
After you've learned about the stock market sectors, you can follow our earlier tip about finding "State of the Market" reports. These are often quite lengthy, but you can head to the sections about innovations and trends, revenue reports, CAGR, geographical breakdown and market outlooks.
Look at the Company's Business Model
When you research a company for investment, it's important to look at more than just its products and services. You also need to take a look at the business model — in other words, how the company turns a profit.
There are many kinds of business models, but here's a glance at several popular ones:
|
Subscription-based model |
Customers make recurring payments for ongoing use of the product. |
|
Freemium model |
New customers are attracted by a free product or service, and they are encouraged to upgrade to receive a wider range of features. |
|
Broker model |
A platform connects sellers and product owners to customers through a streamlined location. |
|
Product/service model |
This is the traditional business model, in which a company sells a product or service. This can encompass other models, such as the subscription-based and freemium models. |
|
Ad-based model |
The company (like Meta) has a wide audience base and makes most of its profit by providing ad space to other brands. |
Key Competitive Advantages
This area of astocks' research refers to whether a company can gain an edge over its competitors, usually in one of two ways: by offering cheaper goods or of higher quality. You may have heard this concept referred to as a "unique selling proposition".
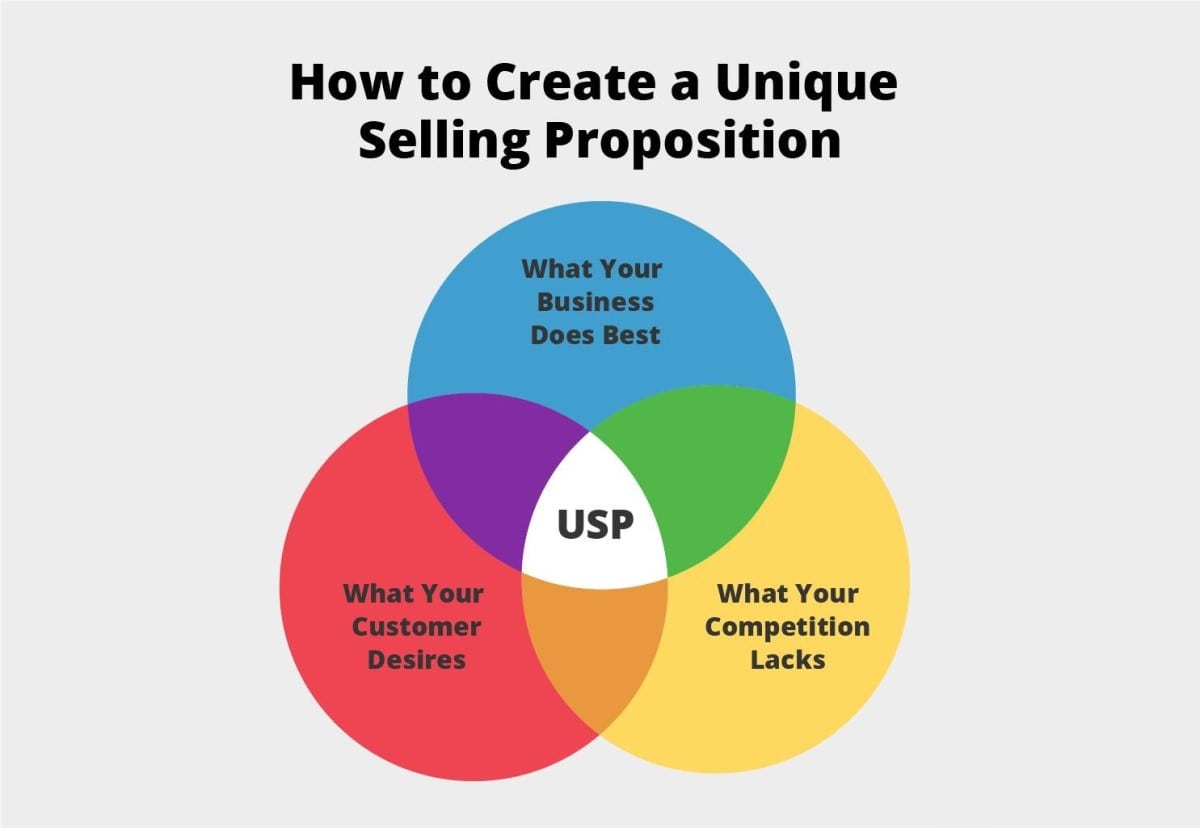
You want to find companies with strong competitive advantages. Unfortunately, there's no simple "advantage" metric you can track on a chart. You'll have to read the company's USP, innovations and plans for the future, using that information to determine whether they offer a better service than their competitors. Thankfully, to make this decision a little easier, there are numerous investment analysts that provide thought pieces on the strength of publicly traded companies. Seeking Alpha is a great place to look!
Financial Strength
To determine a company's financial strength, you should analyse these areas.
- Income Statement. It states the company's operational results for a certain quarter or year. It records the funds flowing in and out of business during that specified time frame. You can view the income statement to find information like sales, gross profit, the cost of goods sold, taxes on income, net income, depreciation expenses, dividends per common share, earnings per share, etc.
- Balance Sheet. This sheet gives you a snapshot of the company's financial position, including its assets, liabilities and owners' equity.
- Cash Flow Statement. A cash flow statement shows how the company has managed its cash inflows and outflows, which gives you a good idea of the business's liquidity. You'll be able to see their cash at the beginning and end of the year, the cost of equipment purchased, bonds issued and the increase/decrease in accounts payable and receivable.
Management Research
Who's at the helm of a company can make a big difference in the stock price and future success. For instance, when Satya Nadella became the new CEO of Microsoft, he transformed the company into a cloud-first company. This transition established Microsoft as a major cloud computing vendor, and the share price has increased seven-fold since then.
Of course, not every new CEO will bring such great results to a company; you have to look at their business history and the general market sentiment towards the management shift. Keep in mind that when new management is brought on, the stock price will be highly volatile for a while.
Growth Analysis and Target Price
Stock prices generally rise as a company's earnings increase. So, it's important to pay attention to a company's projected earnings and, perhaps more importantly, whether it could achieve its previous projections. You can also view growth forecasts accompanied by target prices by Wall Street analysts.
Valuations
Valuation is the process of assigning value to a stock, which helps you determine whether the current price is high or low compared to the business' growth projections and current performance. The most common valuation method is by determining the price-to-earnings ratio, which we'll examine in a bit. Some other valuation methods include calculating the return on investment, pay-back period, internal rate of return and net present value.
How to Research a Stock Before You Buy: Ratios and Metrics to Examine
Here, we talk about the financial parameters of the stocks you're going to buy.
Earnings per Share (EPS)
To find Earnings per Share, you'll divide the company's net profit by the number of shares outstanding. The results indicate how much the company makes per share, and it's commonly used to indicate its corporate value.
It's worth knowing that EPS can be distorted by "extraordinary items", such as one-off transactions that bring in a huge profit or a huge loss caused by a natural disaster. Some analysts factor these items into their calculations.
Price-to-Earnings (P/E) Ratio
A price to earnings ratio is a stock valuation method for a company's current share price compared to its prior earnings per share— usually over a time frame of 12 months. In such a case, it would be called a 12-month trailing P/E ratio. You can also calculate the forward P/E by dividing the stock price by Wall street analysts' projected prices.
A high P/E (25+) indicates the company is quickly growing, but risks are higher. Slow-growing companies have a lower P/E, but it's often safer, even though earnings may be lower.
Price-to-Earnings-Growth (PEG) Ratio
To find this ratio, you'll divide the stock's price-to-earnings ratio by its earnings growth rate over a certain time period. A PEG of 1-2% a year is considered "normal".
Price-to-Book (P/B) Ratio
This calculation compares a company's market capitalisation to its book value. You can find it by dividing the share price by the book value per share (also referred to as the shareholder's equity per share). If the value is below 1.0, this indicates the stock is undervalued and may be a good buy.
Debt-to-EBITDA Ratio
First, understand that EBITDA stands for earnings before interest, taxes, depreciation and amortisation. So, to find the debt-to-EBITDA ratio, you'll divide the former by the latter. The results indicate the company's ability to pay off its debts: if the ratio is high, the debt load is too high. A ratio of 4.0 or above is typically considered a red flag.
Market Capitalisation
This refers to the company's total market value of all outstanding shares. This figure helps classify companies based on their cap level: large-cap companies have a market cap of $10B or more, mid-cap companies fall between $2B-$10B, and small-cap companies are $2B or less. Market capitalisation doesn't affect the share price — it's the other way around. However, it's useful for portfolio diversification; many investors prefer to split their shares across small-, mid- and large-cap companies.
Return on Equity (ROE)
To find ROE, you'll divide the company's net income by shareholder's equity. It's a profitability ratio and shows you how much a shareholder will receive back on their invested capital. An ROE of 15-20% is considered "good."
Net Profit Margin
The net profit margin is found by dividing a company's net profit by its revenue. This figure tells you which percentage of a company's income is actually profit. An appropriate net profit will vary from sector to sector, so make sure to research those! But, on average, a 20% net profit margin is considered "good".
Free Cash Flow
Free cash flow indicates how much cash a business generates after operating expenses and capital expenditures. This is a pretty complicated figure to calculate, as you'll need to gather data from multiple financial statements. You can follow the steps in this image, or, to save some time, you can find the metric on sites like Yahoo Finance.
Return on Assets
This is a financial ratio that measures how profitable a business is compared to its total assets. In other words, you can use the figure to determine how efficiently the company is using its assets to turn a profit. To find this ratio, you'll divide the net profit by total assets and multiply the results by 100. A ROA of over 5% is considered "good", while one over 20% is considered "excellent".
Conclusion
After reading this article, you'll be well on your way to making data-driven investment and trading decisions. Just make sure to gather information from multiple sources and, if possible, verify calculations yourself by manually reviewing income statements and cash flow sheets. It's time-consuming, but minimising losses is worth it.
FAQ
How do you conduct research on the stock market?
You can read forecasts from Wall Street analysts, review thought pieces in financial magazines, view technical charts, gather data from financial statements, read industry reports, etc.
How do I know what stocks to invest in?
First, you need to figure out your time horizon and the level of risk you feel comfortable with. Then, research the 11 stock market sectors and see which ones align with your goals. Pick a method of research: fundamental or technical. If you want to hold stock for the long term, fundamental analysis is more suitable. If you prefer short trades, then technical analysis is helpful. Gather qualitative and quantitative data, and pinpoint companies that have a competitive advantage. After doing all of this, you should have a good idea of which stocks will boost your portfolio.
How do beginners buy stocks?
Typically, beginners buy stocks by signing up with an online broker. This gives them easy access to charting tools, and platforms are often running deals so you can save on fees. What's more, platforms like Libertex allow you to practice trading with a demo account.
How to analyse a stock before buying?
There are many ways to study stocks, but here are a few ideas to get you started: analyse the overall industry, look at the company's business model, review the business' key competitive advantages, assess its financial strength and read target price forecasts from analysts.
Disclaimer: The information in this article is not intended to be and does not constitute investment advice or any other form of advice or recommendation of any sort offered or endorsed by Libertex. Past performance does not guarantee future results.
Why trade with Libertex?
- Get access to a free demo account free of charge.
- Enjoy technical support from an operator 5 days a week, from 9 a.m. to 9 p.m. (Central European Standard Time).
- Use a multiplier of up to 1:30 (for retail clients).
- Operate on a platform for any device: Libertex and MetaTrader.