
Natural Gas Price Forecast: Predictions for 2026, 2027 and Beyond
Prepared by the Libertex team
Content reviewed internally in accordance with regulatory standards.
The natural gas market in 2026 is navigating a complex landscape. Winter Storm Fern in January caused record storage withdrawals and brief price spikes above $7/MMBtu, while the ongoing Middle East conflict has disrupted LNG flows through the Strait of Hormuz, pushing European and Asian gas prices higher. Meanwhile, three new US LNG export facilities — Plaquemines LNG, Corpus Christi Stage 3, and Golden Pass LNG — are ramping up, creating significant new demand for US-produced gas.
This article provides a natural gas forecast for 2026, 2027 and beyond, covering supply and demand dynamics, expert predictions, technical analysis, and the key factors that may shape future pricing.
Key Points:
- Current price.As of mid-April 2026, Henry Hub natural gas is trading around $2.54–2.72/MMBtu, having pulled back sharply from the Winter Storm Fern spike of $7.72/MMBtu in late January. The EIA's March 2026 STEO projects the Henry Hub spot price to average approximately $3.80/MMBtu for 2026 as a whole.
- 2026 forecast.According to LongForecast, natural gas prices will follow a gradual upward trend through the first half of 2026 before correcting in the second half. The price is projected to open April at $2.54, rise through June to $2.43, then pull back by August to $2.42. A recovery is expected in autumn, with the year closing at $2.72 in December.
- 2027 forecast.LongForecast projects a moderately volatile 2027 for natural gas. After opening the year at $2.72, prices are expected to rise through spring, reaching $2.53 by June. A summer correction follows, pushing prices to $2.51 by August, before a renewed climb takes prices to $2.68 by July — the projected annual high. The year closes at $2.83 in December.
- Long-term outlook. According to the EIA's long-term projections, Henry Hub prices may reach approximately $3.80/MMBtu by 2030 and $4.20/MMBtu by 2040. Deloitte projects a somewhat higher path, with $4.40/MMBtu in 2030 and $4.60/MMBtu by 2032. Both outlooks assume continued growth in LNG exports and gradual tightening of supply-demand balances.
Recent Updates:
- Winter Storm Fern impact.In late January 2026, Winter Storm Fern caused a record 360 Bcf weekly storage withdrawal, the largest in EIA history. Henry Hub prices briefly surged to $7.72/MMBtu before rapidly correcting as temperatures moderated. Storage levels fell to approximately 5.6% below the five-year average, but milder February weather helped narrow the deficit.
- LNG export expansion.Three major US LNG export facilities are ramping up in 2026: Plaquemines LNG, Corpus Christi Stage 3, and Golden Pass LNG. LNG feedgas deliveries reached near-record levels of 18.5 Bcf/d in February 2026. EIA projects LNG exports to grow 9% in 2026 and 11% in 2027, making them the largest source of demand growth.
- Middle East conflict and Strait of Hormuz.At the end of February 2026, US and Israeli military operations against Iran led to disruptions in shipping through the Strait of Hormuz. This caused a sharp increase in European and Asian gas prices. However, the EIA expects US natural gas prices to be relatively unaffected by this development, as LNG export facilities were already operating at high utilization levels prior to the conflict.
- Production growth.US marketed natural gas production reached a record 118.5 Bcf/d in November 2025, and EIA projects production to average 118 Bcf/d in 2026 and 121 Bcf/d in 2027. Growth is expected from the Haynesville, Permian, and Appalachia regions. Higher oil prices from the Middle East conflict may drive more oil-directed drilling in the Permian, contributing to greater associated gas production.
Live Natural Gas Price Chart
What Is Natural Gas, and Why Does It Matter?
Natural gas is a fossil fuel composed primarily of methane (70%–90%), formed over millions of years beneath the earth's surface. The largest proven reserves are located in Russia, Iran, Qatar and the United States. It is used for heating, electricity generation, industrial processes and as a feedstock for petrochemicals.
Natural gas provides approximately 40% of US electricity generation and over 84% of UK heating needs. As a lower-carbon alternative to coal, natural gas plays a key role in global energy transition strategies, serving as a "bridge fuel" between fossil fuels and renewables.
The commodity has become increasingly significant in global trade through liquefied natural gas (LNG), which allows gas to be transported by sea. This has connected previously isolated regional markets — notably linking US producers to European and Asian buyers — and created new price dynamics.
Factors That Influence Natural Gas Prices
The price of natural gas is shaped by several interconnected factors:
- Supply and demand balance. Whether production and imports meet consumption needs. US dry gas production exceeded 109 Bcf/d in 2025 and is expected to continue rising.
- Weather. Temperature extremes drive heating and cooling demand. Winter Storm Fern in January 2026 demonstrated how a single weather event can cause record storage withdrawals and price spikes.
- LNG export demand. The ramp-up of new LNG terminals (Plaquemines, Corpus Christi Stage 3, Golden Pass) is creating significant new demand for US gas, linking domestic prices more closely to global markets.
- Storage levels. The relationship between current inventories and the five-year average is a key indicator of market tightness. Periods of below-average storage typically correspond to higher prices.
- Data centres and AI. Growing electricity demand from hyperscalers like Google, Amazon and Microsoft is driving additional natural gas consumption for power generation. This emerging demand source is expected to add approximately 0.5 Bcf/d cumulatively through 2026.
- Geopolitical events. Conflicts that disrupt major supply routes — such as the current disruptions to LNG flows through the Strait of Hormuz — can cause sharp regional price divergences.
- Energy policy and fuel switching. Government commitments to net-zero emissions, coal retirements, and incentives for renewables all influence long-term gas demand trajectories.
- US dollar strength. Since gas is traded in USD, a stronger dollar can suppress international demand by making gas more expensive for non-US buyers.
Natural Gas Supply & Demand Outlook for 2026–2027
According to the EIA's March 2026 STEO, US gas production will continue growing through the forecast period:
Production (Bcf/d):
- 2025: 116
- 2026: 118
- 2027: 121
Growth is driven primarily by the Haynesville, Permian, and Appalachia regions. The Mountain Valley Pipeline, which began operations in June 2024, has added takeaway capacity from Appalachia.
Demand drivers: Total US natural gas demand, including exports, is expected to rise by 2% in 2027 to approximately 119 Bcf/d — exceeding total supply and contributing to tighter market conditions.
LNG exports are the largest source of demand growth: +9% in 2026, +11% in 2027. Natural gas consumption for electricity generation continues to increase as gas-fired capacity supports growing power demand and balances intermittent renewable generation.
In contrast, combined industrial, residential, and commercial consumption is expected to decrease by 3% in 2026, primarily due to closer-to-normal weather assumptions and lower industrial activity.
Natural Gas Price Forecast for 2026
According to LongForecast, natural gas prices in 2026 are expected to follow a gradually rising trend through mid-year, followed by a modest correction. After opening April at $2.54, the price climbs through spring and early summer, reaching $2.43 by June. A pullback in the second half sees prices dip to $2.42 by August before recovering. The year closes at $2.72 in December, reflecting a market still searching for a sustained directional trend amid competing supply growth and LNG demand expansion.
The EIA's March 2026 STEO projects the Henry Hub spot price to average approximately $3.80/MMBtu for 2026, down 13% from the previous month's forecast due to milder-than-expected February weather.
|
Month |
Open ($) |
Min-Max ($) |
Close ($) |
Total % |
|
April 2026 |
2.879 |
2.38-2.899 |
2.538 |
-11.8% |
|
May 2026 |
2.538 |
2.176-2.658 |
2.414 |
-16.2% |
|
June 2026 |
2.414 |
2.311-2.555 |
2.433 |
-15.5% |
|
July 2026 |
2.433 |
2.168-2.433 |
2.282 |
-20.7% |
|
August 2026 |
2.282 |
2.282-2.544 |
2.423 |
-15.8% |
|
September 2026 |
2.423 |
2.159-2.423 |
2.273 |
-21% |
|
October 2026 |
2.273 |
2.273-2.535 |
2.414 |
-16.2% |
|
November 2026 |
2.414 |
2.414-2.692 |
2.564 |
-10.9% |
|
December 2026 |
2.564 |
2.564-2.859 |
2.723 |
-5.4% |
Source: Longforecast (17.04.2026)
Natural Gas Price Forecast for 2027
According to LongForecast, the year 2027 is expected to see natural gas prices follow a moderately upward trajectory with periodic corrections. After opening at $2.72 in January, prices rise to $2.63 by the end of the month. A spring correction takes prices down to $2.47 in February before a renewed climb pushes them to $2.52 by June. July marks the projected annual high at $2.68. A summer pullback follows, with prices dipping to $2.51 by September before stabilising. The year closes at $2.83 in December, reflecting a market gradually tightening as LNG demand growth begins to outpace supply growth.
The EIA projects that demand growth will outpace supply growth in 2027 by approximately 1.6 Bcf/d, driven mainly by LNG export expansion, pushing the average Henry Hub price to approximately $3.90/MMBtu.
|
Month |
Open ($) |
Min-Max ($) |
Close ($) |
Total % |
|
January 2027 |
2.723 |
2.499-2.762 |
2.63 |
-8.6% |
|
February 2027 |
2.63 |
2.344-2.63 |
2.467 |
-14.3% |
|
March 2027 |
2.467 |
2.333-2.579 |
2.456 |
-14.7% |
|
April 2027 |
2.456 |
2.407-2.661 |
2.534 |
-12% |
|
May 2027 |
2.534 |
2.258-2.534 |
2.377 |
-17.4% |
|
June 2027 |
2.377 |
2.377-2.65 |
2.524 |
-12.3% |
|
July 2027 |
2.524 |
2.524-2.814 |
2.68 |
-6.9% |
|
August 2027 |
2.68 |
2.388-2.68 |
2.514 |
-12.7% |
|
September 2027 |
2.514 |
2.514-2.804 |
2.67 |
-7.3% |
|
October 2027 |
2.67 |
2.67-2.978 |
2.836 |
-1.5% |
|
November 2027 |
2.836 |
2.527-2.836 |
2.66 |
-7.6% |
|
December 2027 |
2.66 |
2.66-2.966 |
2.825 |
-1.9% |
Source: Longforecast (17.04.2026)
Long-Term Natural Gas Price Forecast: 2028–2030
The long-term outlook for natural gas is shaped by the tension between growing LNG export demand and the energy transition toward renewables.
According to LongForecast, natural gas prices through 2028–2030 are expected to follow a cyclical pattern of modest gains and corrections, with prices generally ranging between $2.00 and $3.00/MMBtu.
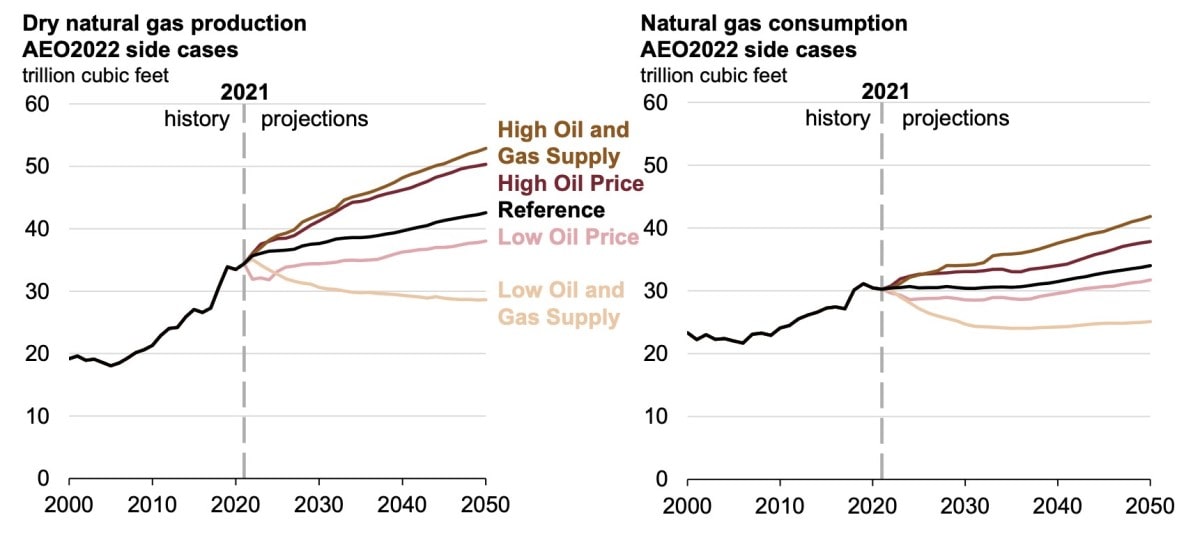
The EIA's Annual Energy Outlook projects three scenarios:
- Reference case: Henry Hub reaches approximately $3.80/MMBtu by 2030, climbing to $4.20/MMBtu by 2040.
- High-price case: Accelerating LNG demand from Asia and data centre power needs could push prices above $5.00/MMBtu by 2030.
- Low-price case: Abundant shale supply and faster-than-expected renewable adoption could keep prices below $3.00/MMBtu.
Deloitte projects a somewhat more bullish path, with Henry Hub averaging $4.40/MMBtu by 2030 and rising to $4.60/MMBtu by 2032, assuming sustained global LNG demand.
McKinsey notes that roughly 60% of demand growth for North American gas through 2030 will come from LNG exports, projected to reach approximately 20 Bcf/d.
Key factors for the long-term outlook include the pace of coal retirements, data centre electricity demand growth, renewable energy adoption rates, and whether shale production growth can keep up with rising export commitments.
Technical Analysis of Natural Gas
To help assess market direction, traders use technical indicators alongside fundamental analysis. Below are key indicators for natural gas.
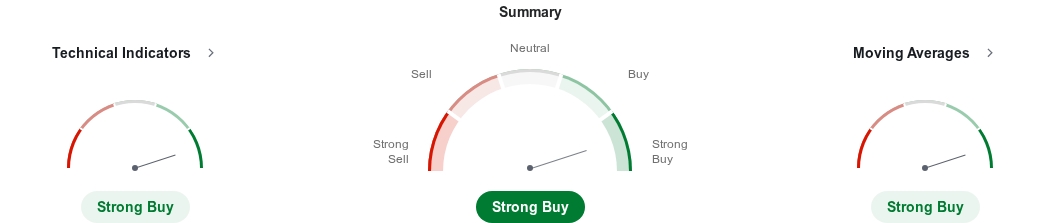
Technical Indicators:
|
Name |
Value |
Action |
||
|
RSI(14) |
62.03 |
Buy |
||
|
STOCH(9,6) |
74.37 |
Buy |
||
|
STOCHRSI(14) |
68.54 |
Buy |
||
|
MACD(12,26) |
0.016 |
Buy |
||
|
ADX(14) |
35.5 |
Buy |
||
|
Williams %R |
-9.091 |
Overbought |
||
|
CCI(14) |
133.91 |
Buy |
||
|
ATR(14) |
0.0232 |
High Volatility |
||
|
Highs/Lows(14) |
0.0194 |
Buy |
||
|
Ultimate Oscillator |
60.7 |
Buy |
||
|
ROC |
1.714 |
Buy |
||
|
Bull/Bear Power(13) |
0.052 |
Buy |
||
Source: Investing.com (17.04.2026)
Moving Averages:
|
Name |
Simple |
Exponential |
||
|
MA5 |
2.663 |
Buy |
2.66 |
Buy |
|
MA10 |
2.654 |
Buy |
2.651 |
Buy |
|
MA20 |
2.631 |
Buy |
2.638 |
Buy |
|
MA50 |
2.612 |
Buy |
2.626 |
Buy |
|
MA100 |
2.625 |
Buy |
2.637 |
Buy |
|
MA200 |
2.683 |
Sell |
2.682 |
Sell |
Source: Investing.com (17.04.2026)
Pivot Points:
|
Name |
S3 |
S2 |
S1 |
Pivot Points |
R1 |
R2 |
R3 |
|
Classic |
2.647 |
2.647 |
2.647 |
2.647 |
2.647 |
2.647 |
2.647 |
|
Fibonacci |
2.647 |
2.647 |
2.647 |
2.647 |
2.647 |
2.647 |
2.647 |
|
Camarilla |
2.647 |
2.647 |
2.647 |
2.647 |
2.647 |
2.647 |
2.647 |
|
Woodie's |
2.647 |
2.647 |
2.647 |
2.647 |
2.647 |
2.647 |
2.647 |
|
DeMark's |
- |
- |
2.647 |
2.647 |
2.647 |
- |
- |
Source: Investing.com (17.04.2026)
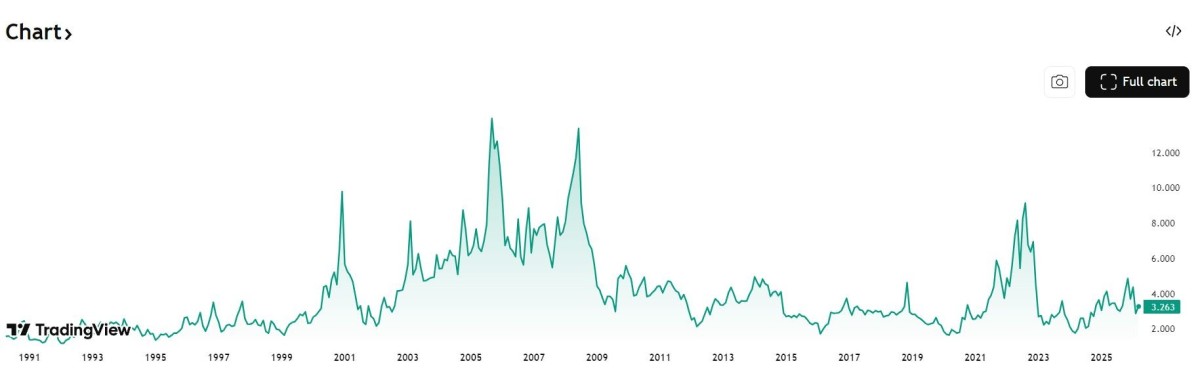
How Has the Natural Gas Price Changed Over Time?
Natural gas has been one of the most volatile energy commodities over the past decade. Key historical milestones include:
- 2014: Prices rose on fears that the Ukraine-Russia conflict could cut off energy supply routes — a concern that proved prescient years later.
- 2016–2019: Prices stabilised in a range of approximately $2.50–3.50/MMBtu as US shale production surged, creating ample supply.
- 2020: The COVID-19 pandemic triggered a sharp demand drop. Henry Hub averaged approximately $2.03/MMBtu — the lowest annual average since 1995.
- 2021: Economic recovery drove prices sharply higher. Henry Hub averaged $3.89/MMBtu, with European prices (TTF) surging even more dramatically.
- 2022: The Russia-Ukraine conflict created an unprecedented energy crisis in Europe. European TTF prices briefly exceeded $70/MMBtu, while US Henry Hub hit $8.81/MMBtu in August. This was the most volatile year for global gas markets in decades.
- 2023–2024: A mild European winter and strong LNG imports helped European prices normalise. US Henry Hub fell to an average of $2.57/MMBtu in 2024, weighed down by record production and mild weather.
- 2025: Prices averaged approximately $3.57/MMBtu, supported by rising LNG exports and gradual tightening of domestic supply-demand balances. December 2025 saw colder-than-normal weather.
- January 2026: Winter Storm Fern caused a historic price spike. Henry Hub briefly surged to $7.72/MMBtu as record cold drove a 360 Bcf weekly storage withdrawal — the largest in EIA history. Prices corrected rapidly as temperatures normalised.
- February–March 2026: At the end of February, US and Israeli military operations against Iran disrupted shipping through the Strait of Hormuz. European and Asian gas prices rose sharply. The EIA notes that US gas prices have been relatively unaffected so far, as LNG export terminals were already operating near capacity.
US vs European Natural Gas Prices
One of the defining features of the global natural gas market is the persistent price gap between the United States and Europe. US Henry Hub prices benefit from abundant domestic shale production, while European prices are more exposed to geopolitical supply risks and LNG import costs.
The EIA projects the following average prices:
|
United States ($/MMBtu) |
Europe ($/MMBtu) |
|
|
2026 |
~3.80 |
Higher due to Hormuz disruption |
|
2027 |
~3.90 |
Expected to moderate |
|
2030 |
~3.80 (EIA) / ~4.40 (Deloitte) |
~7.50 (World Bank) |
The current Middle East conflict has widened this gap further, as European gas prices surged on Strait of Hormuz disruption concerns while US prices remained relatively stable.
What to Do with Natural Gas: Trade or Invest?
As with any commodity, there is no certainty when it comes to natural gas prices. The market is characterised by high volatility — as demonstrated by the rapid price swings between the Winter Storm Fern spike and subsequent correction — making it a high-risk asset.
Before making any decisions, it is essential to consult the latest expert projections, monitor market trends, and conduct thorough technical analysis. Natural gas prices can move sharply in response to weather events, geopolitical developments, and shifts in supply-demand balances.
For those not looking for long-term exposure, CFDs allow you to speculate on natural gas price movements, whether the price is rising or falling, within shorter timeframes. With the Libertex trading platform, you can trade natural gas CFDs. However, it is important to understand that CFDs are complex instruments that carry a high risk of losing money due to leverage. Leverage amplifies both potential gains and potential losses.
FAQ
Will natural gas prices go up?
Based on the EIA's March 2026 STEO, US natural gas prices are expected to average approximately $3.80/MMBtu in 2026 and $3.90/MMBtu in 2027. The gradual tightening of supply-demand balances — driven mainly by LNG export growth and data centre electricity demand — suggests upward pressure on prices in the medium term. However, abundant US shale production could limit the extent of any sustained price increase.
Will gas prices go back down in the UK?
It depends on whether the UK manages to reduce its dependence on Russian gas. Energy analyst Ano Kuhanathan said that reducing demand for gas should be at the centre of the UK's response to high prices. However, he noted that the IEA's plan to cut dependence by a third in just one year is too aggressive and hardly possible.
What is the natural gas price forecast for 2027?
The EIA projects the Henry Hub spot price to average approximately $3.90/MMBtu in 2027, driven by demand growth from new LNG export facilities outpacing supply growth. LongForecast projects a range of approximately $2.38–$2.80/MMBtu through 2027, with periodic corrections. The divergence between forecasts reflects differing assumptions about production growth and demand elasticity.
Why did natural gas prices spike in January 2026?
Winter Storm Fern brought extreme cold across much of the United States in late January 2026, causing a record 360 Bcf weekly storage withdrawal. Henry Hub prices briefly surged to $7.72/MMBtu before rapidly normalising as temperatures moderated and production recovered.
How does the Middle East conflict affect US natural gas prices?
The ongoing military operations against Iran and disruptions to the Strait of Hormuz have caused sharp price increases in European and Asian gas markets. However, the EIA expects US natural gas prices to be relatively unaffected, as domestic LNG export terminals were already operating near capacity before the conflict began.
What will natural gas cost in 2030?
Long-term projections vary. The EIA's reference case projects Henry Hub at approximately $3.80/MMBtu by 2030. Deloitte's estimate is higher at $4.40/MMBtu, reflecting sustained global LNG demand. In Europe, the World Bank projects prices of approximately $7.50/MMBtu by 2030, reflecting continued reliance on imported gas.
Disclaimer: The information in this article is not intended to be and does not constitute investment advice or any other form of advice or recommendation of any sort offered or endorsed by Libertex. Past performance does not guarantee future results.
Why trade with Libertex?
- Get access to a free demo account free of charge.
- Enjoy technical support from an operator 5 days a week, from 9 a.m. to 9 p.m. (Central European Standard Time).
- Use a multiplier of up to 1:30 (for retail clients).
- Operate on a platform for any device: Libertex and MetaTrader.