
Copper Price Forecast: What to Expect From One of the Most Consumed and Versatile Metals?
Prepared by the Libertex team
Content reviewed internally in accordance with regulatory standards.
Copper is trading near its all-time highs in 2026, a rally driven by a tight physical market, accelerating demand from the energy transition, and recurring supply disruptions at major mines. This copper price forecast covers the near-term monthly outlook for 2026 and 2027, the medium-term trajectory to 2030, and the long-term structural outlook to 2040, drawing on WalletInvestor, LongForecast, technical analysis from Investing.com, and institutional research from JPMorgan and S&P Global.
Copper's price is shaped by a genuine tug-of-war. On one side, there are near-term macro headwinds, such as a stronger US dollar, tighter Federal Reserve policy, and tariff uncertainty. On the other, there is a structural supply deficit that most major forecasters expect to widen through the 2030s as electric vehicles, renewable energy infrastructure, and grid modernisation projects consume more copper than new mines can supply. Traders who want direct exposure to this trend can sign up with Libertex and follow copper price movements via CFDs or real stock investments in copper-mining companies.
Key Takeaways
- WalletInvestor expects a broadly range-bound 2026, with copper trading between roughly $5.70 and $7.06 per pound and a year-end close near $6.54, as the market digests tighter Fed policy against a backdrop of persistent supply tightness.
- LongForecast projects a more pronounced move for 2026, with prices potentially testing $6.49–6.92/lb by Q4 as Chinese restocking and mine-supply disruptions continue, implying roughly +2.4% from current levels to the year-end close of $6.49.
- For 2027, WalletInvestor sees copper holding a $4.45–7.20/lb range with a year-end price near $4.57, reflecting a projected pullback of approximately −30% on the year.
- S&P Global projects a cumulative copper concentrate deficit extending to 2036, driven by declining ore grades and a shortage of new greenfield mine supply – a core pillar of the long-term bull case.
- Traders Union's long-range model projects copper at approximately $8.30/lb by end-2030, rising to $8.90/lb by end-2036 and $9.40/lb by end-2040, with the wide range of long-horizon outcomes reflecting genuine uncertainty rather than imprecision.
- JPMorgan estimates copper demand carries a GDP beta of approximately 1.2x, meaning a 1% slowdown in global growth corresponds to roughly a 1.2% pullback in copper demand growth – the single most important variable to watch in 2026.
Recent Updates
- Copper is currently trading at approximately $6.35/lb, with WalletInvestor projecting a year-end 2026 close near $6.54 and LongForecast targeting $6.49, as near-term macro crosscurrents continue to weigh on industrial metals.
- Copper hit a projected peak near $7.06/lb in late summer 2026 according to WalletInvestor before a seasonal pullback, while LongForecast's November peak of $6.92/lb reflects ongoing supply-side tightness against a stronger US dollar backdrop.
- A Section 232 tariff review on copper and copper-derivative products reached a decision point on 30 June 2026, adding a fresh source of near-term price volatility.
- Global visible copper inventories rose to roughly 1.5 million tonnes in 2026, an increase of around 540,000 tonnes year-to-date, even as concentrate markets outside the US remain structurally tight.
Copper Price Today
Copper Price Forecast 2026: WalletInvestor
WalletInvestor expects copper to trade in a fairly dynamic band for the remainder of 2026, rising from around $6.29 in July toward a projected August peak near $7.00 before easing back to a year-end close of $6.54, a gain of approximately +12.7% from the year's opening level reflecting a broadly constructive but volatile short-term picture.
| Month | Open (USD) | Close (USD) | Min (USD) | Max (USD) | Change, % |
| July 2026 | 6.29 | 6.47 | 6.24 | 6.47 | 0% |
| August 2026 | 6.42 | 7 | 6.18 | 7 | 8.19% |
| September 2026 | 6.99 | 6.68 | 6.51 | 7.06 | -4.57% |
| October 2026 | 6.62 | 6.3 | 6.26 | 6.76 | -5.69% |
| November 2026 | 6.42 | 6.46 | 6.3 | 6.57 | 2.54% |
| December 2026 | 6.46 | 6.54 | 6.28 | 6.9 | 1.24% |
Source: WalletInvestor (27.07.2026)
Copper Price Forecast 2026: LongForecast
LongForecast takes a more bullish view for the rest of 2026, projecting a climb from around $6.33 in July toward a November high near $6.92 and a year-end close of $6.49, implying roughly +2.4% upside from the current price of $6.35, driven by continued Chinese restocking demand and ongoing mine-supply disruptions in Chile and Indonesia.
| Month | Min–Max (USD) | Close (USD) | Change, % |
| July 2026 | 5.845–6.658 | 6.333 | -0.2% |
| August 2026 | 5.975–7.038 | 6.329 | -0.3% |
| September 2026 | 5.827–6.441 | 6.134 | -3.4% |
| October 2026 | 6.134–6.84 | 6.514 | 2.6% |
| November 2026 | 6.514–7.264 | 6.918 | 9% |
| December 2026 | 6.165–6.918 | 6.489 | 2.2% |
Source: LongForecast (27.07.2026)
Copper Price Forecast 2027 – WalletInvestor
WalletInvestor projects a more challenging 2027, with copper opening near $6.52 in January and closing the year around $4.57, a significant decline of approximately −30% on the year, as macro headwinds are expected to weigh heavily on industrial metal demand.
| Month | Open (USD) | Close (USD) | Min (USD) | Max (USD) | Change, % |
| January 2027 | 6.52 | 6.62 | 6.4 | 6.69 | 1.22% |
| February 2027 | 6.71 | 6.76 | 6.51 | 6.86 | 2.11% |
| March 2027 | 6.76 | 6.83 | 6.66 | 7.2 | 1.04% |
| April 2027 | 6.75 | 6.48 | 6.43 | 7.01 | -5.12% |
| May 2027 | 6.48 | 6.35 | 6.2 | 6.72 | -2.01% |
| June 2027 | 6.48 | 6.62 | 6.39 | 6.84 | 4.25% |
| July 2027 | 6.59 | 6.74 | 6.58 | 6.87 | 1.81% |
| August 2027 | 5.04 | 4.95 | 4.81 | 5.19 | 1.86% |
| September 2027 | 4.95 | 4.86 | 4.67 | 5.14 | 1.83% |
| October 2027 | 4.85 | 4.76 | 4.62 | 5 | 1.93% |
| November 2027 | 4.76 | 4.67 | 4.48 | 4.94 | 1.9% |
| December 2027 | 4.66 | 4.57 | 4.45 | 4.79 | 2.01% |
Source: WalletInvestor (27.07.2026)
Copper Price Forecast 2028–2030: LongForecast
LongForecast's medium-term model has copper in a $7.97–10.29 range through 2028 with a year-end close near $9.46, rising to a $8.88–12.01 band by end-2029 with a year-end close of $11.44, and continuing upward toward a 2030 mid-year price of $12.75 and a projected year-end close of $13.54, as structural supply constraints meet accelerating green-economy demand.
| Year | Mid-year (USD) | Year-end (USD) | Change, % |
| 2028 | 9.198 | 9.463 | 49.1% |
| 2029 | 9.498 | 11.44 | 80.2% |
| 2030 | 12.75 | 13.54 | 113% |
Source: LongForecast (27.07.2026)
Long-Term Copper Price Outlook 2030–2040: Traders Union
Traders Union's long-range statistical model projects copper at approximately $8.30 by end-2030, rising to approximately $8.90 by end-2036 and $9.40 by end-2040. The range of uncertainty grows substantially the further out the projection runs - these figures represent a central scenario, not a ceiling or floor.
Long-range forecasts should be read as directional, not precise: a decade of geopolitical, technological and monetary-policy shifts lies between now and 2040, and every major forecaster's uncertainty range widens accordingly.
| Year | Year-end (USD) |
| 2030 | 8.30 |
| 2036 | 8.90 |
| 2040 | 9.40 |
Source: Traders Union (27.07.2026)
Technical Analysis (27.07.2026)
There are three steps to a basic technical analysis of copper: identify the prevailing trend on your chosen timeframe, mark support and resistance levels from historical price reactions, then use technical indicators to time entries and exits. The summary below reflects a snapshot as of 01.07.2026 and should be read as educational context, not a trading signal.
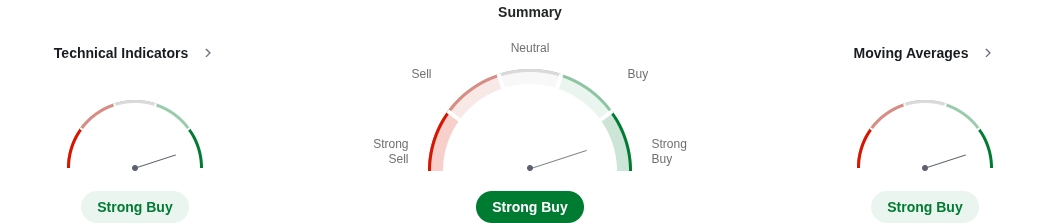
Technical Indicators
| Name | Value | Action |
| RSI(14) | 67.9 | Buy |
| STOCH(9,6) | 72.26 | Buy |
| STOCHRSI(14) | 93.33 | Overbought |
| MACD(12,26) | 0.55 | Buy |
| ADX(14) | 63.18 | Buy |
| Williams %R | -13.58 | Overbought |
| CCI(14) | 110.71 | Buy |
| ATR(14) | 0.66 | High Volatility |
| Highs/Lows(14) | 0.5399 | Buy |
| Ultimate Oscillator | 53.38 | Buy |
| ROC | 35.24 | Buy |
| Bull/Bear Power(13) | 1.2215 | Buy |
Source: Investing (27.07.2026)
Moving Averages
| Name | Value (Simple) | Action (Simple) | Value (Exponential) | Action (Exponential) |
| MA5 | 6.1268 | Buy | 6.1849 | Buy |
| MA10 | 5.8651 | Buy | 5.8708 | Buy |
| MA20 | 5.2397 | Buy | 5.4061 | Buy |
| MA50 | 4.4656 | Buy | 4.6844 | Buy |
| MA100 | 3.8874 | Buy | 4.1981 | Buy |
| MA200 | 3.5146 | Buy | 3.5095 | Buy |
Source: Investing (27.07.2026)
Pivot Points
| Name | S3 | S2 | S1 | Pivot | R1 | R2 | R3 |
| Classic | 5.112 | 5.518 | 5.886 | 6.292 | 6.66 | 7.066 | 7.434 |
| Fibonacci | 5.518 | 5.8137 | 5.9963 | 6.292 | 6.5877 | 6.7703 | 7.066 |
| Camarilla | 6.0412 | 6.1121 | 6.1831 | 6.292 | 6.325 | 6.3959 | 6.4669 |
| Woodie | 5.093 | 5.5085 | 5.867 | 6.2825 | 6.641 | 7.0565 | 7.415 |
| Demark | - | - | 5.702 | 6.2 | 6.476 | - | - |
Source: Investing (27.07.2026)
How Copper Price Forecasts Are Built, and How Accurate They Are
Copper price forecasts combine three inputs: technical analysis of historical price cycles on weekly and monthly timeframes; fundamental supply-demand modelling using ICSG production data and S&P Global's mine-level project pipeline; and macroeconomic scenario weighting of variables such as US dollar strength, oil prices, China's manufacturing PMI, and the Federal Reserve's rate path. These projections represent each provider's best analytical judgement at the time of publication and are updated regularly. As with any commodity forecast, actual prices can and do diverge from projected ranges, particularly around geopolitical shocks. Long-range forecasts (2030 and beyond) are inherently wider and less precise than near-term monthly tables, which is a feature of honest forecasting, not a weakness.
What Drives Copper Prices: Supply, Demand and the Energy Transition
Copper is often called "Dr. Copper" because its price closely tracks global economic activity. JPMorgan estimates a copper demand beta of approximately 1.2x to global GDP, meaning the metal's price movements act as a real-time barometer of industrial health. On the supply side, structural constraints are the dominant theme. Mine disruptions such as force majeure events at major South American and Indonesian operations, declining ore grades that raise production costs, and a pipeline of new supply that is overwhelmingly brownfield rather than greenfield (new mines take 10–15 years to develop) all limit how quickly miners can respond to price signals. S&P Global projects a cumulative copper concentrate deficit persisting through 2036 as a result.
On the demand side, China accounts for roughly 60% of global copper consumption, and its buying patterns — inventory destocking when prices are high, aggressive restocking on dips — create a natural price floor. Layered on top is the energy transition: a standard electric vehicle uses roughly 2.5–4x more copper than a comparable combustion-engine car, offshore wind turbines require up to 9.5 tonnes of copper per megawatt of capacity, and grid modernisation and AI-driven data-centre buildouts are adding a further, still-underappreciated source of structural demand. Copper recycling currently covers around 35% of supply and is growing, but most forecasters agree it is not expanding fast enough to close the projected gap on its own.
Key Risks: Geopolitics, Oil Prices and the US Dollar
The clearest near-term risk to the copper bull case is a demand shock transmitted through oil prices: JPMorgan's framework estimates that every 10% oil-price increase from a supply shock dampens global GDP by roughly 0.16%, which — given copper's 1.2x demand beta to GDP — translates into a measurable drag on copper consumption growth. A sustained Brent price near $110/bbl, for example, could strip more than a percentage point off annual copper demand growth. Section 232 tariff reviews on copper and copper-derivative products add a further layer of policy uncertainty that can move prices sharply on announcement days. Finally, copper prices historically move inversely with the US dollar: a stronger DXY makes dollar-priced copper more expensive for non-dollar buyers, which is why Federal Reserve policy and dollar strength are among the most closely watched near-term indicators for copper traders.
Institutional Outlook
JPMorgan
JPMorgan analysts, including commodities strategists Gregory Shearer and Dominic O'Kane, have highlighted global visible copper inventories near 1.5 million tonnes in 2026 and a medium-term technical support zone around $11,100–$11,200/mt (roughly $5.04–$5.08/lb). JPMorgan's historical analysis also notes that copper prices have typically troughed around 25% below their prior peak during major macroeconomic shocks, a useful reference point for position sizing rather than a prediction of the next move.
S&P Global
S&P Global's mine-level supply research is the primary source behind the market's structural deficit narrative, projecting a cumulative copper concentrate shortfall that persists through 2036 as brownfield expansions fail to offset declining ore grades and limited new mine development. S&P Global also tracks rising all-in sustaining costs (AISC) across the global cost curve, noting that cost inflation has effectively reset the long-term incentive price required to bring new copper supply to market.
How to Trade or Invest in Copper
This section is educational and does not constitute personalised financial advice. Different strategies suit different investor profiles and risk tolerances. Copper exposure is available through several vehicles: CFDs on HG/USD futures, which track the CME's 25,000-lb copper contract and allow both long and short positioning with leverage of up to 30:1; commission-free investment in real shares of copper-mining companies, where stock prices typically move at an amplified multiple of the underlying copper price; and diversified copper-focused ETFs. Before entering a position, it is worth stress-testing return assumptions by applying the forecast ranges above to your intended entry price and holding period, and accounting for any margin or expense-ratio costs associated with your chosen vehicle. Because copper can move 5–10% in a single week during periods of macro stress, position sizing that accounts for a potential 25–30% drawdown — in line with JPMorgan's historical trough analysis — is a reasonable starting discipline.
Is Copper a Good Investment in 2026?
Whether copper is a good investment in 2026 depends on time horizon: near-term forecasts show a fairly balanced range of outcomes for the rest of the year – WalletInvestor targets a year-end close of $6.54/lb (+12.7% from its year-open) while LongForecast projects $6.49/lb (+2.4% from current levels) – while the structural case for the 2030s, driven by the energy transition and a persistent supply deficit, points considerably more one-sided toward higher prices, with LongForecast projecting $13.54/lb by 2030 and Traders Union projecting $8.30/lb by the same year, according to both WalletInvestor's near-term models and long-range supply analysis.
As with any commodity, the path will not be linear, and near-term volatility from Fed policy, tariffs, and geopolitical events can diverge meaningfully from the long-term trend. Trading CFDs with leverage can be risky and can lead to losing all of your invested capital.
FAQ
How high will copper go in 2026?
WalletInvestor projects a 2026 range of roughly $5.70–7.06/lb with a year-end close near $6.54, while LongForecast's model sees prices reaching a November peak of $6.92/lb before closing the year at $6.49. Both models frame 2026 as a year in which near-term macro headwinds partially offset an underlying structural supply deficit, with the current price of $6.35/lb sitting broadly in line with consensus year-end targets.
What is the best way to invest in copper?
Copper prices are driven primarily by four factors: global economic growth (copper carries a GDP demand beta of roughly 1.2x), supply constraints from ageing mines and declining ore grades, accelerating demand from electric vehicles and renewable energy infrastructure, and monetary policy, since a stronger US dollar and higher interest rates typically weigh on copper by raising its cost for non-dollar buyers and dampening industrial demand.
How will the global energy transition impact long-term copper prices?
Electric vehicles use roughly 2.5–4x more copper than combustion-engine cars, and offshore wind turbines require up to 9.5 tonnes of copper per megawatt, adding structural demand on top of traditional construction and electronics use. S&P Global projects this will contribute to a cumulative copper concentrate deficit persisting through 2036, a core reason most long-range forecasts - including LongForecast's projection of $13.54/lb by 2030 - point toward higher prices by 2030-2040 despite near-term volatility.
Disclaimer: The information in this article is not intended to be and does not constitute investment advice or any other form of advice or recommendation of any sort offered or endorsed by Libertex. Past performance does not guarantee future results.
Why trade with Libertex?
- Get access to a free demo account free of charge.
- Enjoy technical support from an operator 5 days a week, from 9 a.m. to 9 p.m. (Central European Standard Time).
- Use a multiplier of up to 1:30 (for retail clients).
- Operate on a platform for any device: Libertex and MetaTrader.