

The 10 best MetaTrader 4 indicators for your trading in 2026
Prepared by the Libertex team
Content reviewed internally in accordance with regulatory standards.
MT4 indicators are mathematical calculations based on price, volume and time data. They serve as visual aids to support trading decisions within technical analysis.
Choosing the right MT4 indicators can make a significant difference when analysing price movements. The MetaTrader 4 platform provides access to numerous technical indicators that help identify market trends and potential entry signals. This article covers the ten most important MT4 indicators for technical analysis in 2026 — from MACD and RSI to Bollinger Bands — and how to use the best indicators for MetaTrader 4 to spot trends. The aim is to provide a comprehensive overview of how these tools work, their settings, and how they can be used.
What are MT4 indicators, and why are they important?
MT4 indicators are mathematical tools that process price data on the MetaTrader 4 platform and convert it into visual trading signals. These technical indicators form the foundation of technical analysis and make it possible to examine price movements systematically. Unlike simply watching price action, MT4 indicators provide objective data points that can help interpret market moves.
The MetaTrader 4 platform comes with over 30 pre-installed technical indicators as standard. These can be displayed directly on the price chart or in separate windows with their own scale. A basic distinction is made between indicators plotted directly on the chart — such as moving averages — and those shown in a separate window, such as MACD or RSI.
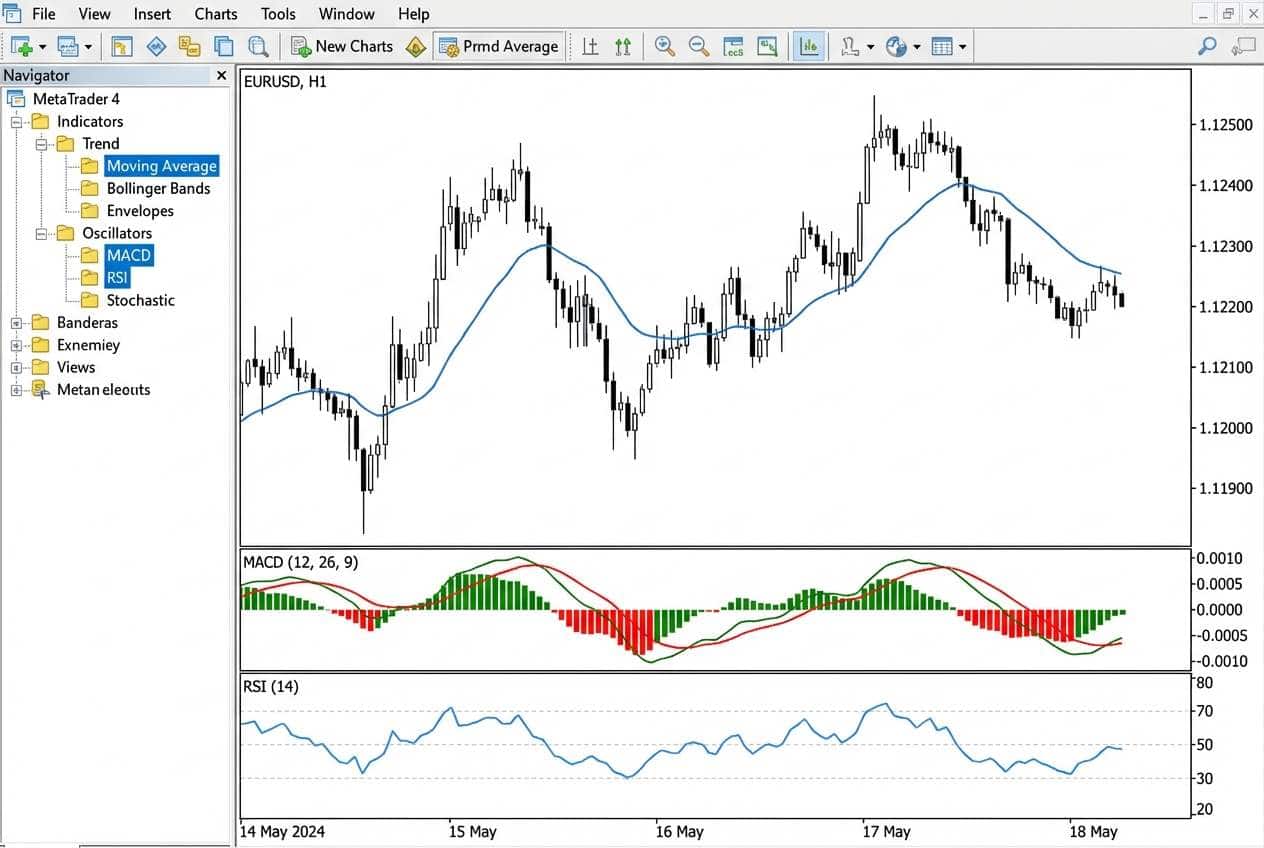
The 5 main categories of MT4 indicators
MT4 indicators can be divided into five main categories, each covering different aspects of market analysis:
- Trend indicators: Identify the prevailing market direction. Examples include moving averages, MACD and the Average Directional Index (ADX).
- Oscillators: Measure momentum and indicate overbought/oversold conditions. RSI, the Stochastic Oscillator and Williams %R fall into this category. Oscillators provide particularly valuable signals in sideways markets.
- Volume indicators: Analyse trading volume to confirm price moves. On-Balance Volume and the Money Flow Index are included here.
- Volatility indicators: Measure the extent of price fluctuations. Bollinger Bands and Average True Range (ATR) quantify volatility.
- Custom indicators: Custom-built indicators programmed in MQL4 to meet specific analysis requirements.
MT4 vs MT5 indicators: the key differences
MetaTrader 4 and MetaTrader 5 are both products from MetaQuotes Software, but they differ in several key respects. MT4 indicators are created in the MQL4 programming language, while MT5 is based on MQL5. These differences have practical implications: indicators are not easily interchangeable between the platforms.
Feature | MetaTrader 4 | MetaTrader 5 |
Programming language used | MQL4 | MQL5 |
Pre-installed indicators | 30+ | 38+ |
Time Frame | 9 | 21 |
Order types | 4 | 6 |
Indicator compatibility | MT4 only | Partially convertible |
The MetaTrader 4 platform remains relevant thanks to the large library of available MT4 indicators and its established community.
Installing and using custom MT4 indicators
Custom indicators significantly expand the capabilities of the MetaTrader 4 platform. Installation takes just a few steps:
- Download the indicator file (.mq4 or .ex4) from the MQL5 Marketplace or another trusted source — MetaTrader indicator free and paid options available
- In MetaTrader 4, click “File” → “Open Data Folder”.
- Open the “MQL4” folder and then “Indicators”.
- Copy the downloaded file into this folder.
- Restart the platform.
After restarting, the custom indicators will appear in the Navigator window under “Custom Indicators”. In addition to indicators, Expert Advisors (EAs) can also be programmed in MQL4 to operate on indicator signals — often used to generate MetaTrader 4 trading signals. The quality of custom indicators from the MQL4 Marketplace varies—reviews and comments from other users can help guide your choice.
Trend indicators for MetaTrader 4 (MT4)
Trend indicators are among the most widely used MT4 indicators and help identify the prevailing market direction. Key examples include moving averages and MACD.
MACD: the trend-following and momentum indicator
MACD (Moving Average Convergence Divergence) combines elements of trend indicators and oscillators. It is based on the difference between two exponential moving averages—by default, with periods of 12 and 26. The default MACD settings in MetaTrader 4 are:
- Fast EMA: 12 periods
- Slow EMA: 26 periods
- Signal line: 9 periods
Source: TradingView (03/02/2026)
The MACD histogram visualises the difference between the MACD line and the signal line. Signal-line crossovers occur when the MACD line crosses the signal line. A crossover from below to above is interpreted as a potentially bullish signal, while a crossover from above to below is seen as potentially bearish.
Spotting divergences: if price makes new highs but MACD prints lower highs, this is known as bearish divergence. The opposite—rising MACD lows while price lows fall—forms a bullish divergence.
Moving-average crossover strategies
Moving averages smooth price data and make trends easier to see. In technical analysis, several averages with different periods are often combined. A moving-average crossover occurs when a short-term average crosses a long-term average.
Commonly used period settings for moving averages:
- Short-term: 9, 10 or 20 periods
- Medium-term: 50 periods
- Long-term: 100 or 200 periods
Source: TradingView (03/02/2026)
A golden cross refers to the situation where a short-term moving average crosses above a long-term moving average from below. A death cross describes the opposite scenario. These signals are often used in combination with other MT4 indicators for confirmation.
The distinction between a Simple Moving Average (SMA) and an Exponential Moving Average (EMA) is important: EMAs give more weight to recent prices and react faster to price changes.
MetaTrader 4 (MT4) oscillators for entry and exit signals
Oscillators are MT4 indicators that fluctuate between fixed values and indicate overbought/oversold conditions. Unlike trend indicators, they are particularly suited to sideways markets and identifying potential trend reversal points.
The RSI indicator: strategies for precise entry signals on MetaTrader 4
RSI (Relative Strength Index) is one of the best-known oscillators on the MetaTrader 4 platform. It measures the strength of upward moves versus downward moves and ranges on a scale from 0 to 100.
Standard RSI interpretation:
- Above 70: overbought – possible correction
- Below 30: oversold – possible rebound
Source: TradingView (03/02/2026)
Advanced RSI applications go beyond these classic levels. In strong trending markets, the indicator can remain in overbought or oversold territory for an extended period. Some analysts adjust the thresholds accordingly—for example, 80/20 in trending markets or 60/40 as a neutral zone.
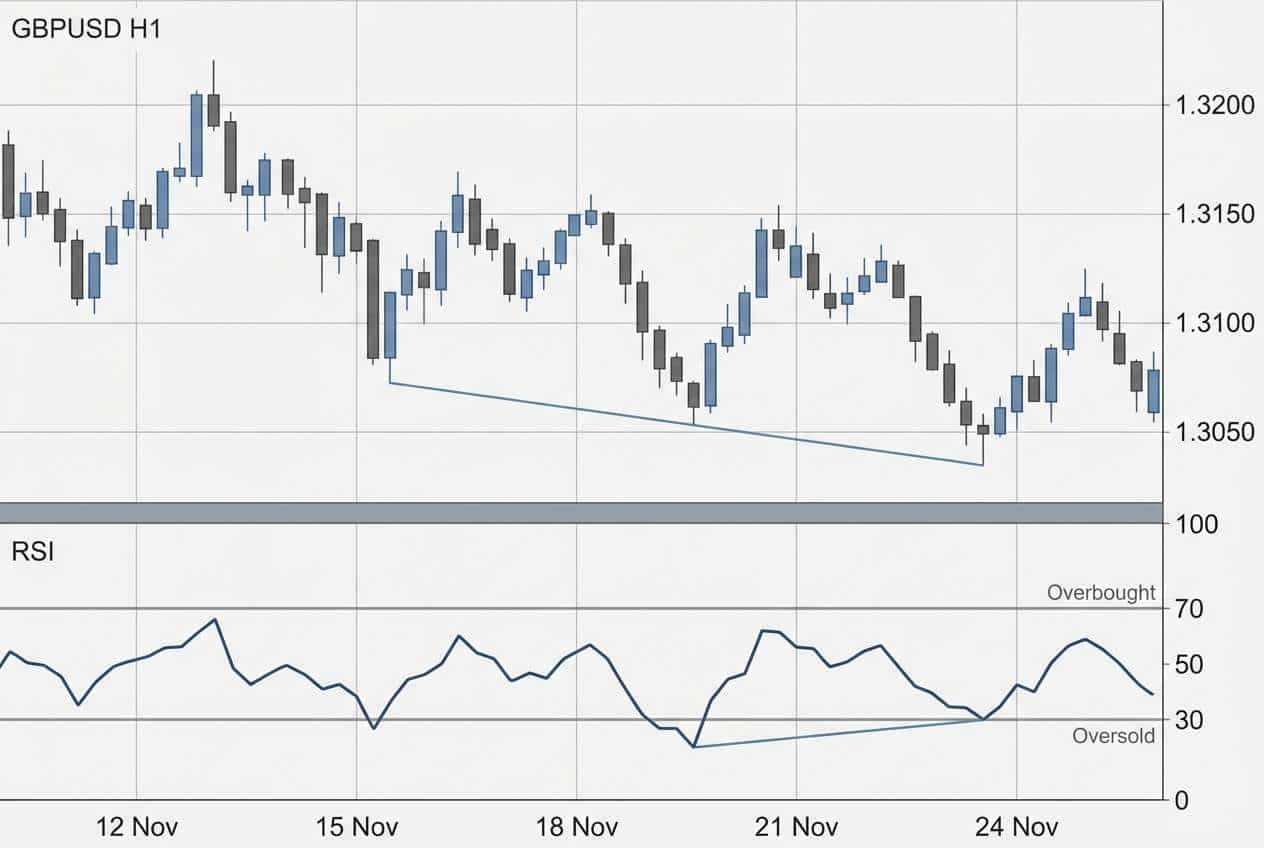
RSI divergence: if price makes new lows but RSI shows higher lows, a bullish divergence forms. This setup can indicate that downward momentum is fading.
Money Flow Index (MFI): combining volume and price
The Money Flow Index is a volume-weighted oscillator that takes both price and volume data into account. Unlike RSI alone, MFI incorporates trading volume in its calculation, which is why some analysts refer to it as a “volume-weighted RSI”.
The Money Flow Index first calculates the “typical price” (the average of the high, low and close) and multiplies it by volume. The scale ranges from 0 to 100, where:
- Above 80: potentially overbought
- Below 20: potentially oversold
Source: TradingView (03/02/2026)
For CFD trading, note that for some instruments, volume data may only represent tick volume and not the actual traded volume. However, leveraged CFD trading can be risky and can lead to the loss of all your invested capital.
Volume indicators for MT4: the underrated helpers
Volume indicators are among the least noticed MT4 indicators, but they provide important information for confirming price moves. They analyse trading volume to assess the strength of price movements.
On-Balance Volume (OBV): the classic volume indicator
On-Balance Volume cumulatively totals volume: volume is added on rising closes and subtracted on falling closes. The resulting OBV indicator moves in line with price when price and volume movements agree.
The main use of On-Balance Volume is identifying divergences:
- Rising price with falling OBV: possible weakness in the uptrend
- Falling price with rising OBV: possible accumulation phase
The On-Balance Volume indicator can also be used to confirm breakouts: a breakout from consolidation accompanied by rising OBV is considered technically more robust than a breakout without volume support.
Accumulation/Distribution Line: combining volume and price range
The Accumulation/Distribution Line (A/D line) expands on the concept of On-Balance Volume by considering not only the direction of the close, but also where the close sits within the trading range. This enables a more nuanced analysis of money flow.
Compared with On-Balance Volume, the A/D line weights volume based on whether the close is nearer the period’s high or low. This can help identify institutional buying or selling pressure.
Volatility indicators for MetaTrader 4 (MT4): spotting opportunities in volatile markets
Volatility indicators measure the intensity of price fluctuations. Bollinger Bands and Average True Range (ATR) are the best-known in this category and are often counted among the MetaTrader 4 best indicators for volatility.
Using Bollinger Bands effectively
Bollinger Bands consist of three lines: a middle band (usually a 20-period SMA) and an upper and lower band, each set two standard deviations away from the middle band. The default settings are:
- Period: 20
- Standard deviation: 2
Source:TradingView (03/02/2026)
The width of the bands automatically adjusts to volatility. In quiet market phases, the bands contract (a Bollinger Band squeeze); in volatile phases, they widen.
Uses of Bollinger Bands:
- Measuring volatility: Narrow bands signal low volatility—often a precursor to larger moves.
- Dynamic support/resistance: The bands can act as flexible support and resistance zones.
- Combining with oscillators: When price touches the upper band, an RSI in overbought territory can reinforce the interpretation.
Combining Bollinger Bands with momentum oscillators such as RSI or the Stochastic Oscillator can refine analysis and reduce potential false signals.
MetaTrader 4 (MT4) indicator setups for technical analysis
Combining multiple MT4 indicators can enhance technical analysis. However, it’s important to avoid redundant indicators—i.e., indicators that essentially provide the same information.
A balanced setup could include, for example:
- A trend indicator (moving averages or MACD)
- An oscillator (RSI or Stochastic Oscillator)
- A volatility indicator (Bollinger Bands)
- Optionally, a volume indicator (On-Balance Volume)
The MetaTrader 4 platform allows you to save indicator templates so that preferred configurations can be quickly applied to different charts. For a more comprehensive analysis, the MetaTrader 4 platform also offers additional features and some of the MetaTrader 4 best tools.
Avoiding common mistakes when using MT4 indicators
When working with MT4 indicators, recurring mistakes can occur that may reduce the quality of technical analysis:
- Indicator overload: Too many indicators on one chart can generate conflicting signals and lead to analysis paralysis.
- Over-optimisation: Adjusting indicator parameters to historical data (curve fitting) can lead to unrealistic expectations.
- Ignoring context: MT4 indicators behave differently across market phases—trend indicators can produce numerous false signals in sideways markets.
- Neglecting price structure: Indicators are derived data—the underlying price structure remains the primary source of information.
- Lack of confirmation: A single signal without confirmation from other factors carries higher risk.
Markets can be unpredictable, and past price performance is no guarantee of future results.
Conclusion: the path to using MT4 indicators
MT4 indicators are valuable tools within technical analysis that can help with the systematic assessment of price movements. From MACD and RSI to Bollinger Bands and volume indicators—each indicator has specific strengths and areas of application.
The MetaTrader 4 platform gives both beginners and experienced users access to a wide range of MT4 indicators. The ability to extend it with custom indicators and MQL4 programming opens up further options for individual customisation.
Using fewer indicators—provided you understand them well—can often be more useful than relying on a large number of analysis tools. Developing an understanding of how your chosen MT4 indicators work and how they behave across different market phases is the basis for sound use.
Markets can be unpredictable, and past price performance is no guarantee of future results.
Frequently asked questions
What are technical indicators for MetaTrader 4?
MT4 indicators are mathematical calculations based on price, volume and time data that generate visual signals to support trading decisions. The MetaTrader 4 platform includes over 30 pre-installed technical indicators.
Which MT4 indicators are suitable?
Classic indicators such as moving averages are suitable for identifying trends, RSI for measuring overbought/oversold conditions, and Bollinger Bands for measuring volatility. These MT4 indicators are well-documented and intuitive to understand.
How do you install an indicator in MetaTrader 4?
Installation is done via “File” → “Open Data Folder” → “MQL4” → “Indicators”. Copy the downloaded .mq4 or .ex4 file into this folder. After restarting MetaTrader 4, the indicator will appear in the Navigator.
How does MACD work as an MT4 indicator?
MACD calculates the difference between two exponential moving averages (12 and 26 periods by default). The signal line (a 9-period EMA of the MACD) and the MACD histogram complement the analysis. Signal-line crossovers and divergences are the main signals.
How can you combine multiple MT4 indicators?
A useful combination avoids redundancy: a trend indicator (MACD or moving averages), an oscillator (RSI) and a volatility indicator (Bollinger Bands) complement each other. Templates in MetaTrader 4 allow you to save configurations.
What are the differences between built-in and custom MT4 indicators?
Built-in MT4 indicators are included in MetaTrader 4 as standard and are developed by MetaQuotes. Custom indicators are programmed by the community in MQL4 and offer specialised functions, but require manual installation. For a best MetaTrader 4 indicators free download, get the platform.
How reliable are MT4 indicators for trading decisions?
MT4 indicators provide objective data points, but they are not a guarantee of specific market developments. They should be understood as part of comprehensive technical analysis, not as the sole basis for decisions. Markets can react unpredictably.
What is the Money Flow Index (MFI) and how is it used in MT4?
The Money Flow Index is a volume-weighted oscillator that combines price and volume data. Values above 80 are considered potentially overbought, and below 20 are considered potentially oversold. It adds a volume dimension to price-based oscillators.
How do you download MetaTrader 4 (MT4) indicators and add-ons?
The official MQL5 Marketplace offers both free and paid MetaTrader 4 (MT4) indicators. After downloading, the file is placed in the MQL4 Indicators folder of your MetaTrader 4 installation and is available after restarting.
What are the 10 MetaTrader 4 technical indicators?
MT4 indicators include: MACD, RSI, moving averages (SMA/EMA), Bollinger Bands, the Stochastic Oscillator, Average True Range, On-Balance Volume, Money Flow Index, Ichimoku Kinko Hyo and Parabolic SAR.
Disclaimer: The information in this article is not intended to be and does not constitute investment advice or any other form of advice or recommendation of any sort offered or endorsed by Libertex. Past performance does not guarantee future results.
Why trade with Libertex?
- Get access to a free demo account free of charge.
- Enjoy technical support from an operator 5 days a week, from 9 a.m. to 9 p.m. (Central European Standard Time).
- Use a multiplier of up to 1:30 (for retail clients).
- Operate on a platform for any device: Libertex and MetaTrader.