Technical Analysis
Prepared by the Libertex team
Content reviewed internally in accordance with regulatory standards.
It wouldn't be an exaggeration to say that technical analysisis the most popular analytical method in the financial market. Many new traders follow strategies based on the results of this form of analysis. However, not everyone truly understands what technical analysis is, what it's based on, or why this trading strategy is sometimes successful and sometimes not. You'll learn about the different types of technical expertise, advantages and disadvantages while reading this article. It will also help you decide whether or not to use this method in your trading strategy and how to do so correctly.
Definition of Technical Analysis
Technical analysis predicts price changes in the future based on the analysis of price changes in the past. Technical analysis consists of the study of charts and the identification of patterns. Mathematics and statistical calculations are often used to convert models and patterns formed in the chart into forecasts to determine which one can be opened for trading.
History of Technical Analysis
It's believed that technical analysis was first implemented in Japan during the 18th and 19th centuries. Japanese rice merchants started using charts to track and analyse product prices.
Later, Western countries called these charts 'Japanese candlesticks'.
At the end of the 19th and beginning of the 20th century, an American journalist and researcher, Charles Dow, started the practice now known as classic technical analysis. He published a series of articles about prices on the securities market that later became a fundamental component of the Dow Theory.
In the middle of the 20th century, the development of computer technologies allowed the first indicators to appear. The indicator calculations were created automatically, which made it possible to apply to the graph the results of complex formulas. Since then, computer analysis has developed very fast, indicators began improving, and new tools were found. Candlestick and graphic analyses kept their initial conception, although they're still quite popular among traders.
Postulates of Technical Analysis
There are several main postulates of technical analysis that Charles Dow made (or his followers on the basis of his articles). They represent the very essence of technical expertise and explain why it should even work in the first place.
Price Considers Everything
This postulate rejects the significance of the fundamental analysis. Price considers everything means that there's no point in tracking down all economic and political news; pay attention to big events. Everything that could affect the price is already taken into account. That's why the priority is to study charts and indicators.
Price Movement Delivers the Trend
Random price fluctuations form the trends. Each timeline represents the directional price movement (ascending and descending trends), or flat one, fluctuations in the horizontal range. Even though the tendencies break and change sooner or later, it's believed that the probability of the continuation of the current trend is higher than the probability of its change.
History Repeats Itself
This postulate explains why technical analysis works in general. It's based on the following idea: let's say that you formatted a certain pattern on the graph, which resulted in the price moving in a particular way. The next time the same pattern occurs, it's likely that the price will behave similarly. At least, the probability of it will be much higher than the probability of a different scenario.
People change the market, and their actions can be explained by psychology. Technical analysis allows seeing market trends in a graphic form.
The main problem is that the probability of an absolutely identical situation occurring is extremely rare. That is why analysing the patterns is a priority. Often a trader has to decide whether the situation on the graph fits the pattern or not, whether a trade should be opened.
Technical Analysis Tools
Let's take a look at comprehensive technical analysis tools used in contemporary internet trading.
Candlestick Patterns
Candlestick analysis is believed to be the very first subtype of technical analysis, its ancestor. In contemporary candlestick analysis, trade is conducted on the patterns formed by one or several candles.
The main patterns of candlestick analysis:
- External bar
- Internal bar
- Morning/Evening star
- Hummer/Hangman
- Doji
- Gap, etc.
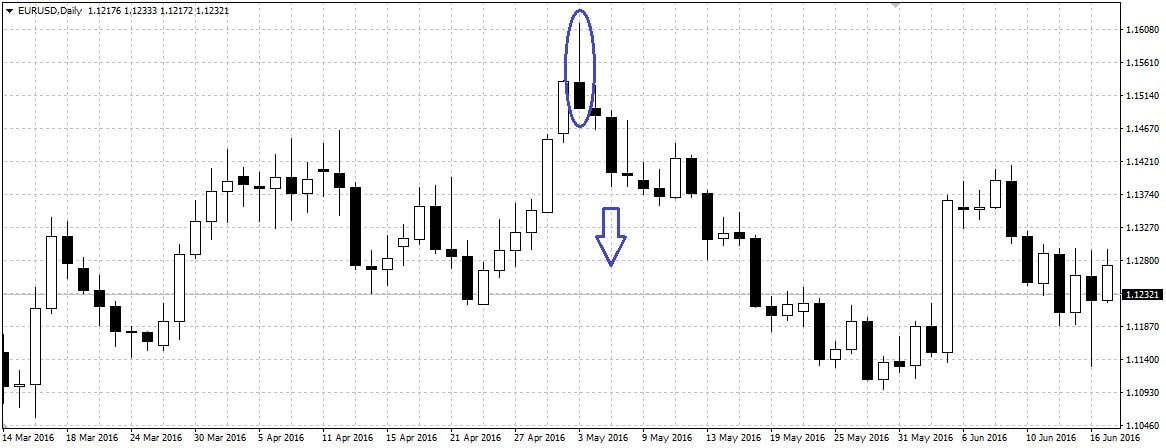
Each pattern informs a trader that the price will likely move in a particular direction. For example, the Hangman pattern on the graph indicates that the price is more likely to turn down (the pattern forms at the top of the ascending trend). Hence, such a pattern gives the trader a signal to sell.
Trend Lines
The trend line is the basic instrument of graphic analysis, which helps to reveal the current trend direction. It is defined first visually, and then the relevant line is put on.
- If the trend is ascending, the line is held under it and attached to local lows.
- If the trend is descending, the line is held above and attached to local highs.
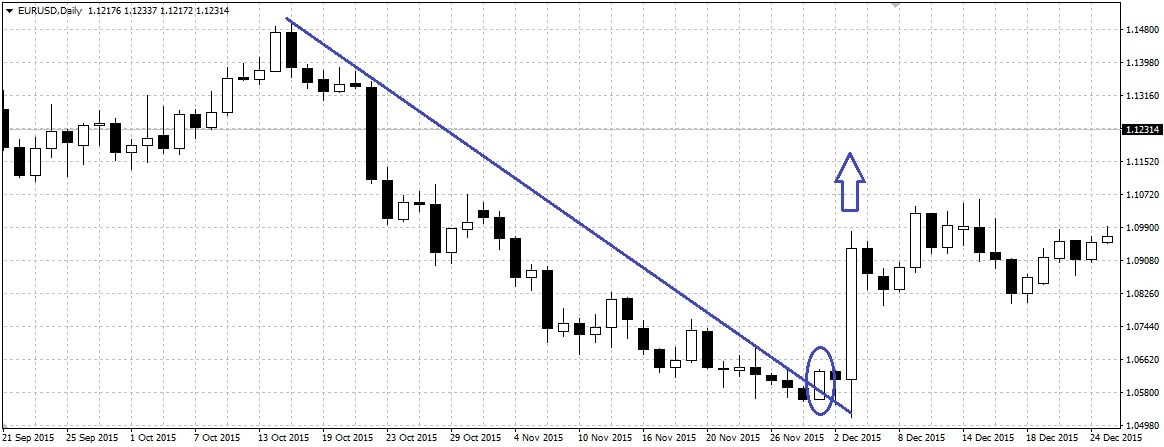
The most effective way to trade using trend lines is to trade on breakouts.
- If the price penetrates the descending trend's line, bottom-up, then one should open a trade to buy.
- If the price is penetrating the ascending trend's line, top to bottom, one should open a trade to sell.
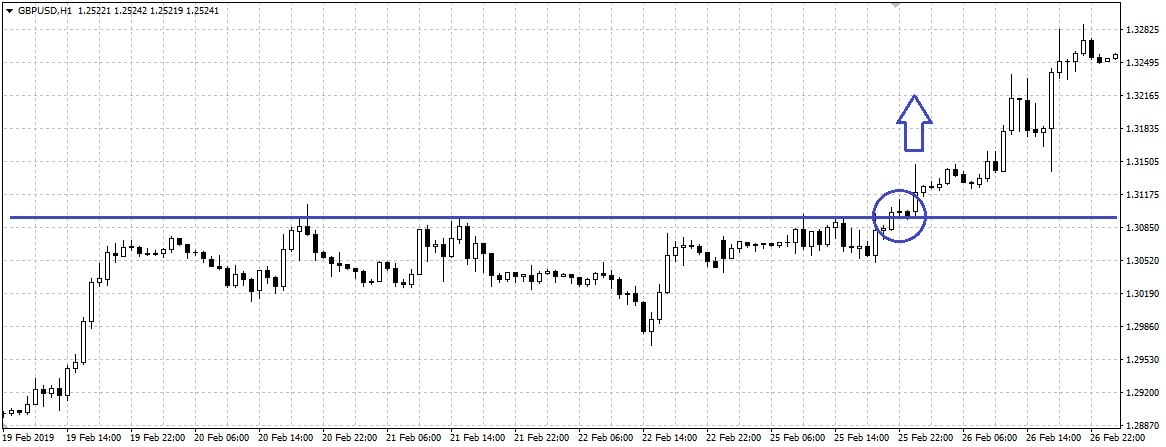
Support and Resistance Levels
Support and resistance levels are quite similar to the trend lines. The only difference is that the levels of S&R are horizontal. The support is built on the local lows, and the resistance is based on local highs. Breaking past the support levels signals that it's time to open a trade to sell, while breaking past the resistance level signals that it's the right time to buy.
Figures of Graphic Analysis
Graphic analysis is one of the largest components of technical analysis. It's based on studying the figures created by the fluctuations in the price chart.
There are three types of figures:
- Turnaround figure (head and shoulders, double top/double bottom). If you see these figures, then the trend is very likely to change, and you should open trades in the opposite direction.
- Figures of the trends' continuation (flag, pennant). The formation of these figures signals that there's a high possibility that the trend will continue, and you should open trades in its direction.
- Uncertainty figures (triangles and others) mean that the market could move in any direction, and one should abstain from the trade.
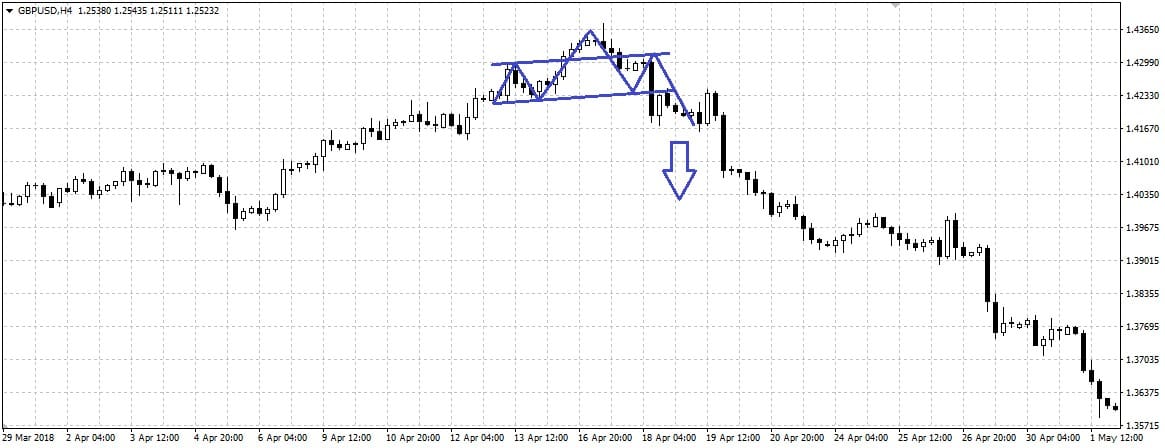
According to the type of figure formed on the chart, the trader will open a trade in one direction or another or even stop trading for the moment.
Indicators
Technical analysis indicators are automatic tools that spare the trader the necessity to analyse the graph and make a decision about opening the trade.
The indicator gives you a clear sign to open the trade.
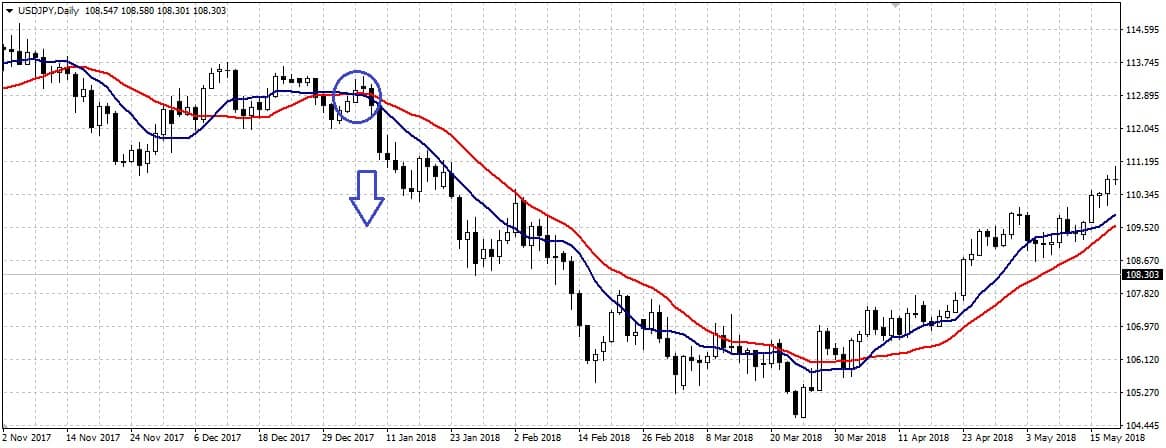
Each indicator is automatically plotted according to a certain formula. For example, the most popular and basic indicator, moving average, is just the average value of the price indicators during a certain period. A moving average, with a period of 10, is the arithmetic mean of the price for the last 10 time marks.
Indicators can be the following:
- Osma
- Oscillators
- Volume indicators
- Informational
Usually, the signal for opening a trade is usually formed by the interaction between the indicators, the price or other indicators.
Fundamental vs Technical Analysis
It's hard to tell what type of analysis – technical or fundamental – is more effective or popular. Each of them has its own advantages.
Fundamental analysis is based on studying the news, reports and other external factors that can affect the price.
Surely, followers of this method don't agree with the idea that "price considers everything". They believe that technical analysis is looking at the past (and history doesn't always repeat itself), while fundamental analysis is looking at the future.
Though one thing they have in common: even the most thorough analysis of the fundamental data doesn't guarantee you a 100% correct prediction of the price changes. For example, a positive quarterly company report, with the revenues significantly exceeding expectations, may not raise the price of the company's shares if the market participants think that it's already high.
Novice traders may find it challenging to choose the type of analysis to use. On the one hand, the systems of technical analysis are often absolutely automated. The trader just has to notice the signal in time and open a trade in the proper direction. On the other hand, newbies look for strategies that don't have indicators (they consider those to be too complicated). And the fundamental analysis doesn't use these tools except for several information panels.
Technical Analysis in Forex
In forex trading, technical analysis has an even better position than fundamental analysis. This is due to certain facts of the fundamental analysis that are relevant for the stock market (like a company's quarterly reporting or dividend info) but aren't suitable for the forex market. Still, the techniques used in technical analysis can be applied to both the stock and forex markets.
The classic strategy of technical forex trading consists of several indicators, which give signals and function as a filter for each other.
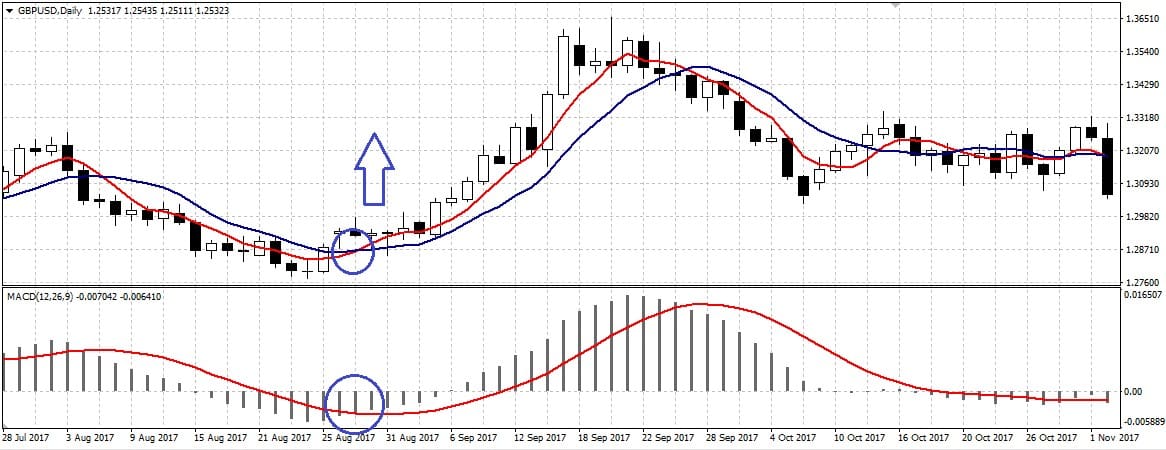
For example, let's have a look at the forex trading strategy using the MACD indicator and two moving averages (MAs).
You can open a strategy transaction when you meet the following requirements:
- If the fast moving average (5-period) crosses the slow (10-period) from top to bottom and the MACD histogram crosses the MACD line in the same direction, a sell trade is opened.
- If the fast moving average crosses the slow one from the bottom up and the MACD histogram crosses the line from the bottom up, a buy trade is opened.
This is an example of a simple forex strategy. Some trading strategies are based on the readings of five or more indicators and include tools for the automatic recognition of the figures of graphical analysis. Complex systems aren't always better than simple ones, although well-known strategies are rarely profitable. Successful forex trading requires developing your own unique strategy.
Conclusion
Every trader should know the basics of technical analysis, even if they don't plan on building their own trading strategy using technical expertise. This method allows for a better understanding of the market and its participants.
To practice technical analysis, a trader needs a trading system. One of the variants for this is using the Libertex platform which offers trading in CFDs as well as real stocks. Traders may train there using a demo account until they're ready to start trading for real. Besides, the platform has all of the necessary tools and indicators to complete a high-quality technical analysis of the charts.
Disclaimer: The information in this article is not intended to be and does not constitute investment advice or any other form of advice or recommendation of any sort offered or endorsed by Libertex. Past performance does not guarantee future results.
Why trade with Libertex?
- Get access to a free demo account free of charge.
- Enjoy technical support from an operator 5 days a week, from 9 a.m. to 9 p.m. (Central European Standard Time).
- Use a multiplier of up to 1:30 (for retail clients).
- Operate on a platform for any device: Libertex and MetaTrader.