

Netflix Stock Price Prediction: Should You Buy, Sell or Hold NFLX?
Prepared by the Libertex team
Content reviewed internally in accordance with regulatory standards.
Netflix has been leading in the streaming video market for a few years now. Everything seems to be working in favour of the NFLX stock. In addition to licensed movies and TV series, the company entered the content production market, boosting its profits significantly. The increased demand for online entertainment also has investors bidding up the stock.
If you want to trade Netflix CFDs based on its market performance, you can sign up with Libertex and access NFLX alongside thousands of other instruments.
Is this positive sentiment reflected in the Netflix stock price forecast? Let's find out.
Key Takeaways
- Wall Street analyst consensus for NFLX in 2026 points to an average 12-month price target of approximately $115.74, with a high of $151.40 and a low of $80.00, according to TipRanks.
- According to LongForecast, NFLX is expected to close 2026 in the range of $70.70–$108.95, with a projected year-end closing price of $94.39 (+9.7% vs. current levels).
- CoinPriceForecast projects Netflix to reach a mid-year price of $184.00 and a year-end price of $197.80 by 2031, implying a potential gain of +130.0% from current levels.
- WalletInvestor's long-term NFLX forecast for 2031 targets a price of approximately $197.80, representing a +130.0% upside from current trading levels.
Key Updates
- NFLX is currently trading at approximately $86.02, with a market capitalisation of $362.21 billion. The stock is flat (0%) over the past 30 days. Average daily trading volume stands at approximately 35.6 million shares.
- Netflix reported revenue of $12.25 billion in its most recent quarter (Q1 2026), up 16.2% year-over-year. Operating margin reached 32.3%, and EPS came in at $1.23, beating analyst consensus.
- Global paid memberships exceeded 325 million as of Q1 2026. Netflix no longer reports quarterly net subscriber additions. The ad-supported tier reached 190 million monthly active viewers globally, representing an increasing share of new sign-ups.
What Is a Stock?
Before diving into Netflix-specific predictions, it helps to understand what a stock actually is. A stock is a financial instrument representing fractional ownership in a company. When you buy a share of Netflix (ticker: NFLX), you become a part-owner of Netflix, Inc., entitled to a proportional share of its assets and earnings.
Investors earn returns from stocks through two primary mechanisms. First, capital appreciation: if the share price rises from, say, $600 to $750, a holder of 10 shares has gained $1,500. Second, dividends: periodic cash distributions from company profits to shareholders. It is worth noting that Netflix does not currently pay a dividend. Instead, it reinvests earnings into content and growth, making it a pure capital-appreciation play.
Stocks are traded on exchanges during market hours. As we cover in the next section, Netflix is listed on the Nasdaq stock exchange, where it is joined by Apple, Amazon, Alphabet, and Meta. Any investor with a standard brokerage account that supports US equity trading can buy and sell NFLX shares in real time.
Netflix as a Stock Investment: Overview and Nasdaq Listing
Netflix, Inc. (ticker: NFLX) is a publicly traded streaming entertainment company founded in 1997 by Reed Hastings and Marc Randolph as a DVD rental startup. It completed its IPO in May 2002 at $15 per share and has since grown into one of the most-watched stocks on Wall Street. The company's transition from DVD rental to global streaming to original content production is a case study in reinvention, and that capacity for disruption continues to inform its investment thesis today.
NFLX is listed on the Nasdaq stock exchange, the world's second-largest exchange by market capitalisation, known for its concentration of technology and growth companies. Sitting alongside Apple, Amazon, Alphabet, and Meta, Netflix is automatically included in the Nasdaq 100 and S&P 500 indices, meaning passive index funds must hold NFLX shares. This structural institutional demand provides a valuation floor that smaller-cap stocks lack.
For investors interested in the streaming sector's growth, Netflix is the primary bellwether. Its quarterly subscriber figures, average revenue per user (ARPU), and margin trajectory are watched as closely by the market as its headline earnings. We examine these metrics in detail in the performance analysis section below.
NFLX: Company Profile
Netflix Inc is a streaming entertainment service company. It distributes films and TV shows in various genres and languages to over 325 million paid members worldwide. It's by far the biggest company in its niche in the US market.
Stock summary as of 01.06.2026:
- Market cap: 362,210,000,000
- Beta (5Y monthly): Neutral
- PE ratio: 36.1
- Earnings per share:.58
- Revenue (TTM): 45,180,000,000
- Net income: 10,980,000,000
- Volume (24hr): 35,600,000
It's a member of such indices as the Nasdaq 100, Russell 1000, Nasdaq Composite, S&P 500 Communication Services Sector, Russell 3000, S&P 100 and S&P 500.
When the shares of a company showcase such a great performance, it's bound to receive questions over whether such growth is sustainable. We'll try to investigate what factors favour the company and how they impact the Netflix share price forecast.
Netflix Stock Performance Analysis: Key Metrics and Valuation Drivers
Understanding NFLX as a stock requires looking beyond the streaming service and focusing on the metrics investors actually watch. Three analytical lenses matter most.
Subscriber metrics as leading indicators. Netflix does not pay dividends — investor returns depend entirely on share price growth — and its share price is heavily influenced by subscriber trajectory. Net subscriber additions and monthly active users are watched as closely as EPS. When Netflix reported its 2022 subscriber loss, the stock dropped over 35% in a single session, illustrating how directly membership data moves the share price.
Core financial metrics. Revenue growth rate, operating margin expansion, free cash flow, and P/E ratio relative to Nasdaq peers are the primary valuation tools. Netflix is a growth stock that has historically traded at a premium P/E compared to the broader market, reflecting investor expectations of sustained earnings expansion. The company's transition to positive free cash flow was a major inflexion point in its investment story. This signals financial maturity alongside continued growth.
Competitive positioning. Netflix's content spending and its password-sharing crackdown have both affected investor sentiment in meaningful ways. The crackdown, widely expected to hurt subscriber numbers, instead drove a significant acceleration in new sign-ups and ARPU, validating management's strategy and triggering a re-rating of the stock. Netflix is also included in the S&P 500, meaning institutional passive funds must hold it, providing structural demand support. Its earnings reports remain market-moving events watched beyond just streaming sector investors.
Factors That Drive Netflix Stock Prices
When the shares of a company showcase such a great performance, it's bound to receive questions over whether such growth is sustainable. We'll try to investigate what factors favour the company and how they impact the Netflix share price forecast.
Number's Game
As with any company, the higher the key metrics are, the stronger the stock performs. Current quarterly performance data is shown in the Key Updates section above. If the company continues to outperform expectations, Netflix will be well-placed to reap its share of streaming market profit, and, subsequently, the stock will rise.
Differentiation
It's not enough to just be a streaming service these days because the platform needs to offer something consumers can't get anywhere else.
In 2022, Netflix Inc. spent $16.84 billion on content, most of which was for producing originals. The company has continued to prioritise original programming, which means that some of the content libraries will be unavailable on any other streaming platform, bringing more viewers. The NFLX stock price is likely to change along with the public's interest in original content.
Competitor Results
The biggest competitive threat to Netflix is Amazon Prime. Other prominent competitors are Disney+, Max (HBO) and Hulu (although they have much fewer subscribers).
While it may seem counterintuitive to see positive results for Netflix's competitors as positive, there is some truth to that. It signals the ongoing shift from live TV to on-demand streaming. There's room for multiple winners in the current landscape, so Netflix needs to pay close attention to consumer behaviours. This will allow the company to adapt and earn more subscriptions.
Overview of NFLX's Price History
As context for any Netflix share price prediction, let's look at some of the most notable numbers in the stock's performance:
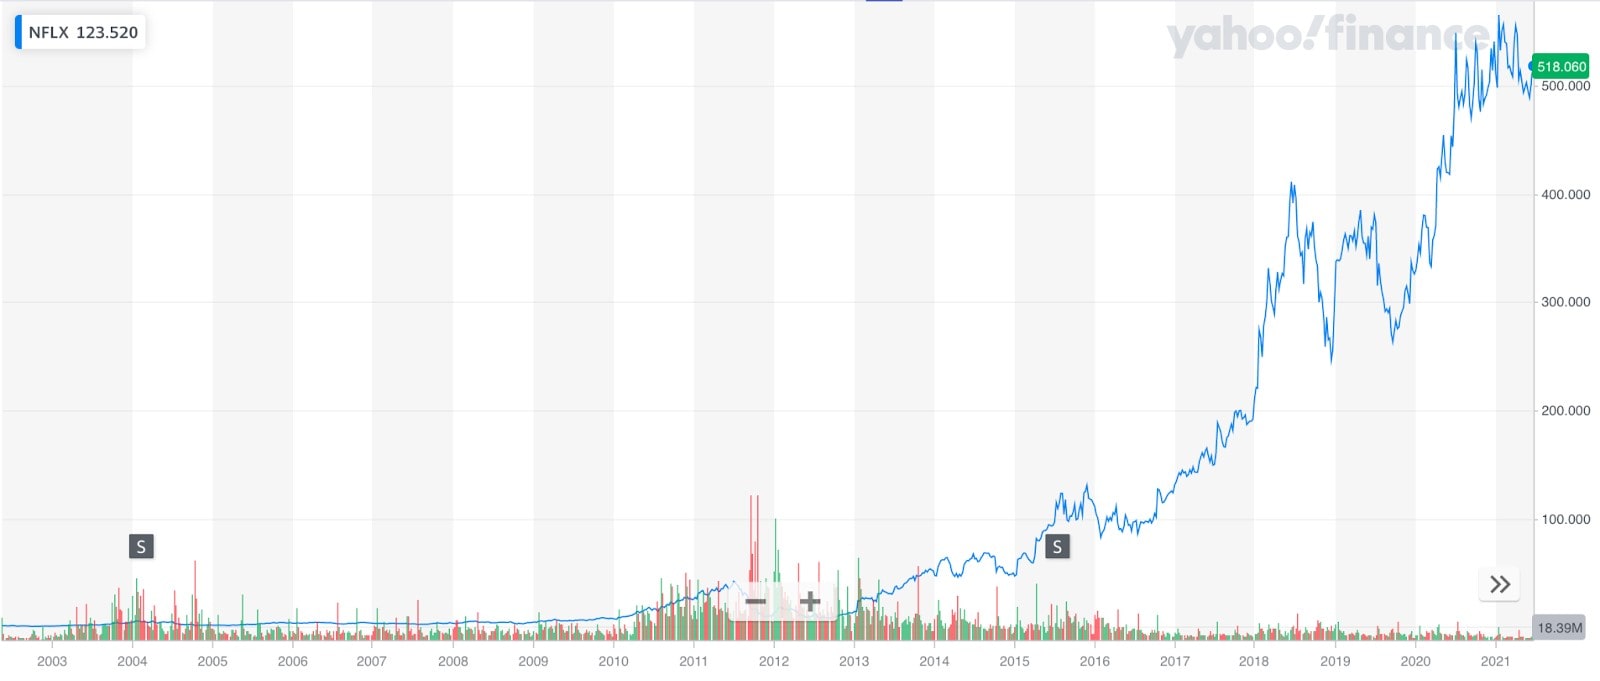
- $15–$60: One of the biggest jumps that happened between 2002 and 2011
- $64: Spike in subscribers after new content deals in 2014
- $118: Netflix premiered its first original film in 2015
- $184: Uptick in international segment and record-breaking revenue in 2017
- $411: New shows and almost non-existent competition in 2018
- $256: Massive decline in subscriptions
- $435: Increased demand for streaming services during the outbreak of the COVID-19 pandemic
- $597: The start of 2022
- $174: In February 2022, NFLX stock started to plummet and dropped significantly by July 2022. The company quietly admitted that streaming competition was getting too tough.
- $294: By the end of 2022, Netflix stock recovered and continued growing in 2023.
- $485–$700+: Through 2024–2025, Netflix staged a sustained recovery, driven by the password-sharing crackdown success, ad-tier growth, and margin expansion.
How Are NFLX Shares Performing Now?
As of 01.06.2026, NFLX is trading at approximately 86.02, -0.39 in the last 24 hours. The stock's all-time high stands at 134.12. Current RSI (50) indicates the stock is Neutral.
Netflix Stock Price Forecast 2026 – LongForecast
According to LongForecast, NFLX is projected to trade in the $70.70–$101.52 range through the end of 2026, with a projected year-end close of $94.39. The model anticipates a summer dip to the low $70s before a recovery rally from September onward, ending the year approximately 10% above current levels.
Month | Min–Max ($) | Close ($) | Change % |
June 2026 | 72.73-93.54 | 80.29 | -6.7% |
July 2026 | 71.21-87.47 | 77.40 | -10% |
August 2026 | 70.70-83.00 | 76.85 | -10.7% |
September 2026 | 76.85-95.45 | 88.38 | 2.7% |
October 2026 | 83.54-98.06 | 90.80 | 5.5% |
November 2026 | 86.48-101.52 | 94.00 | 9.3% |
December 2026 | 86.84-101.94 | 94.39 | 9.7% |
Source: LongForecast (01.06.2026)
Netflix Stock Forecast 2027 – LongForecast
LongForecast's 12-month model for NFLX in 2027 projects a trading range of $87.80–$187.98 across the year, with a December closing price of $174.06 representing a +102.3% move from current levels.
Month | Min–Max ($) | Close ($) | Change % |
January 2027 | 87.80–103.08 | 95.44 | 10.9 |
February 2027 | 88.49–103.87 | 96.18 | 11.8 |
March 2027 | 92.29–108.33 | 100.31 | 16.6 |
April 2027 | 94.70–111.16 | 102.93 | 19.6 |
May 2027 | 101.48–119.12 | 110.30 | 28.2 |
June 2027 | 108.07–126.87 | 117.47 | 36.5 |
July 2027 | 117.47–145.90 | 135.09 | 57 |
August 2027 | 125.94–147.84 | 136.89 | 59.1 |
September 2027 | 126.43–148.41 | 137.42 | 59.7 |
October 2027 | 137.42–162.64 | 150.59 | 75 |
November 2027 | 139.25–163.47 | 151.36 | 75.9 |
December 2027 | 151.36–187.98 | 174.06 | 102 |
Source: LongForecast (01.06.2026)
Netflix Stock Long-Term Forecast up to 2037
CoinPriceForecast's multi-year model projects NFLX to trade progressively higher through 2037, driven by subscriber base expansion and steady margin improvement. Year-end targets range from $103.36 in 2026 to $266.12 in 2037.
According to WalletInvestor's long-term model, Netflix stock could reach approximately $87.73 in one year (+1.99% from current levels). The 5-year outlook is more cautious, with NFLX priced at $82.67 by 2031, implying a modest decline of around 3.9%. WalletInvestor rates NFLX as a "not so good" long-term investment based on its technical model.
Year | Mid-Year ($) | Year-End ($) | Change % |
2026 | 90.32 | 103.36 | 20 |
2027 | 115.50 | 118.97 | 38 |
2028 | 120.23 | 122.65 | 43 |
2029 | 138.42 | 141.85 | 65 |
2030 | 156.04 | 170.08 | 98 |
2031 | 184.00 | 197.80 | 130 |
2032 | 206.98 | 211.25 | 146 |
2033 | 215.70 | 220.34 | 156 |
2034 | 225.18 | 230.24 | 168 |
2035 | 235.53 | 241.07 | 180 |
2036 | 246.88 | 252.98 | 194 |
2037 | 259.38 | 266.12 | 209 |
Source: CoinPriceForecast (03.06.2026)
Technical Analysis of NFLX Stock
In technical analysis, you first need to identify the trend. As of 01.06.2026, NFLX's trend direction is confirmed by the indicator summary below. Then, we need to look at what technical indicators are pointing to.
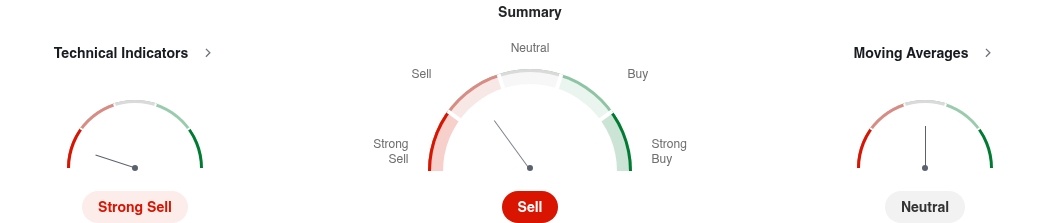
Technical context. Four indicator categories are most useful for NFLX:
- Moving averages: The 50-day and 200-day MAs serve as dynamic support and resistance. A golden cross (50-day crossing above 200-day) signals trend confirmation; a death cross signals reversal risk.
- RSI: Readings above 70 signal overbought conditions and potential pullback risk; below 30 signals oversold. NFLX has historically experienced sharp RSI extremes around earnings beats and misses.
- Support and resistance: Key round-number price zones tend to self-fulfil due to heavy institutional positioning.
- Volume: Volume spikes on breakouts confirm the move; volume-less price moves warrant caution. Technical analysis works best as a timing tool after fundamental conviction is established.
As you can see from the charts based on the technical analysis of Netflix stock, there is no guaranteed directional signal in isolation. Traders should align technical readings with fundamental analysis results.
Technical Indicators
Indicator | Value | Signal |
RSI(14) | 47.9 | Neutral |
STOCH(9,6) | 29.2 | Sell |
STOCHRSI(14) | 1.824 | Oversold |
MACD(12,26) | 7.02 | Buy |
ADX(14) | 30.56 | Sell |
Williams %R | -81.37 | Oversold |
CCI(14) | -97.64 | Sell |
ATR(14) | 15.47 | High Volatility |
Highs/Lows(14) | -12.85 | Sell |
Ultimate Oscillator | 44.01 | Sell |
ROC | -7.756 | Sell |
Bull/Bear Power(13) | -13.14 | Sell |
Source:Investing (01.06.2026)
Moving Averages
MA Period | Simple Value | Simple Signal | Exponential Value | Exponential Signal |
MA5 | 86.06 | Sell | 86.03 | Sell |
MA10 | 86.08 | Sell | 86.19 | Sell |
MA20 | 86.59 | Sell | 86.58 | Sell |
MA50 | 87.70 | Sell | 87.23 | Sell |
MA100 | 87.77 | Sell | 88.12 | Sell |
MA200 | 89.61 | Sell | 89.72 | Sell |
Source:Investing (01.06.2026)
Pivot Points
Name | S3 | S2 | S1 | Pivot | R1 | R2 | R3 |
Classic | 67.17 | 78.59 | 86.10 | 97.52 | 105.02 | 116.45 | 123.95 |
Fibonacci | 78.59 | 85.82 | 90.29 | 97.52 | 104.75 | 109.22 | 116.45 |
Camarilla | 88.41 | 90.14 | 91.88 | 97.52 | 95.34 | 97.08 | 98.81 |
Woodie | 65.23 | 77.62 | 84.16 | 96.55 | 103.08 | 115.48 | 122.01 |
Demark | - | - | 82.35 | 95.65 | 101.28 | - | - |
Source:Investing (01.06.2026)
Netflix Stock Price Targets by Experts
Wall Street analysts publish regular price targets and ratings for NFLX that directly move the stock. The consensus rating system uses Buy, Hold, and Sell classifications from sell-side analysts at investment banks and research firms. Consensus upgrades move NFLX higher; downgrades trigger sell-offs. The two variables analyst models depend on most heavily are subscriber growth trajectory and operating margin expansion, connecting analyst methodology directly back to the financial metrics covered above.
According to TipRanks, the current Wall Street consensus for NFLX carries an average 12-month price target of $115.74, based on ratings from 33 analysts over the past three months. The high target stands at $151.40 and the low at $80.00. The consensus rating is Strong Buy, with 25 Buy ratings, 8 Hold ratings, and 0 Sell ratings, implying an upside of approximately 18.9% from the current price.
Is NFLX a Buy, Sell or Hold?
Based on Netflix stock projections for the near and long-term future, NFLX is worth considering for a long position. Firstly, technical indicators (on daily, weekly, and monthly charts) provide directional context for timing entries and exits.
Secondly, the fundamentals are strong. Netflix's ability to raise prices while maintaining subscription growth shouldn't be underestimated. The company's successful password-sharing crackdown, its growing ad-supported tier, and its demonstrated operating leverage all strengthen the fundamental investment case.
This all points to NFLX potentially being a good investment opportunity. But what about trading? An active trading strategy is the fastest way of raising capital, which is a possibility with this asset. Trading is more intense, but the potential for profits in all market conditions and in higher percentages makes up for it.
If that sounds appealing, the best starting ground for the trading activity will be a Libertex demo account. Here, you get the chance to gain experience without risking real capital. And when you master the tools, you can start trading under live market conditions with more confidence. But please note that trading CFDs with leverage can be risky and can lead to losing all of your invested capital.
CoinPriceForecast projects NFLX to reach $197.80 by the end of 2031, with a mid-year 2031 price of $184.00, implying a gain of approximately +130% from current levels. This growth is based on promising earnings and revenue estimates.
FAQ
How High Can NFLX Go?
The highest long-term price targets from forecast models place NFLX at $184.00–$197.80 by 2031. These projections depend on continued subscriber growth, successful ad tier monetisation, and sustained operating margin expansion. As always, long-term forecasts carry significant uncertainty.
What Was Netflix's Original Stock Price?
Netflix's stock first began trading on the Nasdaq exchange in May 2002 at the IPO price of $15 per share. Since then, the initial public offering price has grown by more than 40 times as of current trading levels.
How Can I Buy Netflix Stock?
There are generally several steps to buy NFLX regardless of the platform you use: (1) Find a reputable broker and set up an account. (2) Fund your account. (3) Navigate to NFLX, enter the number of shares or investment amount (fractional shares are available on many platforms). (4) Select your order type (market, limit, etc.) and execute. (5) Monitor your position regularly.
Will Netflix Keep Growing?
Most forecasters are upbeat about Netflix's long-term growth prospects. The company has multiple growth levers: international market expansion, ad-tier monetisation, price increases, and live content events. Netflix's operating margin is expected to continue expanding as content spending growth moderates relative to revenue.
Why Is Netflix's Stock Price Likely to Increase?
Even though the streaming wars continue to heat up, Netflix's subscriber growth drives significant business value. Increased revenue will also be rooted in raised prices for the standard and premium tiers and the growing ad-supported tier. The stock-buying strategy for NFLX shares relies on the company's growing revenue, which is higher than ever, and on demonstrated margin improvement.
Disclaimer: The information in this article is not intended to be and does not constitute investment advice or any other form of advice or recommendation of any sort offered or endorsed by Libertex. Past performance does not guarantee future results.
Why trade with Libertex?
- Get access to a free demo account free of charge.
- Enjoy technical support from an operator 5 days a week, from 9 a.m. to 9 p.m. (Central European Standard Time).
- Use a multiplier of up to 1:30 (for retail clients).
- Operate on a platform for any device: Libertex and MetaTrader.