

Tesla Stock Forecast 2026–2030: Price Predictions, Analyst Ratings & Expert Verdict on TSLA
Prepared by the Libertex team
Content reviewed internally in accordance with regulatory standards.
Tesla, Inc. (NASDAQ: TSLA) trades at a trailing P/E of 381 – roughly five times the S&P 500 average – a valuation that encodes a very specific set of expectations about autonomous driving, robotics, and energy at scale. This guide covers Tesla's stock price forecast across short and long-term horizons through 2030, drawing on WalletInvestor, LongForecast, and CoinPriceForecast data alongside technical analysis and current Wall Street consensus.
Investors seek access to TSLA through a regulated broker and can do so via Libertex, an award-winning platform. The platform is used by a stock and CFD broker operating since 2012 and accepting clients from the EEA and Switzerland. To explore Tesla CFD trading, see Tesla stock on Libertex.
Key Takeaways
- Tesla (TSLA) trades on NASDAQ. As of September 2026, the 52-week range stands at $297.38–$498.83, Market Cap $1.44 trillion, trailing P/E 381, and Beta 1.81. RSI sits at 52.48 (Neutral); CNN Fear & Greed Index at 39 (Fear). Analyst consensus: 41% Buy / 45% Hold / 14% Sell (51 analysts).
- LongForecast projects Tesla stock to reach $401 by December 2026, representing +10.1% change from current levels.
- WalletInvestor forecasts TSLA at $392 by end of 2026, implying a neutral directional bias for the remainder of the year.
- CoinPriceForecast estimates Tesla at $633 by end of 2030 and $894 by mid-2035, reflecting cumulative annual growth assumptions tied to Robotaxi and energy segment expansion.
Recent Updates
- TSLA is currently priced at $364.27, with Market Cap $1.44T. Q2 2026: Revenue $28.24B (+26% YoY), Non-GAAP EPS $0.33 (-18% YoY), GAAP Net Income $1.11B (-5% YoY), Operating Margin 1.4% (down from 4.1% YoY). Next earnings report: 28 October 2026. YTD performance: -19% as of September 2026.
- On 22 June 2026, Jefferies analyst Philippe Houchois cut the TSLA price target to $375 (Hold) and flagged a new structural risk: growing speculation about a Tesla–SpaceX merger could cause TSLA shares to trade increasingly as a SpaceX proxy, disconnecting price action from Tesla's own EV, Robotaxi, and Optimus milestones.
- RBC Capital (Tom Narayan) estimates Tesla will deliver above-consensus 405,000 vehicles in Q2 2026. Tesla's Robotaxi service has expanded to Austin, the Bay Area, and plans cover seven additional metro areas in H2 2026. FSD subscription growth remains strong; EU approval expected Q2 2026, China Q3 2026.
Current TSLA Price:
What Is Tesla Stock (TSLA) and Why Does It Defy Traditional Valuation?
Applying a standard automotive sector lens to Tesla produces a misleading picture. With a trailing P/E of 381.1 versus an S&P 500 average of roughly 25–30x, TSLA's valuation only makes sense when the company is understood as a bet on artificial intelligence, autonomous mobility, and vertically integrated energy – not a bet on near-term car sales. This section establishes that analytical foundation.
Tesla's Founding Story and Corporate Identity
Tesla, Inc. was founded in July 2003 by Martin Eberhard and Marc Tarpenning, with Elon Reeve Musk joining as chairman in 2004 and later becoming CEO. Jeffrey Straubel served as CTO through the company's formative years. Tesla completed its NASDAQ IPO under ticker TSLA in June 2010 – the first US car company to go public since Ford in 1956 – and relocated its global headquarters to Austin, Texas, in 2021.
Tesla's mission is to accelerate the world's transition to sustainable energy.
That mission statement is not incidental to the investment thesis – it is the thesis. Every product line, every capital expenditure, and every analyst disagreement ultimately traces back to whether the execution rate against that mission justifies the current valuation.
Real-Time TSLA Stock Quote – Current Price, Volume, and Daily Range
The table below reflects Tesla's latest available market data. Prices update continuously during trading hours; verify current figures before acting on any forecast data in this article.
| Metric | Value |
| Current Price | 364.27 |
| 24h Change | -0.53 |
| Market Cap | 1,440,000,000,000 |
| Volume (24h) | 51,900,000 |
| 52-Week High | 498.83 |
| 52-Week Low | 297.38 |
Source: Investing (22.09.2026)
TSLA's 52-week range of 297.38–498.83 is fundamental to position sizing and time horizon decisions for any investor considering TSLA exposure.
Tesla's Core Business Segments: EVs, Autonomous Driving, Energy, and Robotics
Tesla operates across four major revenue and value creation pillars:
- Automotive – vehicle manufacturing, leasing, and the Robotaxi service operating in Austin and the Bay Area as of mid-2026. Vehicles include Model 3, Model Y, Model S, Model X, Cybertruck, and the upcoming Cybercab.
- AI & Software – Full Self-Driving (FSD) subscription platform, autonomous fleet development, and the Optimus humanoid robot programme, which management targets for commercial production by the end of 2026.
- Energy Generation & Storage – Powerwall residential batteries, Megapack utility-scale storage, and solar products. This segment is widely regarded as systematically undervalued by mainstream TSLA analyses.
- Services & Other – Supercharger network (now open to third-party EVs), auto insurance, vehicle upgrades, and after-sales services.
Key Financial Snapshot – What the Numbers Actually Tell Investors About TSLA
Gross margin trajectory is the single most revealing operational health metric for TSLA analysis. Recovery toward 19%+ signals the transition from a recovery story to a growth story. The table below translates key metrics into a plain-language investor context.
| Metric | Value | What It Means |
| Market Cap | 1,440,000,000,000 | Mega-cap; reflects AI/autonomy optionality premium |
| P/E TTM | 381.1 | 381.1 – prices in near-perfect execution |
| EPS (TTM) | 1.18 | Earnings per share; monitor trajectory vs. analyst estimates |
| Revenue (TTM) | 94,830,000,000 | $94.83B - Q1 2026 grew +20.32% YoY |
| Net Income | 3,790,000,000 | Annual NI declined -46.79% YoY despite Q1 improvement |
| Gross Margin | 4 | Key sentiment-turning metric; recovery toward 19%+ is bullish signal |
| Net Margin | 4 | Thin but improving; watch Q2/Q3 2026 trajectory |
| ROE (TTM) | 4.62 | Capital deployed aggressively into future growth; trajectory matters more than current level |
| Beta | 1.81 | If S&P 500 drops 10%, TSLA historically drops 18% |
| Debt-to-Equity | 0.19 | Structural competitive moat; flexibility to fund Robotaxi, Optimus, Gigafactories |
| EBITDA (TTM) | – | Strong – core operating power |
Source: Investing (22.09.2026)
Tesla Stock Performance – Historical Context and Recent Price Action
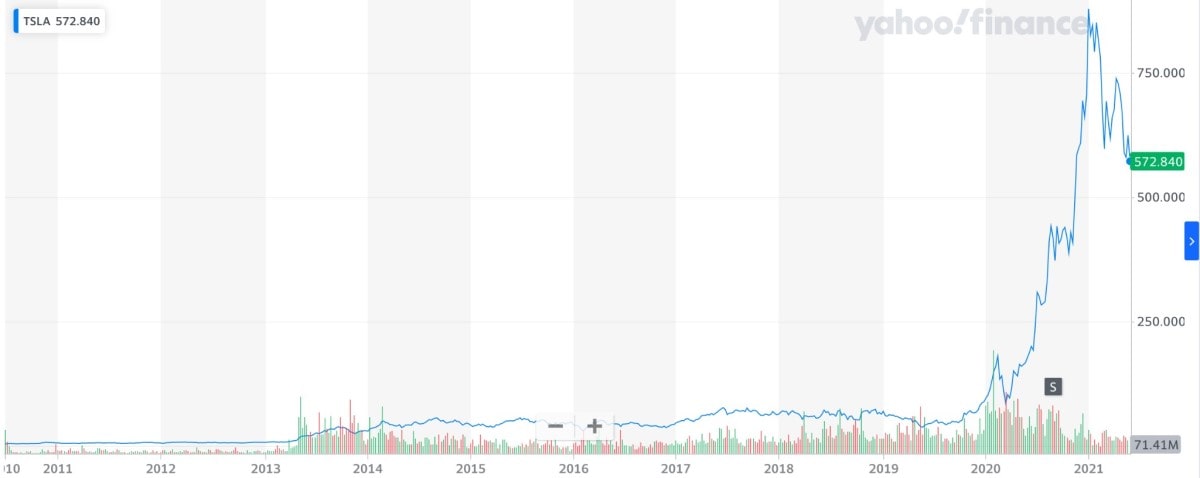
Tesla's long-term return profile is among the most striking in large-cap equity history. From $11.80 per share in June 2019 (pre-split adjusted) to a 52-week high of $498.83 in December 2025, TSLA delivered 4,100% appreciation in under seven years. The current YTD decline of -19% as of September 2026 is consistent with TSLA's established volatility pattern – not evidence of a structural breakdown.
Current Price Momentum – Where TSLA Stands in September 2026
Using CNN Markets' classification framework, TSLA is currently trading in the middle of its 52-week range and above its 200-day simple moving average (SMA). In plain investor language, this technical setup signals indecision – the market is waiting for a catalyst to establish the next directional move. Historically, periods where TSLA trades below the 200-day SMA have preceded major directional moves in both directions; the catalyst, not the technical setup itself, determines the outcome.
TSLA 52-Week Range and What It Reveals About Volatility
The 52-week range of 297.38–498.83 represents a significant swing within a single year. Tesla's Beta of 1.81 translates this to a practical investor rule: if the S&P 500 declines 10%, TSLA has historically declined 18%. The reverse applies on upside moves. Position sizing and time horizon are the primary risk management tools for TSLA investors – not market timing.
Year-to-Date and Multi-Period Returns – Reading TSLA's Performance Timeline
Current TSLA return profile across multiple time frames (as of September 2026):
- -0.53 (24h change)
- YTD: –19.0% (as of 18.09.2026)
The positive 1-year return alongside a negative YTD is a specific technical signature: it identifies a correction within an ongoing longer-term uptrend rather than a trend reversal. TSLA does not pay dividends; all returns are price returns only.
Tesla Stock Price By Day – Short-Term Forecast
The table below shows Tesla's daily price forecast for the coming weeks, updated dynamically. Each row reflects the projected minimum, maximum, and closing price for that trading session. Data source: 30rates.com.
| Date | Weekday | Min | Max | Price |
| 23.09 | Wednesday | 355 | 417 | 386 |
| 24.09 | Thursday | 355 | 417 | 386 |
| 25.09 | Friday | 353 | 415 | 384 |
| 28.09 | Monday | 362 | 424 | 393 |
| 29.09 | Tuesday | 363 | 427 | 395 |
| 30.09 | Wednesday | 361 | 423 | 392 |
| 01.10 | Thursday | 354 | 416 | 385 |
| 02.10 | Friday | 356 | 418 | 387 |
| 05.10 | Monday | 352 | 414 | 383 |
| 06.10 | Tuesday | 352 | 414 | 383 |
| 07.10 | Wednesday | 366 | 430 | 398 |
| 08.10 | Thursday | 348 | 408 | 378 |
| 09.10 | Friday | 365 | 429 | 397 |
| 12.10 | Monday | 366 | 430 | 398 |
| 13.10 | Tuesday | 354 | 416 | 385 |
| 14.10 | Wednesday | 372 | 436 | 404 |
| 15.10 | Thursday | 365 | 429 | 397 |
| 16.10 | Friday | 374 | 440 | 407 |
| 19.10 | Monday | 370 | 434 | 402 |
| 20.10 | Tuesday | 371 | 435 | 403 |
| 21.10 | Wednesday | 357 | 419 | 388 |
| 22.10 | Thursday | 374 | 440 | 407 |
| 23.10 | Friday | 368 | 432 | 400 |
| 26.10 | Monday | 384 | 450 | 417 |
Source: 30rates (22.09.2026)
Tesla Stock Prediction for 2026 – LongForecast
Tesla's 2026 price trajectory hinges on three catalysts: Robotaxi commercial expansion, Q2/Q3 gross margin recovery, and broader tech sentiment. The most binary near-term event is a Robotaxi city expansion announcement. Jefferies (22 June 2026) flagged an additional risk: Tesla–SpaceX merger speculation may disconnect TSLA's price from its own operational performance. The forecasts below reflect current model projections from LongForecast and WalletInvestor.
LongForecast projects a mixed trajectory for Tesla stock in the second half of 2026, with the price expected to reach $401 by December – representing +10.1% change from current levels.
| Month | Min–Max (USD) | Close (USD) | Total, % |
| September 2026 | 353–427 | 392 | 4.5% |
| October 2026 | 348–450 | 410 | 9.3% |
| November 2026 | 410–510 | 472 | 25.9% |
| December 2026 | 369–472 | 401 | 6.9% |
Source: LongForecast (22.09.2026)
Tesla Stock Prediction for 2026 – WalletInvestor
WalletInvestor's algorithmic model forecasts TSLA at $392 by December 2026, with a mixed trajectory across the second half of the year. The model applies technical pattern analysis and historical price behaviour data.
| Date | Open (USD) | Close (USD) | Min (USD) | Max (USD) | Change |
| September 2026 | 384.85 | 384.85 | 384.85 | 384.85 | 0% |
| October 2026 | 377.28 | 453.62 | 355.26 | 487.81 | 17.87% |
| November 2026 | 441.24 | 455.78 | 406.69 | 516.46 | 0.48% |
| December 2026 | 447.67 | 392.25 | 363.38 | 466.04 | -13.94% |
Source: WalletInvestor (22.09.2026)
Tesla Stock Prediction for 2027 – LongForecast
2027 is a binary outcome year for Tesla – either the Robotaxi programme proves the bull case definitively, or the timeline exposes how far scalable commercialisation actually is. RBC Capital (Outperform, $500) values the autonomy segments at 10x revenues; UBS (Neutral, $364) flags gross margin trajectory in Q2–Q3 2026 as the key swing factor. Q2 2026 delivery data is the most closely monitored near-term catalyst ahead of the 2027 outlook.
LongForecast projects Tesla stock in 2027 with a positive trajectory, with the price expected to reach $647 by December 2027, representing +49.8% change from the start of the year.
| Month | Min–Max (USD) | Close (USD) | Total, % |
| January 2027 | 397–467 | 432 | 15.2% |
| February 2027 | 408–478 | 443 | 18.1% |
| March 2027 | 413–485 | 449 | 19.7% |
| April 2027 | 420–492 | 456 | 21.6% |
| May 2027 | 424–498 | 461 | 22.9% |
| June 2027 | 443–521 | 482 | 28.5% |
| July 2027 | 450–528 | 489 | 30.4% |
| August 2027 | 451–529 | 490 | 30.7% |
| September 2027 | 490–609 | 564 | 50.4% |
| October 2027 | 564–672 | 622 | 65.9% |
| November 2027 | 576–676 | 626 | 66.9% |
| December 2027 | 595–699 | 647 | 72.5% |
Source: LongForecast (22.09.2026)
Tesla Stock Prediction for 2027 – WalletInvestor
WalletInvestor's 2027 forecast for Tesla shows a positive trajectory, with the price projected to rise to $674 by December 2027.
| Date | Open (USD) | Close (USD) | Min (USD) | Max (USD) | Change |
| January 2027 | 378.39 | 378.11 | 317.67 | 381.51 | -3.6% |
| February 2027 | 382.97 | 380.69 | 329.01 | 382.97 | 0.68% |
| March 2027 | 399.08 | 408.38 | 388.19 | 432.69 | 7.27% |
| April 2027 | 403.7 | 464 | 396.19 | 464 | 13.62% |
| May 2027 | 477.46 | 547.46 | 464.61 | 655.03 | 17.99% |
| June 2027 | 538.24 | 520.98 | 442.75 | 538.24 | -4.84% |
| July 2027 | 507.26 | 476.69 | 434.02 | 511.8 | -8.5% |
| August 2027 | 465.76 | 513.41 | 465.76 | 542.01 | 7.7% |
| September 2027 | 501.65 | 429.19 | 405.61 | 543.39 | -16.4% |
| October 2027 | 625.89 | 641.86 | 607.11 | 661.12 | 2.55% |
| November 2027 | 642.39 | 657.83 | 617.34 | 683.49 | 2.4% |
| December 2027 | 658.37 | 674.34 | 640.59 | 692.55 | 2.43% |
Source: WalletInvestor (22.09.2026)
Tesla Stock Forecast for 2028–2035 – CoinPriceForecast
Bull Case ($800–$1,200+): Robotaxi network at scale with software-margin revenue, Optimus at commercial deployment, Energy Storage as second dominant segment. Base Case ($450–$700): steady EV growth and partial autonomy monetisation. Bear Case ($150–$300): competition erodes market share, autonomous driving delays, annual net income deterioration continues. Critical insight: the Energy Storage business is systematically undervalued in most mainstream TSLA analyses – Megapack gross margins exceed automotive on a per-unit basis.
While long-range price forecasting for any publicly traded security carries significant uncertainty, CoinPriceForecast's model for TSLA through 2035 reflects gradual upside assumptions tied to the progressive monetisation of Tesla's AI, autonomy, and energy businesses. The model projects TSLA reaching $633 by end of 2030 and $894 by mid-2035, implying annual compound growth of approximately 14.8% from current levels.
| Year | Mid-Year (USD) | End-Year (USD) | Tod/End, % |
| 2028 | 450 | 453 | 21 |
| 2029 | 521 | 578 | 54 |
| 2030 | 620 | 633 | 69 |
| 2031 | 690 | 746 | 99 |
| 2032 | 802 | 803 | 114 |
| 2033 | 820 | 837 | 123 |
| 2034 | 855 | 874 | 133 |
| 2035 | 894 | 915 | 144 |
Source: CoinPriceForecast (22.09.2026)
Technical Analysis of Tesla Stock (TSLA) – 22.09.2026
Technical analysis for TSLA must always be read alongside fundamentals and news flow. Tesla is among the stocks where purely mechanical technical trading fails most reliably – event-driven price moves (earnings releases, Robotaxi news, Musk headlines) routinely override technical setups. Treat technical indicators as a probability tool identifying likely price zones, not as a prediction engine.
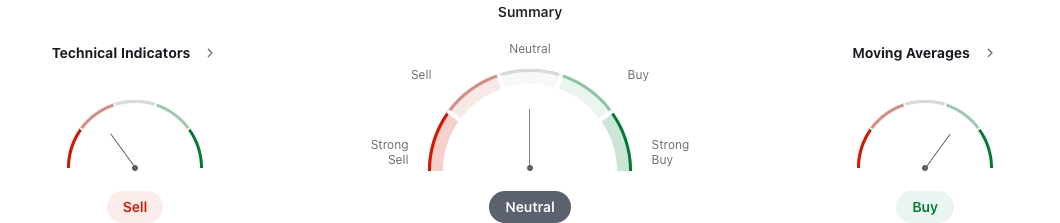
The following analysis is provided by Investing.
Technical Indicators
| Indicator | Value | Signal |
| RSI (14) | 52.48 | Neutral |
| STOCH (9,6) | 43.65 | Sell |
| STOCHRSI (14) | 31.71 | Sell |
| MACD (12,26) | 26.38 | Buy |
| ADX (14) | 31.41 | Buy |
| Williams %R | -61.39 | Sell |
| CCI (14) | -46.3 | Neutral |
| ATR (14) | 72.07 | Less Volatility |
| Highs/Lows (14) | 0 | Neutral |
| Ultimate Oscillator | 54.91 | Buy |
| ROC | 21.7 | Buy |
| Bull/Bear Power (13) | -24.21 | Sell |
Source: Investing (22.09.2026)
Note: ATR (14) is a volatility measure, not an oscillator. When counting buy/sell signals from oscillators, the total is 11 of 12 indicators (ATR excluded from signal count).
Moving Averages
| Indicator | Simple | Signal | Exponential | Signal |
| MA5 | 382.14 | Sell | 374.35 | Buy |
| MA10 | 394.67 | Sell | 377.24 | Sell |
| MA20 | 370.94 | Buy | 363.27 | Buy |
| MA50 | 288.44 | Buy | 302.79 | Buy |
| MA100 | 213.01 | Buy | 236.41 | Buy |
| MA200 | 111.69 | Buy | 157.38 | Buy |
Source: Investing (22.09.2026)
Key moving average context: 50-day SMA at 288.44 (key near-term pivot); 200-day SMA at 111.69. The 50-day SMA is already trading above the 200-day SMA (a Golden Cross condition), a bullish structural signal.
Pivot Points
| Name | S3 | S2 | S1 | Pivot | R1 | R2 | R3 |
| Classic | 270.78 | 290.6 | 329.28 | 349.1 | 387.78 | 407.6 | 446.27 |
| Fibonacci | 290.6 | 312.95 | 326.75 | 349.1 | 371.45 | 385.25 | 407.6 |
| Camarilla | 351.86 | 357.23 | 362.59 | 349.1 | 373.31 | 378.67 | 384.04 |
| Woodie | 280.2 | 295.31 | 338.7 | 353.81 | 397.2 | 412.31 | 455.69 |
| Demark | - | - | 339.19 | 354.06 | 397.69 | - | - |
Source: Investing (22.09.2026)
Key Support and Resistance Levels – The Price Zones Every TSLA Investor Watches
Setting price alerts at key support and resistance levels allows investors to monitor TSLA efficiently without tracking every tick. The five levels below represent the most significant price zones based on technical analysis and moving average data as of September 2026.
- $297.82 – 52-week low/critical floor. The last major support base; a break below would signal a significant structural deterioration and would likely trigger institutional selling.
- $360–$370 – near-term support zone. Previous consolidation area; represents the first meaningful support level above the 52-week low.
- 282.06 – 50-day SMA/key near-term pivot. The most watched short-term technical level. A sustained close above this level is the first requirement for improving the technical picture.
- 106.22 – 200-day SMA/major resistance. The intermediate-term bearish/bullish dividing line. A reclaim of this level of volume would signal a potential trend shift.
- $498–$500 – 52-week high/psychological ceiling. Round-number resistance at the top of the current trading range. Closing above $500 would represent a technical breakout and likely attract significant momentum buying.
Fibonacci retracement levels between these named zones provide additional intermediate price targets for active traders managing entries and exits between the primary levels.
How Has Tesla Stock Changed Over Time?
Tesla's long-term return profile is among the most striking in large-cap equity history. From $11.80 per share in June 2019 (pre-split adjusted) to a 52-week high of $498.83 in December 2025, TSLA delivered 4,100% appreciation in under seven years.
- 2010: Tesla IPO on NASDAQ at $17 per share – the first US automaker to go public since Ford in 1956. With 13.3 million shares issued, the company raised $226 million.
- 2014: Gigafactory announcement strengthens investor confidence. Year-end price reaches $220.
- 2017–2019: Model 3 launch triggers significant volatility. Price ranges from $310 to $418 across the period.
- 2020: 5-for-1 stock split on 31 August. S&P 500 inclusion drives institutional demand. Year-end: $705 (post-split).
- January 2021: All-time high above $900. Year-end: $1,056.
- 2022: Elon Musk's Twitter acquisition triggers TSLA selloff. Year-end: $120 (split-adjusted).
- 2023: Recovery to $250–$265.
- 2024: EV demand concerns and Cybertruck ramp. Range $140–$260.
- 2025: 52-week high of $498.83 reached December 2025.
- 2026. TSLA enters 2026 in correction, YTD -19% as of September 2026.
What Drives the Tesla Stock Price? Key Fundamental Factors
After reading this section, investors can evaluate any TSLA news headline or analyst report more critically. Tesla's stock price is fundamentally driven by two forces simultaneously: near-term delivery and margin data, and long-term AI and autonomy narrative credibility. These forces sometimes push in the same direction; more often, they create the tension that makes TSLA uniquely volatile.
Earnings, Revenue Growth, and Margin Trends
The quarterly earnings cycle is the single most direct price-moving event for TSLA. Q1 2026 results showed encouraging improvement: Revenue 94,830,000,000 (TTM), EPS 1.18. Next earnings report: 28 October 2026.
However, the quarterly narrative must be contextualised against the full-year picture: full-year revenue was essentially flat year over year; annual net income declined by 46.79% versus the prior year. The quarterly improvement is encouraging – it does not yet reverse the annual trend. Gross margin recovery toward 19%+ is the metric that most reliably predicts whether the TSLA narrative shifts from "recovery story" to "growth story." When Tesla reports earnings, expect an initial 5–15% price move in either direction, followed by a partial reversal within 3–5 trading days as markets reassess the initial reaction.
Free Cash Flow and Liquidity – Financial Health Metrics
Tesla's Debt-to-Equity ratio of 0.19 is a structural competitive moat – minimal financial leverage provides flexibility to fund Robotaxi infrastructure, Optimus production ramp, and new Gigafactories simultaneously. Tesla raised its 2026 capital expenditure forecast to $25 billion; Goldman Sachs expects this will produce negative overall free cash flow for full-year 2026.
| Health Metric | Value | Assessment |
| Free Cash Flow (Q1 2026) | +$1.44B | Strong |
| ROE (TTM) | 4.62 | Watch – capital deployment phase |
| Debt-to-Equity | 0.19 | Strong – structural moat |
| EBITDA (TTM) | – | Strong – core operating power |
Source: Investing (22.09.2026)
The Elon Musk Factor – Leadership Risk and Market Sentiment
Elon Musk's relationship with Tesla's stock price is genuinely dual-natured. On the upside, his visionary credibility – autonomous driving, Optimus, energy – bids up long-term expectations beyond what current financials justify. On the downside, Musk's high public profile creates a correlation between political news cycles and TSLA price action that is unusual for any mega-cap stock.
Musk's recent insider option activity is worth tracking as a leadership confidence signal: large executive option exercises typically indicate insider conviction about near-term performance. The 22 June 2026 Jefferies note flagging Tesla–SpaceX merger speculation as a structural risk adds a new dimension to the Musk factor: if TSLA begins trading as a SpaceX proxy, price action becomes partially decoupled from Tesla's own EV, Robotaxi, and Optimus performance metrics. This represents an unusual and new risk for Tesla investors that was not present in prior years.
EV Market Competition, Global Deliveries, and Tesla's Market Share
Quarterly delivery numbers are the metric Wall Street grades most harshly. RBC Capital estimates Tesla will deliver above-consensus vehicles in Q2 2026, which would provide a meaningful near-term positive catalyst. Tesla's China-made EV sales jumped nearly 40% in May 2026 (CNBC, June 2026), partially offsetting North American market saturation concerns.
Competitive landscape: BYD's passenger EV sales have declined for eight consecutive months as of May 2026, suggesting that intensifying competition within China is affecting both brands. Rivian began the first public deliveries of its R2 mid-size SUV in June 2026, targeting the mass-market segment that overlaps with Tesla's Model 3 and Model Y.
Tesla's structural competitive moats: (1) Supercharger network – now adopted by third-party EVs, turning a proprietary asset into an industry standard; (2) Vertical integration from battery cells to software; (3) FSD as a recurring subscription revenue stream; (4) Brand loyalty and aspirational positioning that persists despite recent political associations. The NatPower battery energy storage agreement demonstrates momentum in the Energy segment that most competitive analyses underweight.
See trading CFDs on Libertex for information on how to access TSLA price movements without direct share ownership.
TSLA Peer Comparison – How Tesla Stacks Up Against Its Closest Competitors
CNN Markets classifies TSLA within the "Consumer Durables sector/Motor Vehicles group." This classification understates Tesla's AI and software identity and is precisely why traditional peer comparison produces misleading conclusions. The table below uses the conventional peer set, but readers should note that Tesla's valuation framework differs significantly from every company in the same sector classification.
| Company | Ticker | Recent Price | Market Cap | P/E |
| Tesla, Inc. | TSLA | 364.27 | 1,440,000,000,000 | 381.1 |
| BYD Company | BYDDY | – | $108B | – |
| Rivian Automotive | RIVN | – | $19B | – |
| Lucid Group | LCID | – | $2.8B | – |
Source: Yahoo Finance, StockAnalysis (22.09.2026)
The key insight: Tesla's P/E of 381.1 versus BYD's trailing P/E is not irrationality on Tesla's part – it reflects the market pricing a fundamentally different business model. The misclassification of TSLA as a "Consumer Durables" company versus its actual positioning as an AI and energy company is itself a component of why the valuation premium exists and persists.
Analyst Ratings and Wall Street's Consensus on Tesla Stock
Here is a paradox worth examining: Tesla is a 1,440,000,000,000 company with a high proportion of Hold ratings from Wall Street analysts. That distribution does not signal rejection of the Tesla thesis – it signals institutional uncertainty about execution timing. Analysts holding neutral ratings on TSLA are not betting against it; they are waiting for proof before adding exposure.
Current consensus: 41% Buy / 45% Hold / 14% Sell (51 analysts)
- Bulls say: Robotaxi commercial launch provides a step-change in recurring software revenue; Optimus represents an entirely new market category; Energy Storage is systematically undervalued; FSD subscription growth validates the autonomy thesis.
- Holds say: Current P/E prices in near-perfect execution; 2026 FCF likely negative due to $25 billion capex; autonomous driving timelines remain uncertain; conviction requires proof, not projection.
- Bears say: Annual net income -46.79% year over year signals structural deterioration; EV competition intensifying from BYD and legacy OEMs; Musk key-person risk remains unpriced; Tesla–SpaceX merger speculation adds valuation uncertainty.
Wedbush Securities
Dan Ives maintains a Street-high $600 price target with an Outperform rating (issued April 2026). Ives projects Tesla could reach a $2 trillion market cap in 2026 and up to $3 trillion in the bull case. His thesis centres on an accelerated Robotaxi rollout across 30+ US cities in 2026: "We are raising our price target on Tesla to $600, reflecting our view that an accelerated AI autonomous path is now on the horizon." Ives considers 2026 the beginning of "the biggest growth chapter in Tesla's history."
RBC Capital
Tom Narayan maintains an Outperform rating with a $475 price target (revised from $480 in April 2026). RBC's valuation applies a sum-of-the-parts framework: 1x sales to automotive, 15x EBITDA to Megapacks, and 10x revenues to the autonomy segments (FSD, Robotaxi, robotics). The target reduction reflected $5 billion in higher capital expenditure and caution around humanoid robot timelines, not a change in the long-term thesis. RBC estimates Q2 2026 deliveries above consensus at 405,000 vehicles.
Source: Investing (23.04.2026)
Morgan Stanley
Adam Jonas holds a Hold rating with a $415 price target (updated December 2025, most recent available). Jonas declared in October 2025 that "autonomous cars are solved," comparing the moment to the invention of the steam engine and noting Tesla's camera-only system would challenge conventional robotaxi assumptions. Morgan Stanley expects Tesla to deploy around 1,000 Robotaxis by the end of 2026, with a path toward one million by 2035.
Jefferies
Philippe Houchois raised his price target to $400 (Hold maintained) on 13 July 2026, following stronger-than-expected Q2 2026 deliveries. Jefferies flagged a new structural risk: Tesla may increasingly trade as a SpaceX proxy if merger speculation builds, creating price action that reflects SpaceX's valuation rather than Tesla's operational performance. Jefferies also noted that Tesla's "valuation and estimates remain disconnected."
Source: Yahoo Finance
Goldman Sachs
Mark Delaney holds a Neutral (Hold) rating with a $360 price target (updated September 2026). Delaney's primary concern is the $25 billion capex plan: "We now expect negative overall free cash flow this year for Tesla." Goldman has flagged the AI training infrastructure investment as a long-term positive but a near-term earnings headwind.
The 1-year analyst consensus target sits close to TSLA's current trading price, implying limited near-term upside without a transformative catalyst. The extreme divergence between the most bullish ($600, Wedbush) and most bearish targets is itself a signal/ TSLA is a genuinely binary stock where the range of credible outcomes is wider than for virtually any other large-cap equity.
Is Tesla Stock a Good Buy Right Now? Expert Assessment
The honest answer depends entirely on the investor's profile, time horizon, and risk tolerance. This section provides the evidence-based analytical framework to make that determination – not a universal buy or sell recommendation.
The Bull Case vs. The Bear Case – Both Arguments Examined
The Bull Case: Robotaxi at commercial scale generates recurring software-margin revenue with characteristics unlike any automotive business model. Optimus at commercial deployment creates an entirely new addressable market with no historical precedent for valuation. Energy Storage (Megapack) is becoming a critical global infrastructure product, with the NatPower agreement and Megapack gross margins exceeding automotive. FSD subscription growth of 51% year over year demonstrates tangible progress toward the autonomy thesis. D/E of 0.19 provides unmatched capital flexibility relative to any competitor.
The Bear Case: A trailing P/E of 381.1 prices in near-perfect execution across three or four business lines simultaneously – an extraordinary execution requirement. Annual net income declined 46.79% year over year; the Q1 2026 recovery is encouraging, but does not reverse the trend. 2026 FCF is expected to be negative due to $25 billion capex (Goldman Sachs). EV competition from BYD is intensifying globally. Autonomous driving regulatory and technical timelines remain uncertain. Musk key-person concentration risk – including the new Tesla–SpaceX merger speculation flagged by Jefferies on 22 June 2026 – represents an unusual structural risk for any mega-cap stock. TSLA is negative YTD and trading below the 200-day SMA.
The analytical question is not whether the bull case or the bear case is correct. It is whether the magnitude of the bull case, if realised, exceeds the magnitude of the bear case with sufficient probability to justify the current entry price and the risk of being wrong.
Who Should Consider Buying TSLA – and Who Should Wait
- Long-term growth investor (5+ year horizon): Highest suitability. The AI, autonomy, and energy thesis requires years to manifest. Position sizing discipline is essential – TSLA's elevated Beta means drawdowns will be severe at times. The question is not whether to hold through volatility, but how large a position is appropriate given total portfolio risk.
- Medium-term investor (1–3 years): Moderate suitability. The 2027 Robotaxi clarity event is the key binary catalyst. If evidence of commercial scale emerges by mid-2027, this cohort could see substantial returns. If the timeline slips materially, a 1–3 year investment may not recapture the entry price.
- Active trader (weeks/months): High potential but requires strong technical discipline. TSLA's Beta demands defined risk parameters and stop-loss levels before entry. The 50-day SMA (288.44) and 200-day SMA (111.69) are the key technical reference levels for position management.
- Risk-averse or income-focused investor: Low suitability. TSLA pays no dividend and is subject to headline-driven price swings of 5–10% in a single session. Alternative equity exposure with lower volatility is more appropriate for capital preservation objectives.
- Momentum trader: Monitor for a sustained daily close above the 200-day SMA at 111.69 on above-average volume. This signal would indicate a potential trend shift and could be used as a momentum entry confirmation. A bullish analyst upgrade from a major institution concurrent with such a technical break would add confirmation weight.
Investors wishing to gain exposure to TSLA price movements without direct share ownership can explore trading CFDs. Please note that trading CFDs with leverage can be risky and may lead to losing all invested capital. A Libertex demo account allows practice in a risk-free environment.
Conclusion
Tesla simultaneously represents one of the most compelling long-term growth narratives in equity markets and one of the most demanding tests of investor patience. The evidence points to four actionable conclusions:
- The current technical picture – RSI 52.48 (Neutral), trading above the 200-day SMA at 111.69 – is neutral-to-constructive in the short term.
- The 2027 Robotaxi and Optimus clarity event is the most important near-term catalyst for the long-term thesis. Execution in 2026 sets the stage for either confirmation or revision of the 2030 bull case.
- The 41% Buy / 45% Hold analyst split reflects institutional uncertainty about timing, not potential. The unusually wide target range ($125 to $600) reflects genuine analytical disagreement about a genuinely binary stock.
- Position sizing and time horizon are the two most important variables for any TSLA decision – more important than whether the entry price is $380 or $420.
What to monitor: (1) Gross margin recovery trajectory in Q2 and Q3 2026; (2) Q3 delivery data (expected early October 2026); (3) Next earnings report 28 October 2026; (4) Robotaxi city expansion progress; (5) Tesla–SpaceX merger speculation and any official communications from Musk or the Tesla board.
Frequently Asked Questions
What is the Tesla stock price prediction for 2026?
Three scenarios for TSLA by end of 2026: Bull case ($460–$500) requires a meaningful Robotaxi expansion announcement or earnings recovery. Base case ($380–$430) reflects continued execution without a major catalyst. Bear case ($280–$340) assumes margin deterioration and macroeconomic headwinds. All three are grounded within the current 52-week trading channel ($297–$499). WalletInvestor and LongForecast monthly data for July–December 2026 are provided above.
What will Tesla stock be worth in 2030?
CoinPriceForecast provides a long-range scenario through 2035. Independently, three scenarios emerge: Bull ($800–$1,200+) requires Robotaxi at scale, Optimus commercial deployment, and Energy Storage as a dominant segment. Base ($450–$700) reflects steady EV growth and partial autonomy monetisation. Bear ($150–$300) assumes intensifying competition and autonomous driving timeline delays. The 2030 base case is broadly consistent with current analyst consensus frameworks.
Is Tesla stock overvalued right now?
Tesla's trailing P/E of 381x is roughly five times the S&P 500 average – a conventional automotive valuation framework classifies TSLA as significantly overvalued. However, Tesla is not a conventional automotive company. The premium reflects the market pricing autonomous driving (Robotaxi), humanoid robotics (Optimus), and energy storage as future high-margin businesses. Whether that premium is justified depends on execution against those three pillars.
What are Tesla's biggest investment risks?
Primary risks: (1) Current P/E of 381x prices in near-perfect execution – any material miss triggers disproportionate selloffs; (2) Annual net income declined -46.79% YoY; (3) Intensifying EV competition from BYD and legacy OEMs; (4) Autonomous driving regulatory and technical timeline uncertainty; (5) Elon Musk key-person concentration risk, compounded by new Tesla–SpaceX merger speculation (Jefferies, June 2026) that could partially decouple TSLA's price from its own operational performance.
Should investors buy Tesla stock now or wait?
The answer depends on investor profile. Long-term investors (5+ years) with high risk tolerance may view the current price as reasonable given the 2030 bull case, provided position sizing is disciplined. Medium-term investors may prefer to wait for Robotaxi commercial proof before adding exposure. Momentum traders should monitor for a sustained close above the 200-day SMA as a potential entry confirmation signal. Risk-averse investors should consider lower-volatility alternatives.
Disclaimer: The information in this article is not intended to be and does not constitute investment advice or any other form of advice or recommendation of any sort offered or endorsed by Libertex. Past performance does not guarantee future results.
Why trade with Libertex?
- Get access to a free demo account free of charge.
- Enjoy technical support from an operator 5 days a week, from 9 a.m. to 9 p.m. (Central European Standard Time).
- Use a multiplier of up to 1:30 (for retail clients).
- Operate on a platform for any device: Libertex and MetaTrader.