What Are Harmonic Patterns and How to Use Them for Effective Forex Trading?
Prepared by the Libertex team
Content reviewed internally in accordance with regulatory standards.
Harmonic patterns are one of the most complicated trading instruments. To draw them on the chart, you need to combine lots of knowledge. But we wanted to make your life easier, so we gathered the most relevant information about harmonic patterns in forex in one guide. Keep reading to find the most reliable signals.
Harmonic Patterns: An Explanation
Harmonic patterns are kinds of chart patterns like Head and Shoulders or Double Top but which are based on Fibonacci tools (retracements and extensions) and have geometric structure. The patterns are used to signal a trend reversal on a price pullback. Because they're built on specific Fibonacci levels, these patterns provide a high degree of accuracy.
Harmonic patterns are a kind of chart pattern, which are based on Fibonacci tools and have a geometric structure.
There are several harmonic patterns, and each one has a specific shape and figure. However, there are some common things we can highlight. Usually, harmonic trading patterns have five turning points and four 'legs'.
Harmonic Patterns: Types
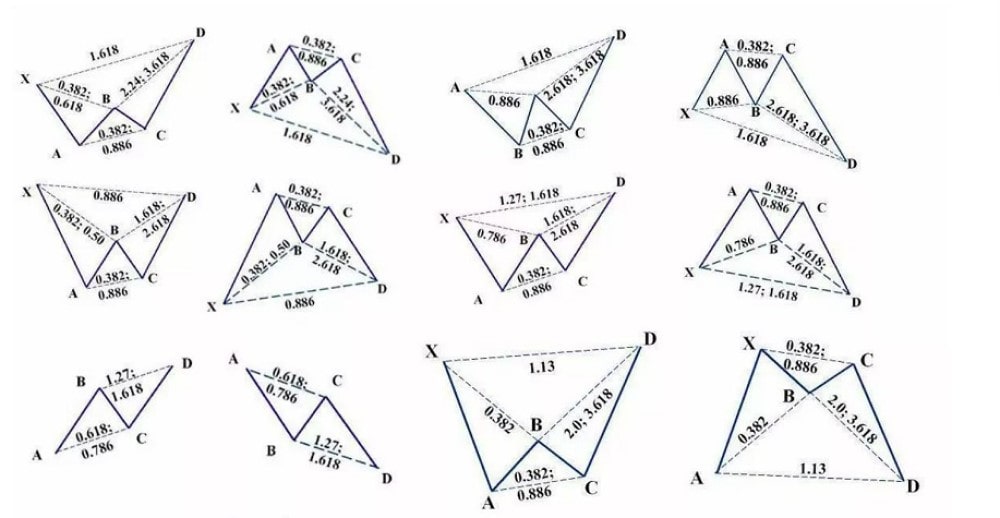
There are several types of harmonic patterns, but all of them can be bearish and bullish. Some patterns look very similar. That's why it's vital to know their differences.
Usually, harmonic trading patterns have five turning points and four 'legs'.
As we mentioned above, patterns are based on Fibonacci levels. These numbers are derived from the ratios 0.618 and 1.618. The levels include 0.786, 0.886, 1.13 and 1.27. You may also run across other numbers, like 0.382, 0.50, 0.707, 1.41, 2.0, 2.24, 2.618, 3.14 and 3.618. These exact numbers are used to define points of price changes.
ABCD
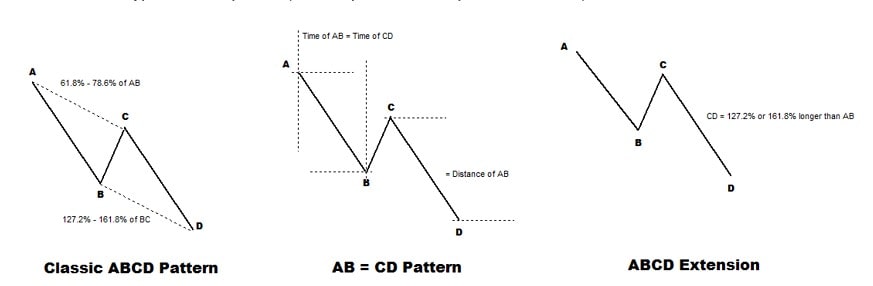
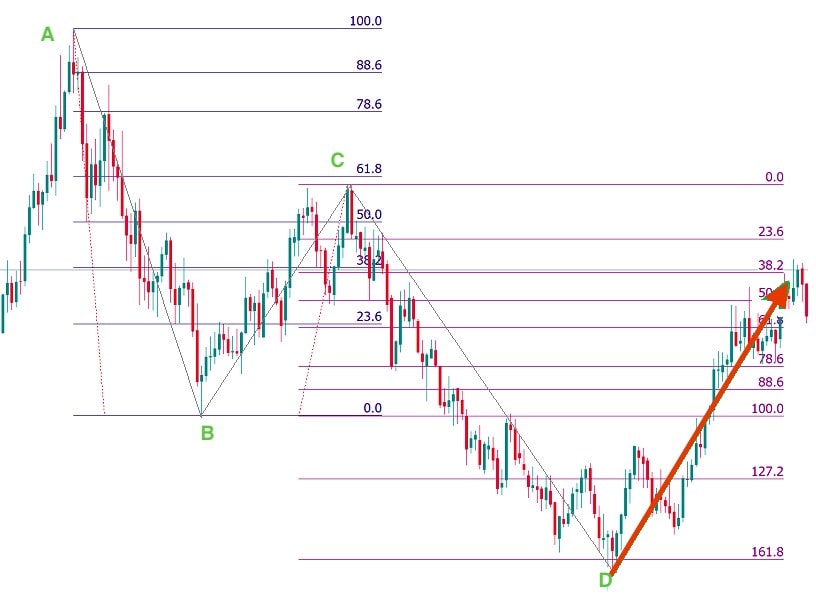
The basis of all harmonic trading patterns is the ABCD pattern. AB and CD lines are called legs; they have a similar size. BC is a correction.
There are several types of ABCD patterns. In the classic version, point C is at 61.8%-78.6% of the AB line. Point D is 127.2%-161.8% of the Fibonacci extension of the BC line. If you apply the 61.8% retracement level, there should be a 161.8% projection of BC. The 78.6% retracement level at point C usually results in a 127.2% projection.
You can also find an AB=CD pattern. As you can see, the legs are the same size.
The third type is the ABCD extension. In this case, the CD leg is a 127.2%-161.8% extension of the AB line. The CD line can be much longer than the AB line (at least two times).
By trading this pattern, you can apply the following rules for a Take-Profit order. The Take-Profit can be located at the 38.2% or 61.8% retracement level of the AD. The Take-Profit can also be at point A.
Gartley
The original Gartley Pattern didn't include Fibonacci levels. These levels were added by Scott Carney and Larry Pesavento.
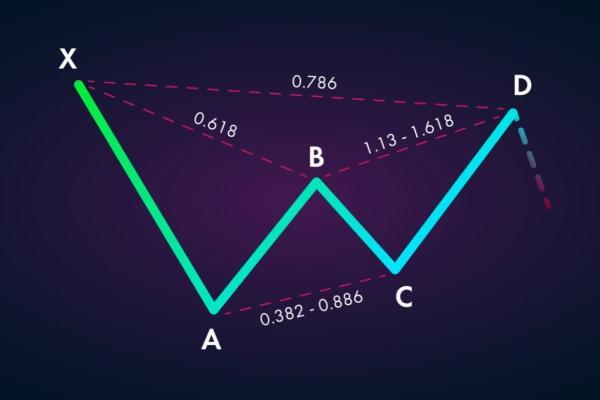
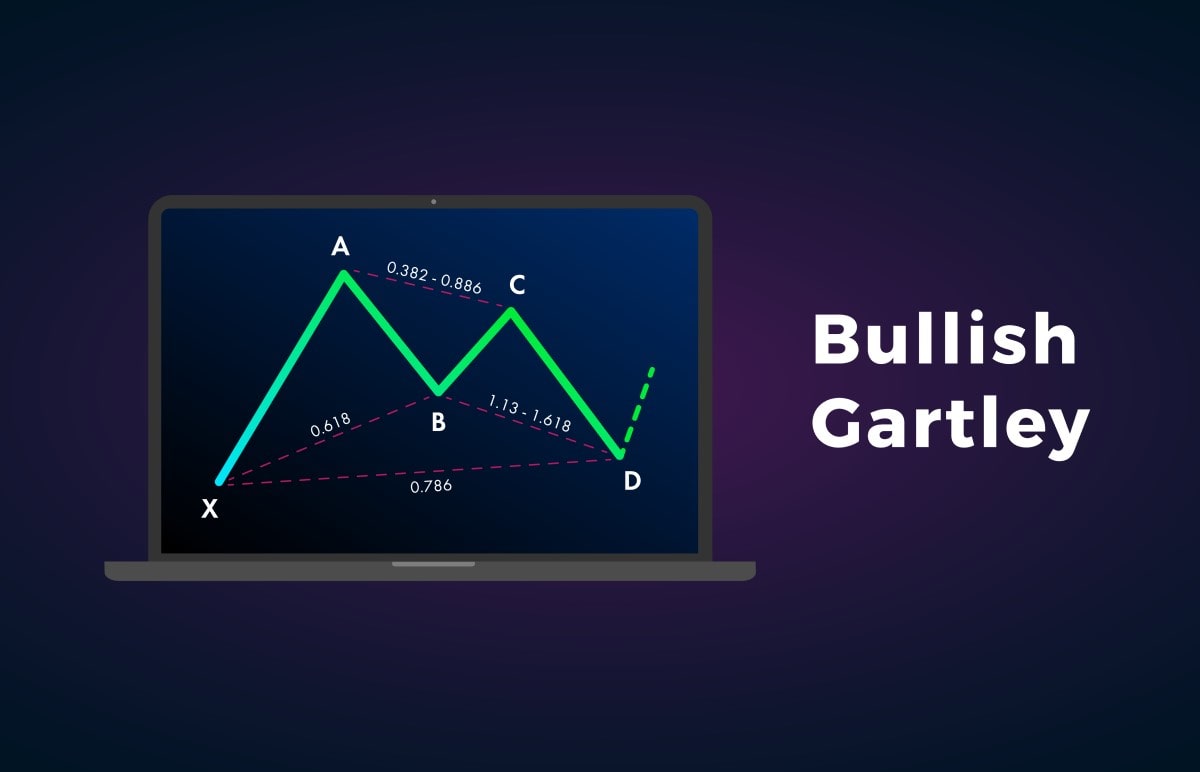
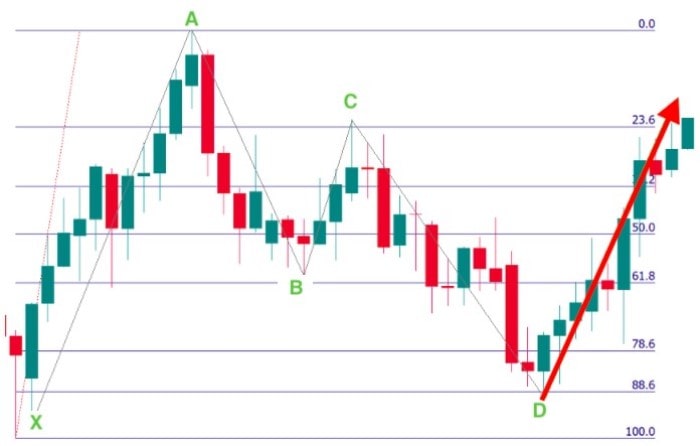
To find this pattern on the price chart, look for a price movement that resembles the letter M. It will be a bullish pattern. When you find a price moving in the shape of a W, it's a sell pattern. Gartley includes the ABCD pattern but consists of five letters; the fifth is X. Line XA should be the longest.
- The critical condition is that point B should be at the 61.8% retracement level of line XA.
- Point C should be the 38.2%-88.6% retracement level of the AB line.
- Point D is 127.2%-161.8% of the extension of the AB line or the 78.6% retracement level of line XA.
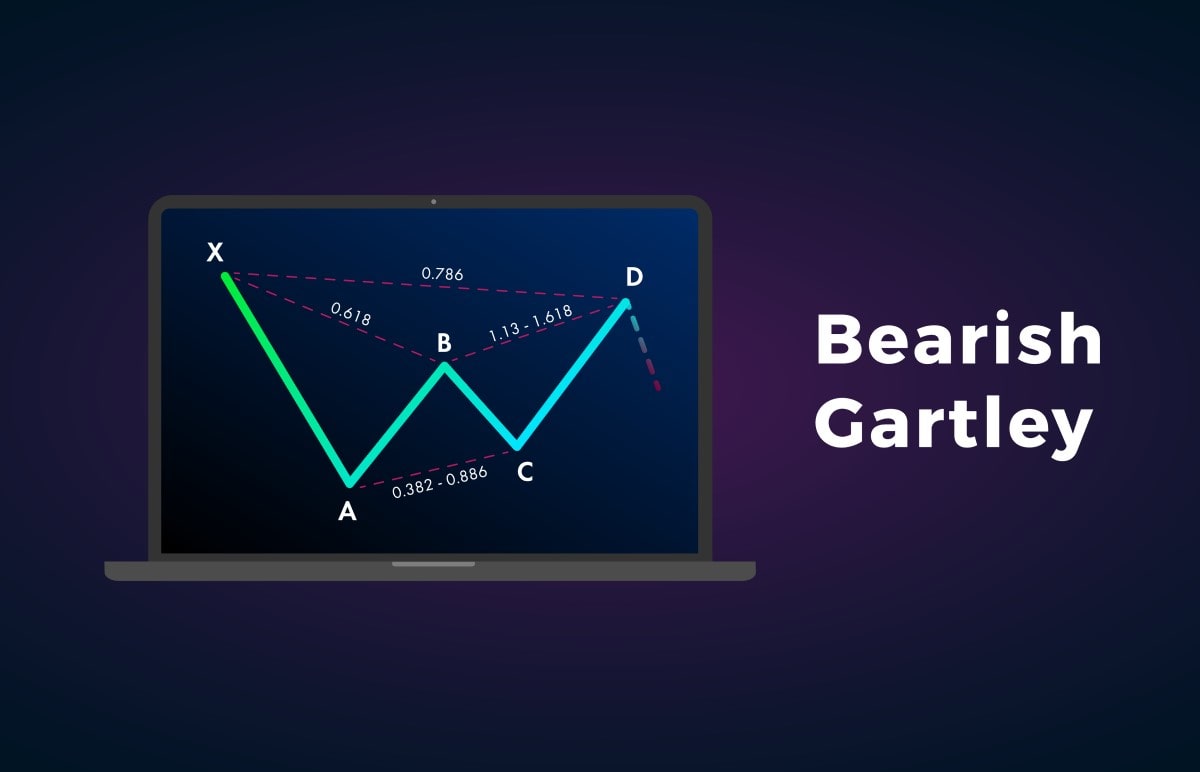
When defining Take-Profit levels, look at 61.8% of the CD line. Another Take-Profit level can be found regarding the length of the XA line set from point D.
Crab
Crab is a harmonic pattern based on the Gartley Pattern. Here are several features of the pattern that differentiate it from other harmonic schemes. The XA and CD lines are long, and point D is far and located beyond point X.
Crab parameters:
- Point B lies at the 38.2-61.8% retracement level of the XA line.
- Point C should be at the 38.2%-88.6% retracement level of the AB line.
- Find point D at the 224%-316% extension of the AB line or the 161.8% extension of the XA line.
- The position of point D defines the strength of the signal. If it's close to the 161.8% extension of X, the pattern's signal is more robust.
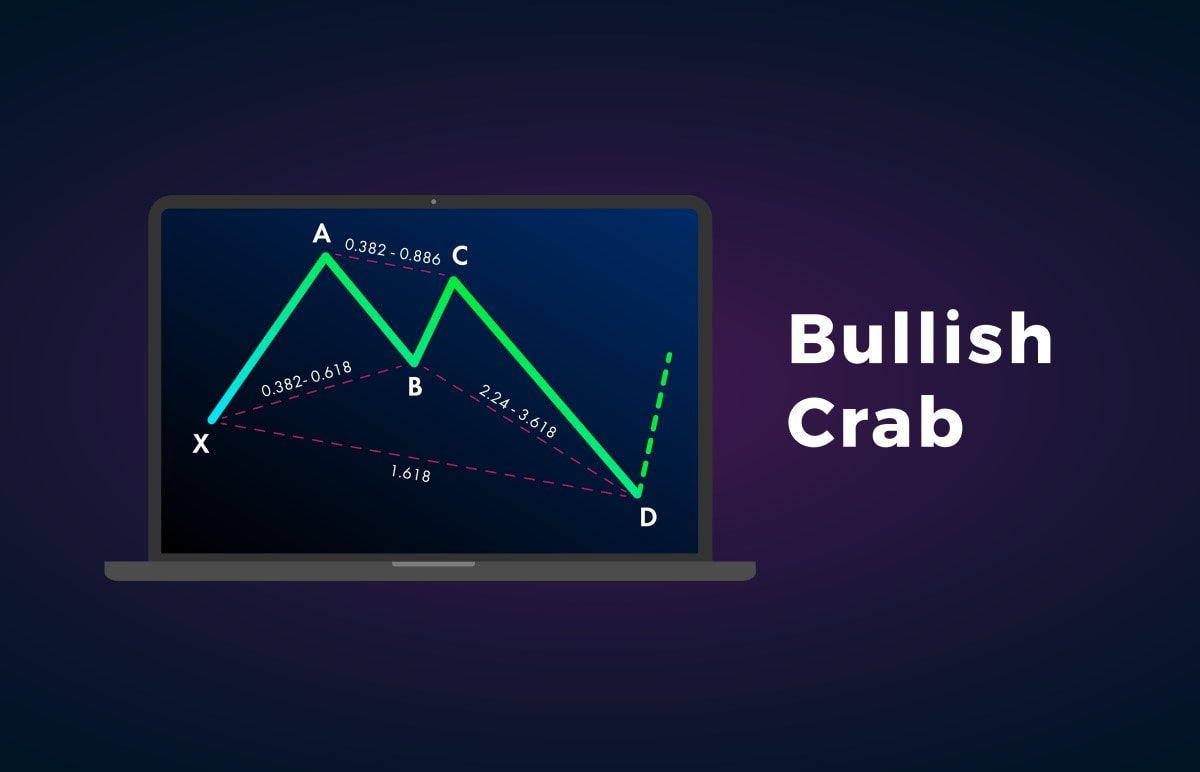

Take-Profit should be set in advance. The Take-Profit level can be at 61.8% or 127.2% of the CD leg.
Bat
Bat is another variety of the Gartley Pattern. The main difference is Fibonacci ratios that determine the location of the main points.
These are the main settings of the pattern:
- Point B should be placed at the 38.2-50% retracement level of line XA.
- Point C should be at the 38.2%-88.6% retracement level of line AB.
- Point D is at the 161.8%-261.8% extension of line AB or the 88.6% retracement level of line XA.
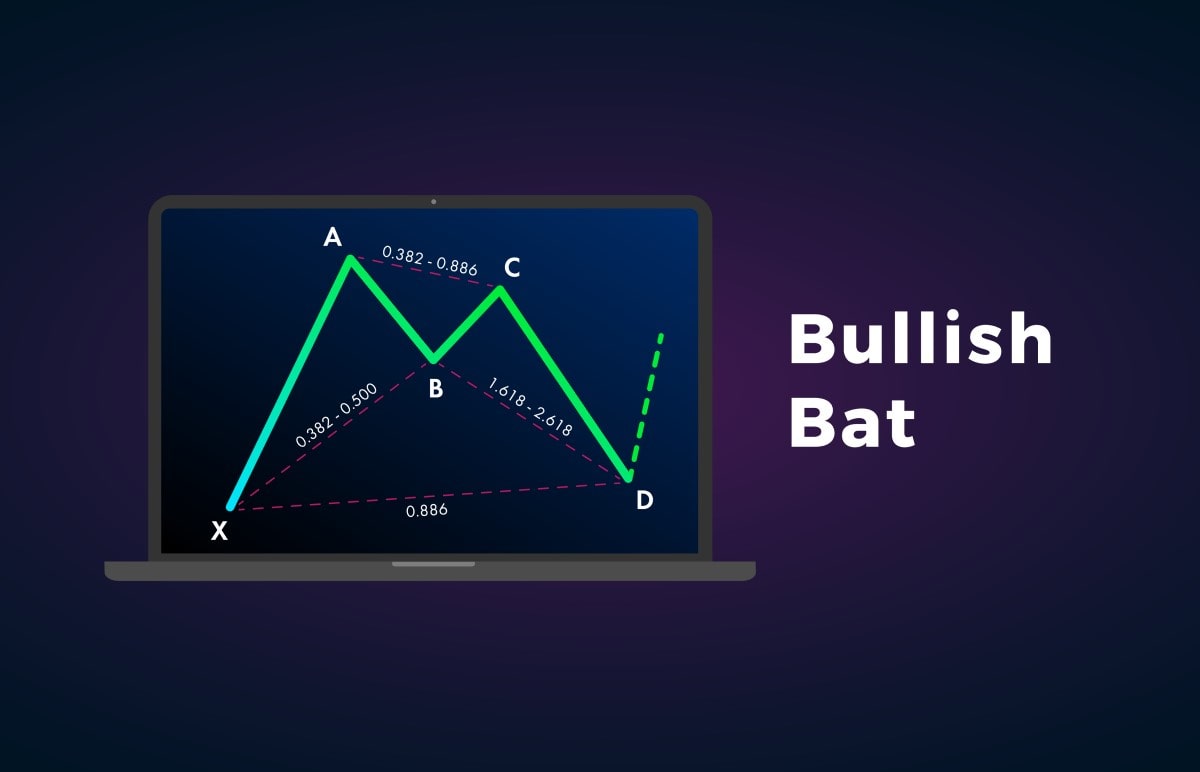
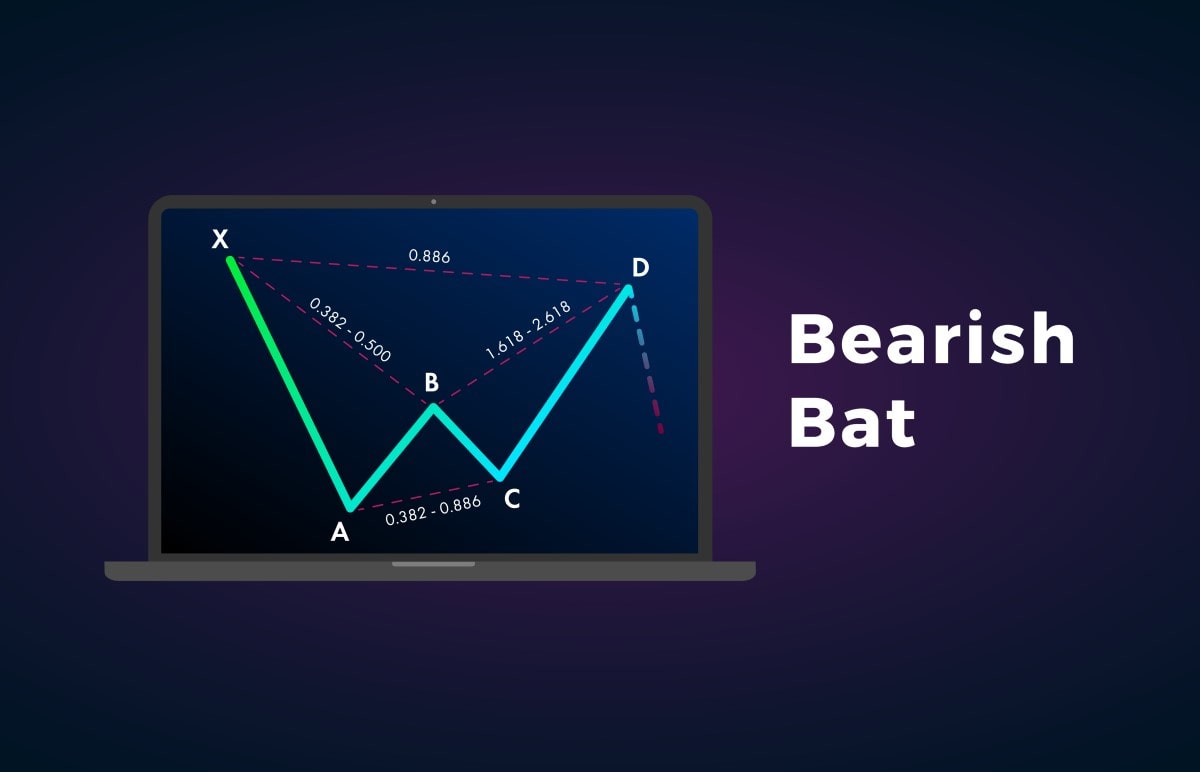
Take-Profit orders can be placed at the 61.8% or 127.2% retracement level of line CD. Also, the Take-Profit can be at the projection of line XA from point D.
Butterfly
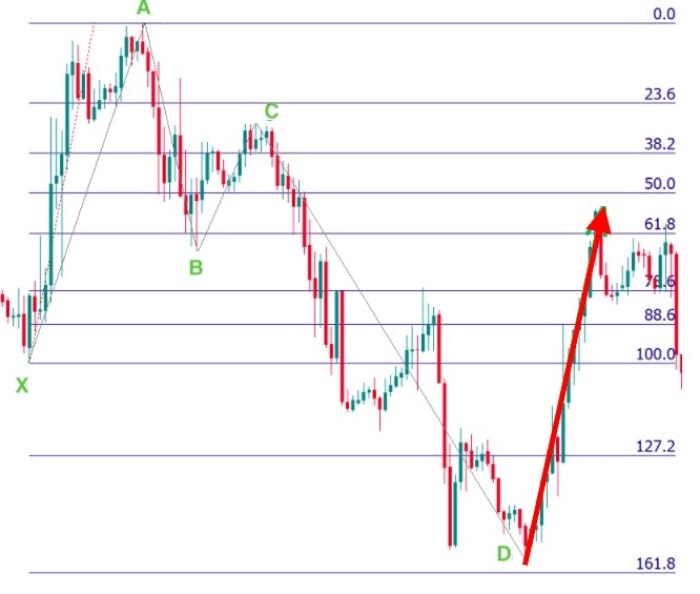
Bryce Gilmore and Larry Pesavento discovered the Butterfly pattern. The Butterfly is formed near significant highs and lows.
Look at the significant features of the pattern:
- Line CD should extend beyond line XA.
- Point B should be at the 78.6% retracement level of line XA.
- Point C is at the 38.2%-88.6% retracement level of line AB.
- Point D is located at the 161.8%-261.8% extension of line AB or the 127.2%-161.8% extension of leg XA.
- The Gartley Pattern's critical difference is that D is not at the retracement of line XA but its extension.
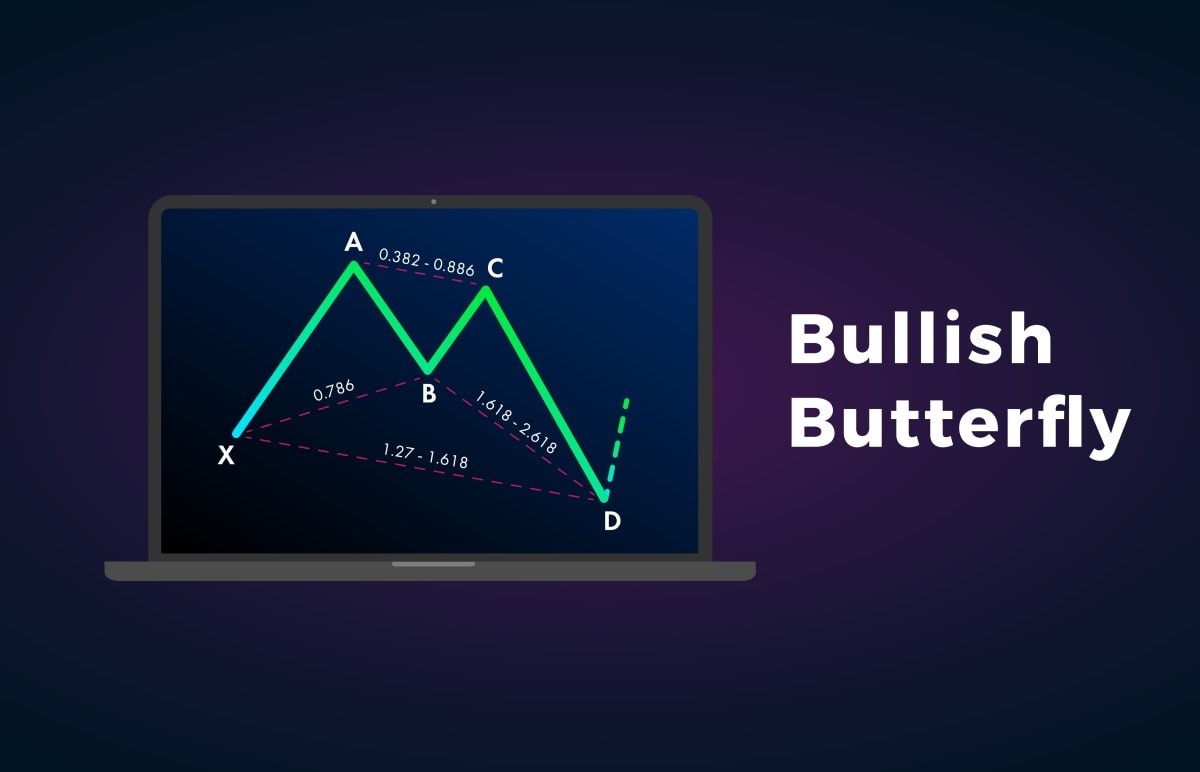
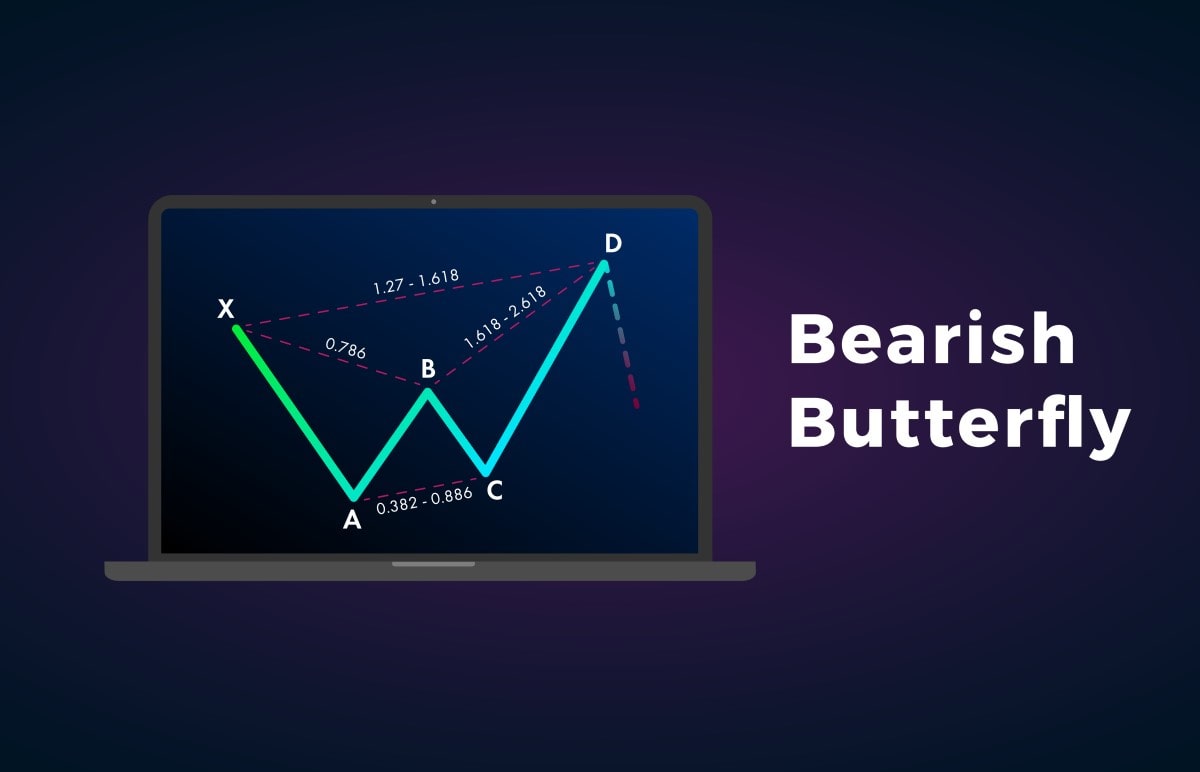
Butterfly Take-Profit levels can be located at the 61.8% or 127.2% retracement level of line CD. Points B and A can be chosen as target levels.
Shark
Scott Carney found this type of harmonic pattern, which is usually marked with different letters: 0, X, A, B and C.
In all the patterns mentioned above, the second top in the bullish form is lower than the first one, while the second bottom in the bearish pattern is higher. Look at the perfect Shark Pattern below. In the bullish pattern, the second top is higher.
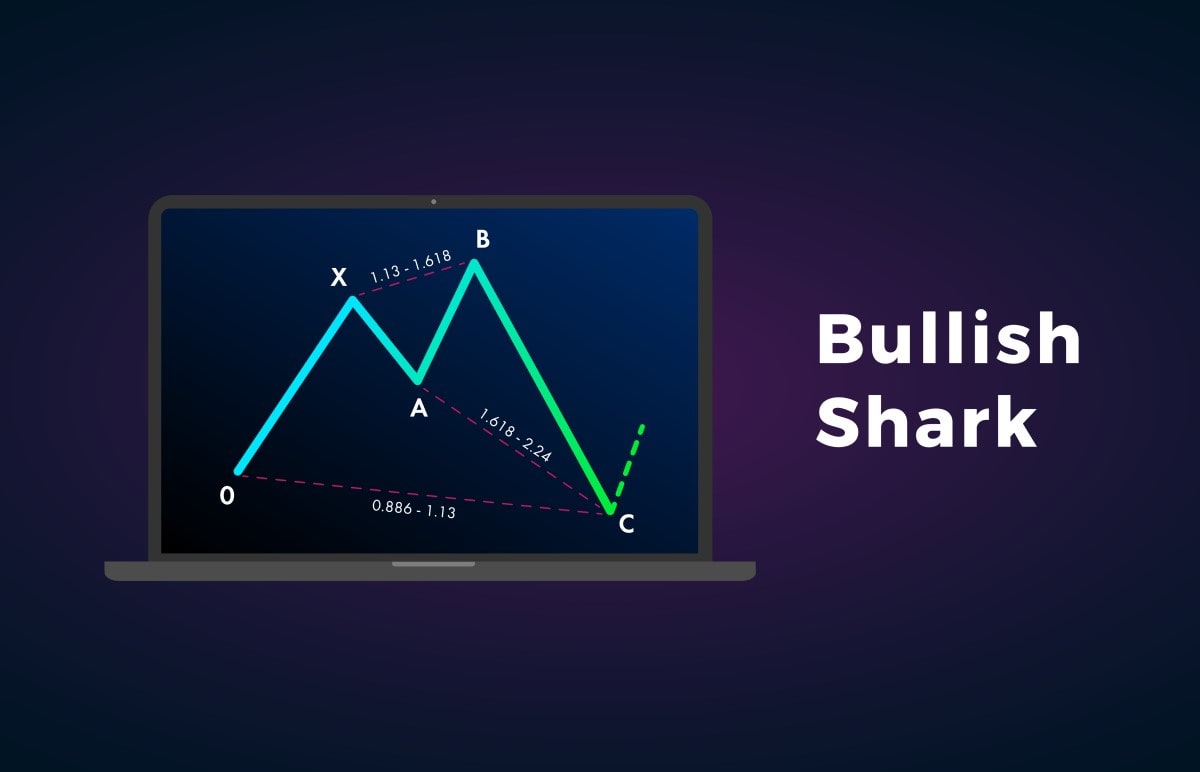
To build the pattern, you should use Fibonacci and Elliott Waves Theory. There can also be a 113% ratio.
Features of the Shark Pattern:
- Point A can be located anywhere.
- Point B should be at the 113%-161.8% extension of line XA.
- Point C resides at the 113% extension of 0X and the 161.8%-224% extension of line AB.
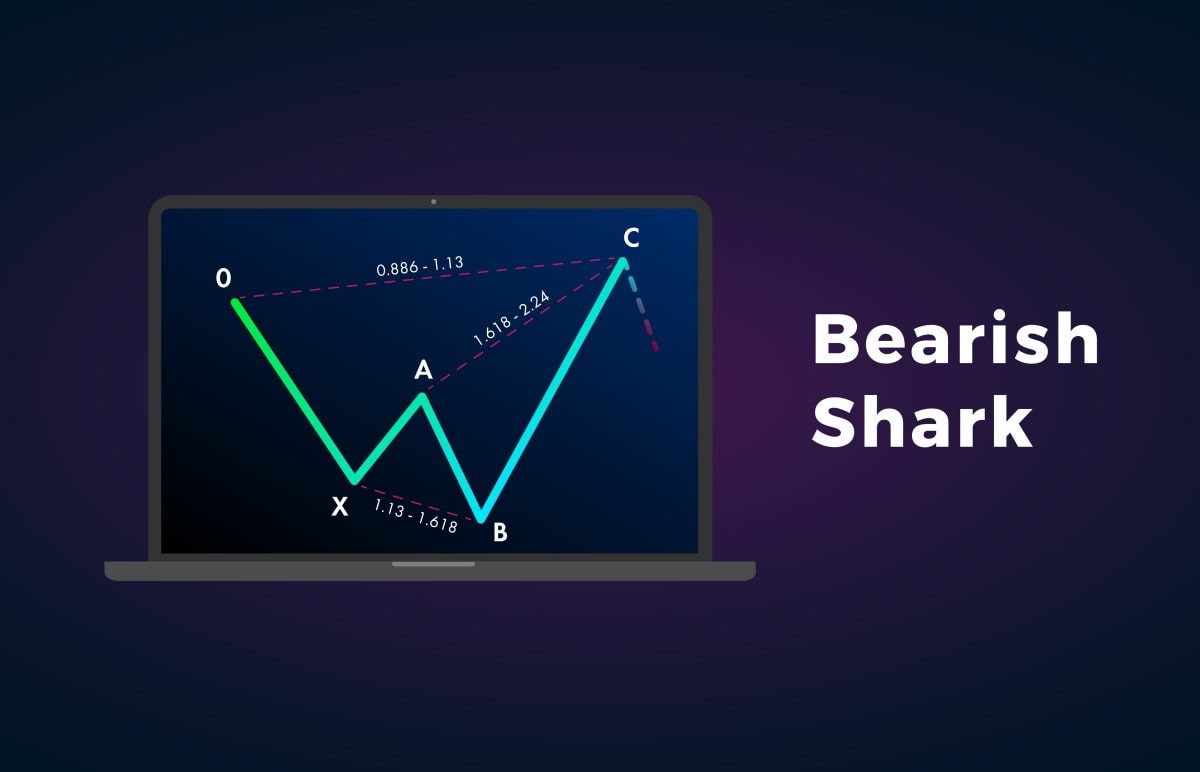
When trading the Shark Pattern, place Take-Profit orders at 50%-61.8% of leg BC. The Stop-Loss can be found at point C.
The Three Drives Pattern
This pattern doesn't look like other harmonic patterns. It's represented by a series of higher highs or lower lows. The three drives pattern includes five legs.
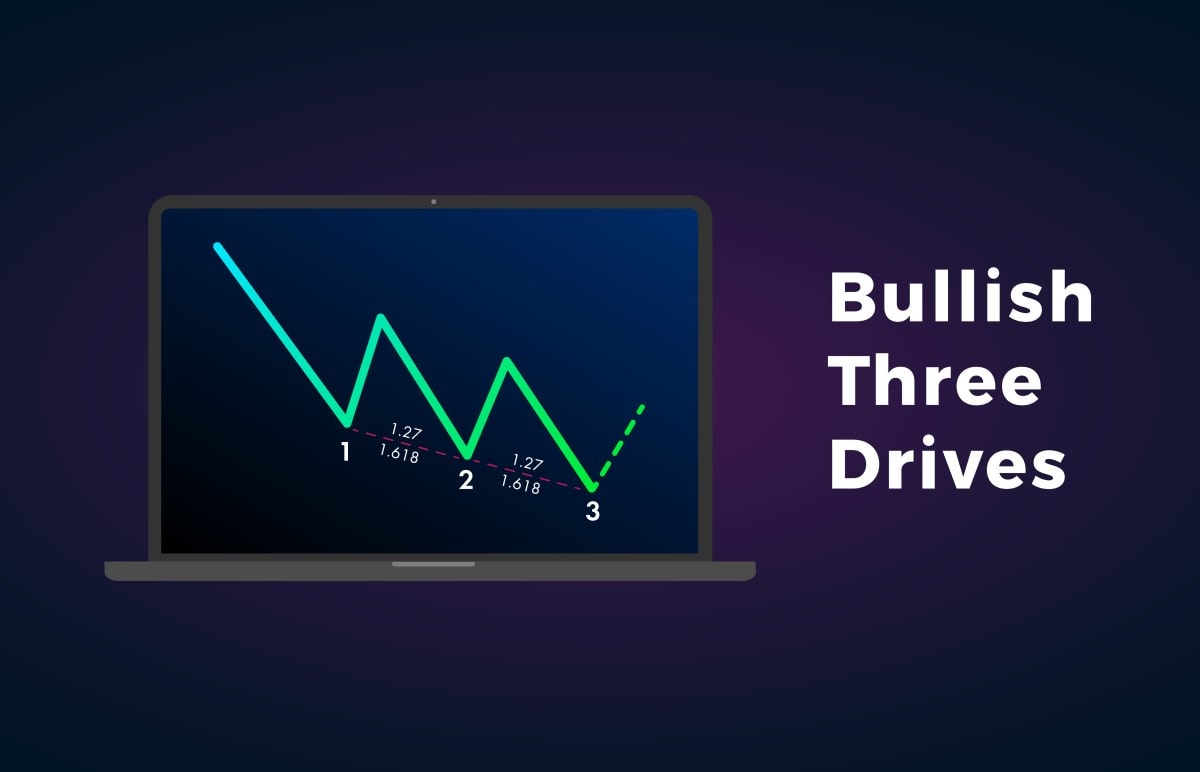
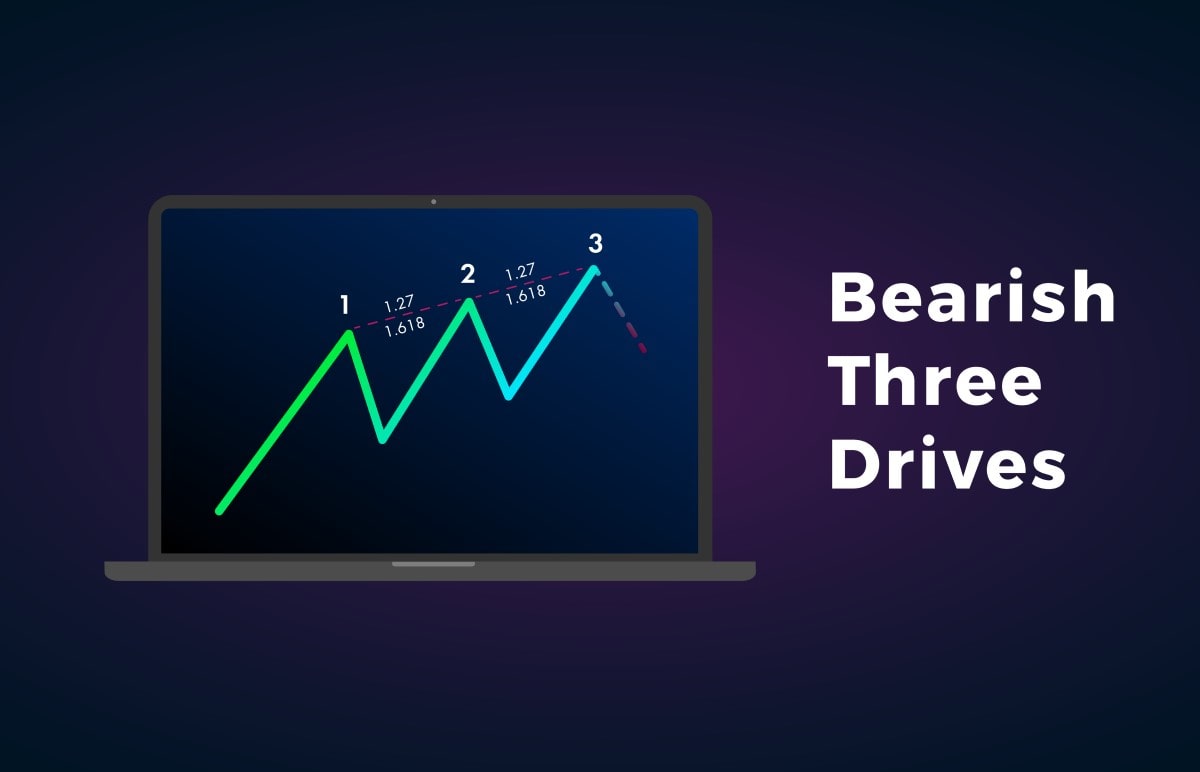
Look at the basic settings below:
- Point A should be placed at the 61.8% retracement level of drive 1.
- Point B can be found at the 61.8% retracement level of drive 2.
- Drive 2 is at the 127.2%-161.8% extension of point A.
- Drive 3 is at the 127.2%-161.8% extension of point B.
- A and B corrections and drives 2 and 3 should be equal.
The Take-Profit level is found at the 127.2%-161.8% extension of point B.
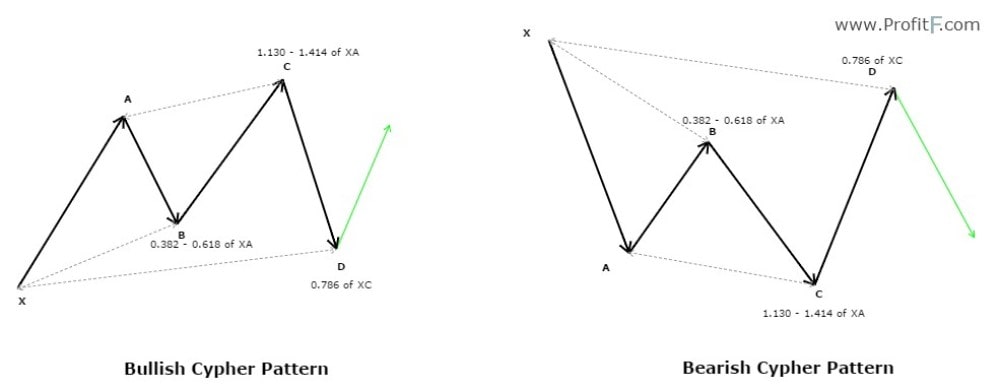
Cypher
The pattern consists of four legs and five reversal points, the same as other harmonic trading patterns. To define the pattern, you need to draw the impulse leg named XA, followed by the retracement level of leg AB. The AB should at least reach the 38.2-61.8% Fibonacci retracement level of line XA.
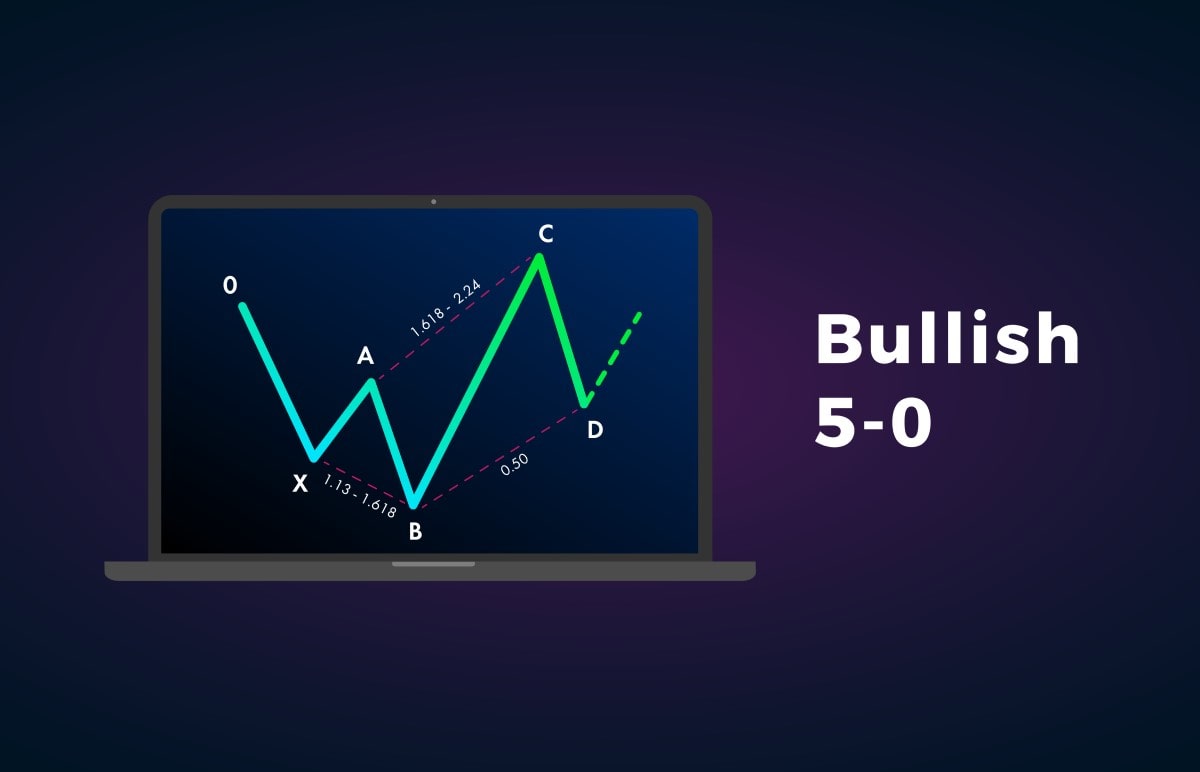
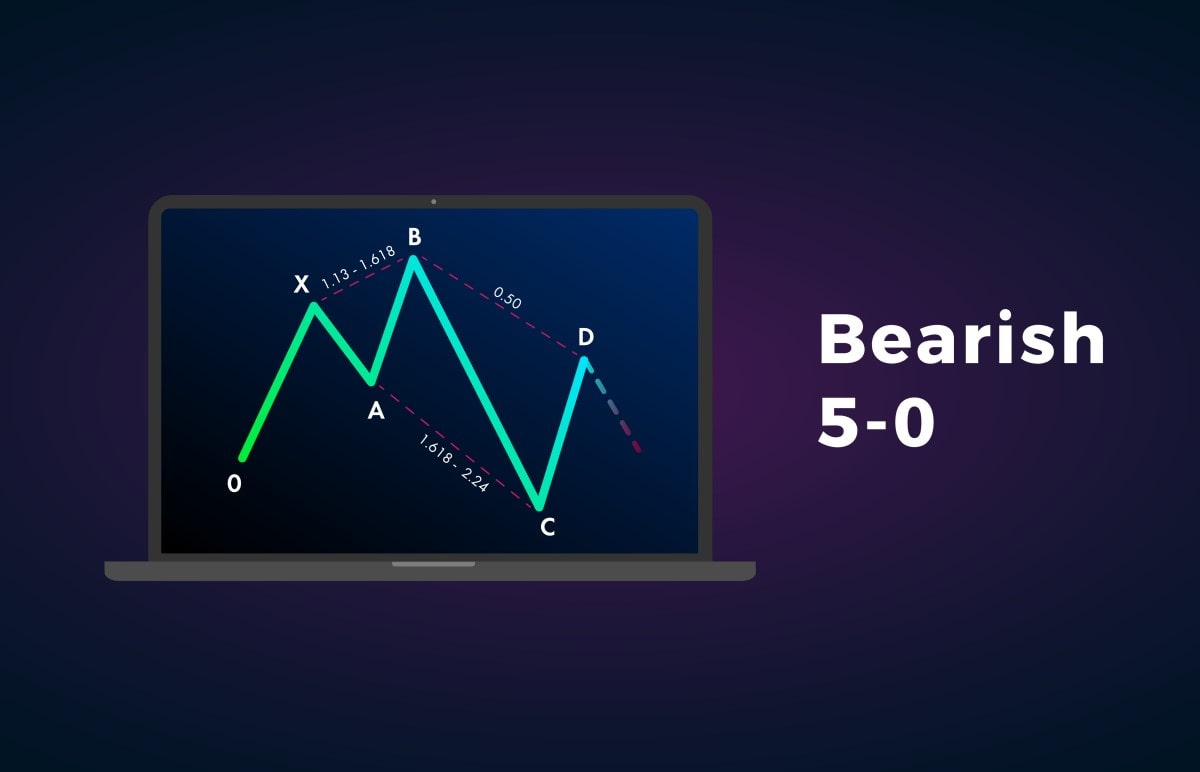
5-0
The 5-0 pattern was discovered by Scott Carney. It's a typical harmonic pattern that consists of five legs.
Key settings:
- AB is at the 113%-161.8% extension of XA.
- BC can be found at the 161.8-224% extension of line AB.
- CD is at a 50% retracement of line BC.
Harmonic Patterns Benefits and Drawbacks
We have focused on the complexity of the harmonic trading patterns. Still, they have many benefits.
|
Benefits |
Drawbacks |
|
Reliable signals. Harmonic patterns provide a high degree of accuracy. |
Complicated. If you're a newbie harmonic trader, you probably have a hard time applying these patterns to the chart. |
|
Advanced skills. If you know how to draw these patterns, you won't have difficulties with other tools. |
Time. Because the patterns are based on specific Fibonacci levels, it takes time to draw them. |
Trade Harmonic Patterns: A Beginner's Guide
We gathered several tips on how to trade harmonic patterns.
Open trades only after the harmonic pattern is formed.
- Choose the pattern you want to trade. It can be challenging to remember all the settings. That's why we recommend choosing the most straightforward pattern and starting with it.
- Use Fibonacci tools to draw the pattern. Later, we'll explain how to place the pattern in MetaTrader 4.
- Define the Take-Profit and Stop-Loss levels in advance. The Stop-Loss level is always placed following risk management rules. We mentioned standard Take-Profit levels above, but follow the market. Using Trailing Take-Profit, you can change the levels regarding market conditions.
- Open trades only after the harmonic pattern is formed.
How to Draw Harmonic Patterns
To apply a harmonic pattern, you need standard tools implemented in any trading platform, including MetaTrader 4.
- First, define the pattern by eye. As you'll notice, most of the harmonic patterns have four legs and five reversal points.
- Second, apply Fibonacci levels on the price chart.
- After that, you can use a ZigZag indicator to draw the pattern lines or use trend lines to highlight parts of the pattern.
If you're not experienced enough, you can buy an indicator for MetaTrader. There are different varieties of this indicator, and you can choose one based on reviews.
Harmonic Trading: Real Examples in the Forex Market
It looks simple when you just read the rules of the pattern, but it becomes more complicated when you try to find patterns on the price chart. Look at the real examples.
ABCD
You should enter the market only if the price reaches point D. To find the price swings of the ABCD pattern, use the ZigZag indicator.
The ABCD pattern can be bullish and bearish. When trading the bullish pattern, look for point C to be below point A. At the same time, it should be a medium high after point B. Point D is supposed to be below point B.
To be sure of a trend reversal, wait for confirmation. The best option is to find a reversal candlestick.
Gartley
If you trade a bullish pattern, point D is your entry point. Like other harmonic patterns, you need to find confirmation in the form of a reversal candlestick or a technical indicator.
A Take-Profit order can be placed at the 61.8% retracement level of line CD or be equal to the size of line XA line projected from point D. The Stop-Loss order should be appropriate based on risk management and be above point X in the bearish pattern or below point X in the bullish one.
Crab
On the chart below, you see an example of the bullish crab pattern. To build your trade, follow the rules:
- Enter the market at point D, but wait until the market reverses from line CD.
- Take-Profit orders can be found at the 61.8% or 127.2% retracement level of line CD.
- Stop-Loss orders should follow risk management rules.
Conclusion
To conclude, harmonic patterns provide reliable signals. These patterns are one of the most accurate tools for traders. Yet, it's not easy to find them on the price chart. Any mistake will cost you a successful trade. That's why it's vital to practice on a demo account with fake money.
Use a Libertex demo account to build your favourite harmonic patterns. Price movements differ based on the asset you trade. A Libertex account allows you to trade currency pairs and CFDs. Draw harmonic patterns at different securities.
FAQ
What Are Harmonic Patterns?
Harmonic patterns are chart patterns drawn using Fibonacci tools
Do Harmonic Patterns Work?
Harmonic patterns provide signals with a high degree of accuracy. If you know how to draw them on the price chart, you'll get reliable alerts.
Which Harmonic Pattern Is the Best?
There is no best harmonic pattern. Still, if you want to be fully equipped, you should start with the ABCD pattern, which serves as the basis for other harmonic tools.
How Do You Make a Harmonic Pattern?
To draw a harmonic pattern, you should use Fibonacci tools, lines or a Zigzag indicator.
What Is a Bullish Harmonic Pattern?
A bullish harmonic pattern provides a signal of the trend's upward reversal.
Are Harmonic Patterns Potentially Profitable?
Harmonic patterns are complicated but potentially profitable if you know how to build them.
Disclaimer: The information in this article is not intended to be and does not constitute investment advice or any other form of advice or recommendation of any sort offered or endorsed by Libertex. Past performance does not guarantee future results.
Why trade with Libertex?
- Get access to a free demo account free of charge.
- Enjoy technical support from an operator 5 days a week, from 9 a.m. to 9 p.m. (Central European Standard Time).
- Use a multiplier of up to 1:30 (for retail clients).
- Operate on a platform for any device: Libertex and MetaTrader.