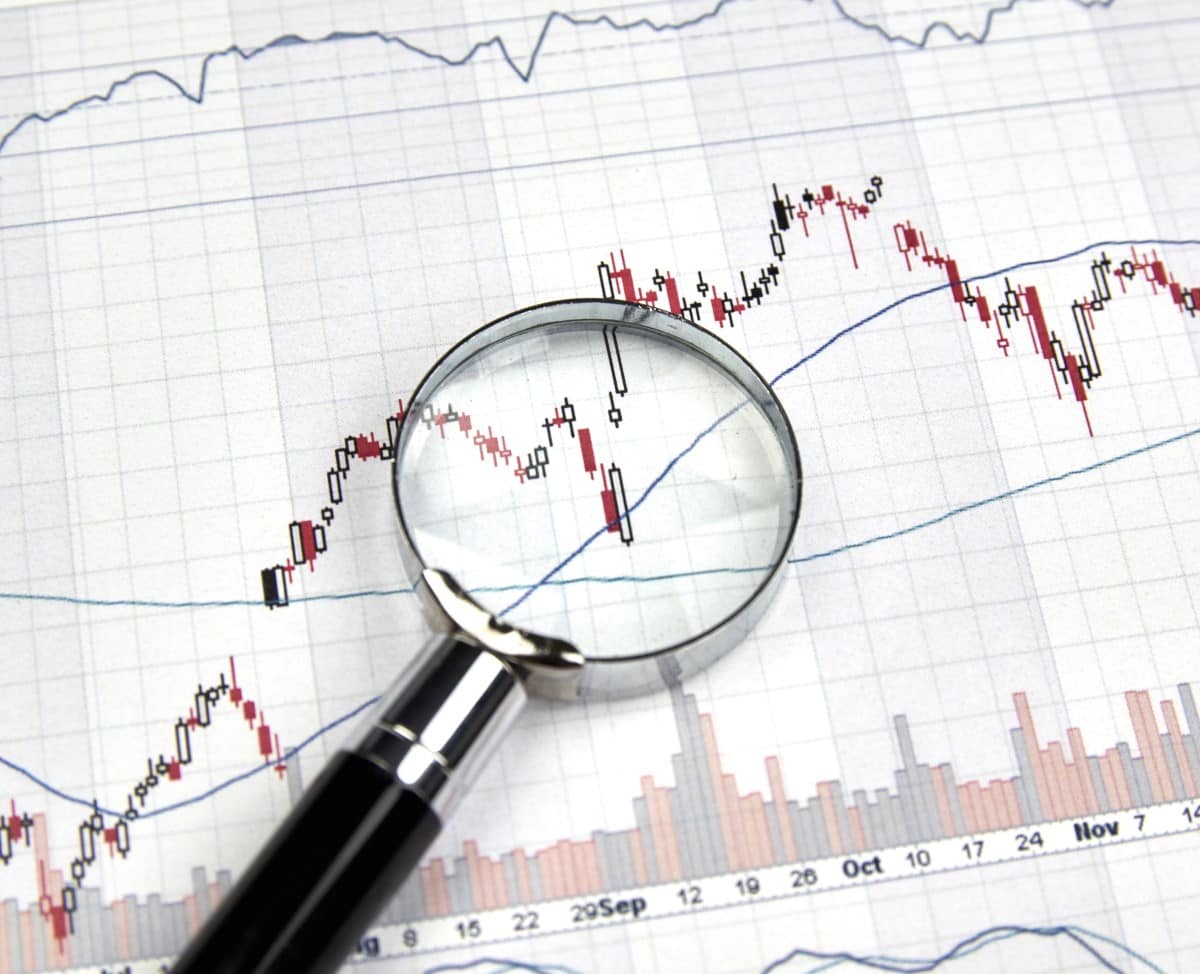
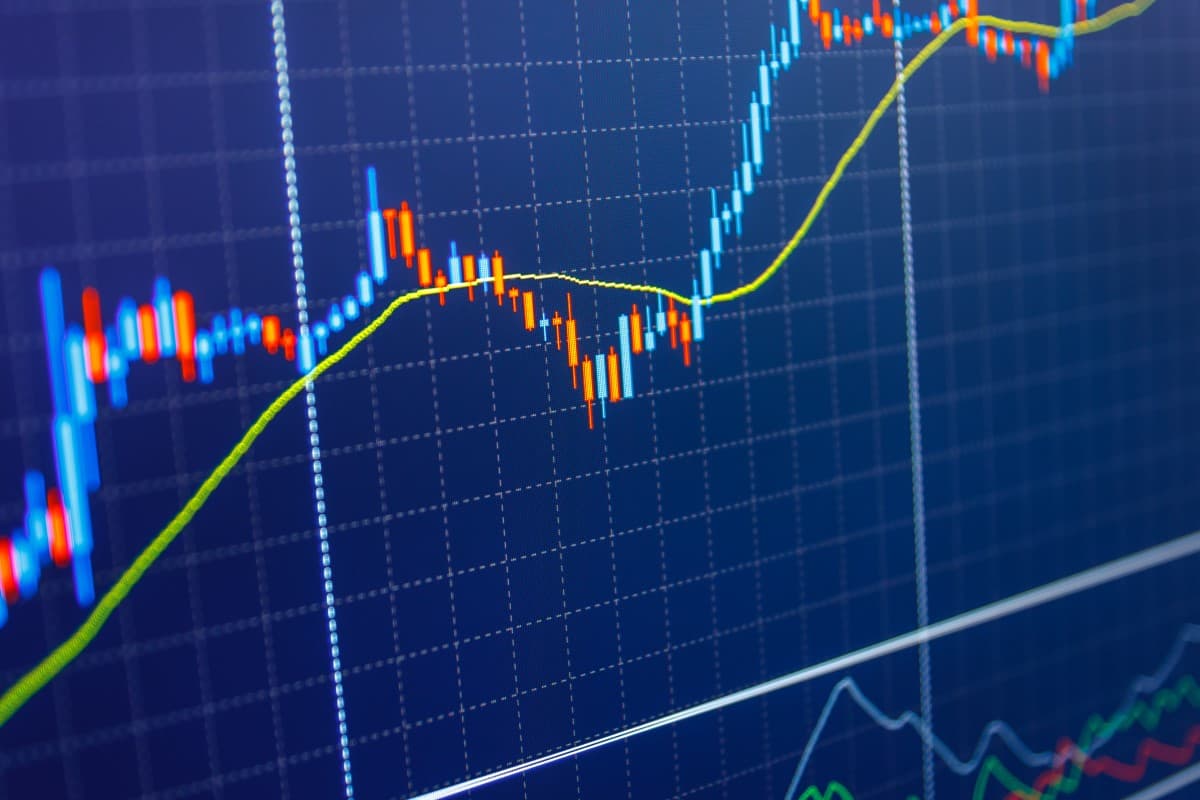
What Are Gaps?
Prepared by the Libertex team
Content reviewed internally in accordance with regulatory standards.
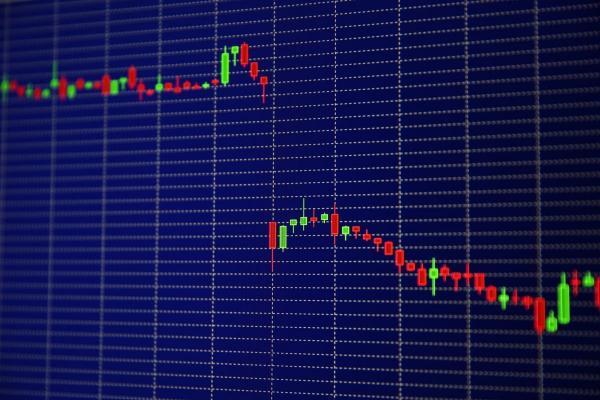
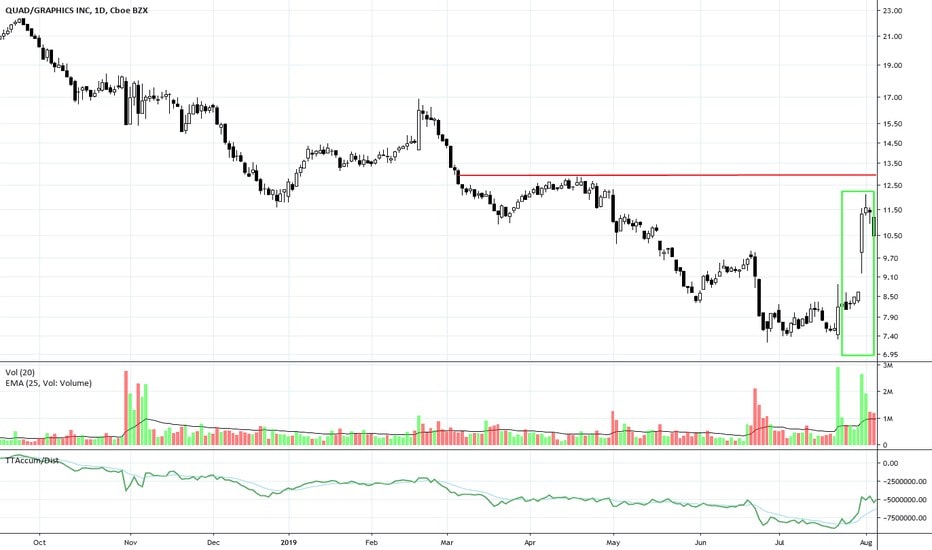
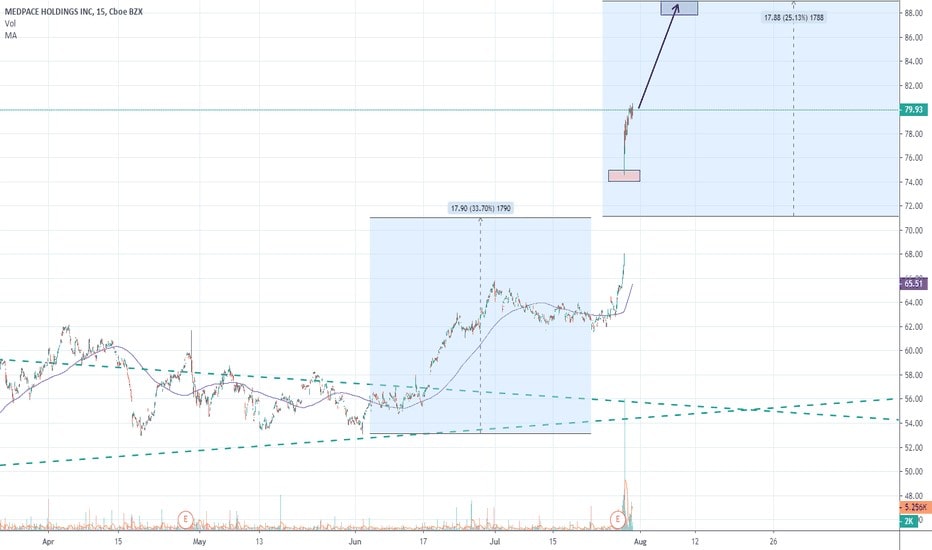
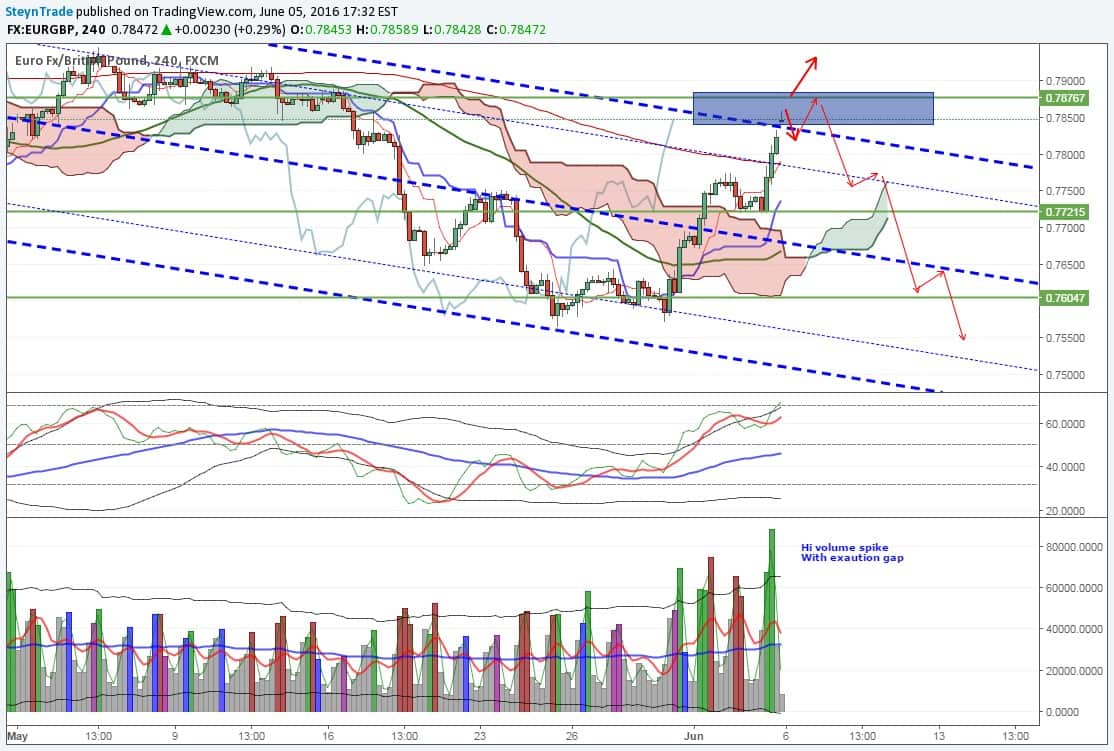
A gap is a space on a chart where a security's rate both increases or decreases from the preceding day's ending with no trading activity happening between these time intervals. As a consequence, the asset's chart reveals a gap in the standard price pattern. The ambitious trader can understand and use these gaps to potentially gain profit.
Generally, candlesticks on a forex chart open at the same level where the last candle was closed after the end of the trading session. After that, a new candle is opened immediately.
That is what happens in typical situations. Despite that, when a gap performs on the chart, you see a possible divergence between the starting and the ending price of the two connecting candles.
A gap is a space of a chart where a security's rate changes with no trading activity happening in between.
What Is Gapping?

Gapping is when a stock or different trading asset opens over or under the preceding day's end with no trading action in between.
For example, the share price picked at $338.00 at closing on Wednesday and opened at $356.40 on Thursday, with no trading happening between these times. This unfilled interval looks like a gap on the chart.
What Causes Gaps in The Market?
Gapping in the market happens due to many factors. Here are the most common of them:
Political Events
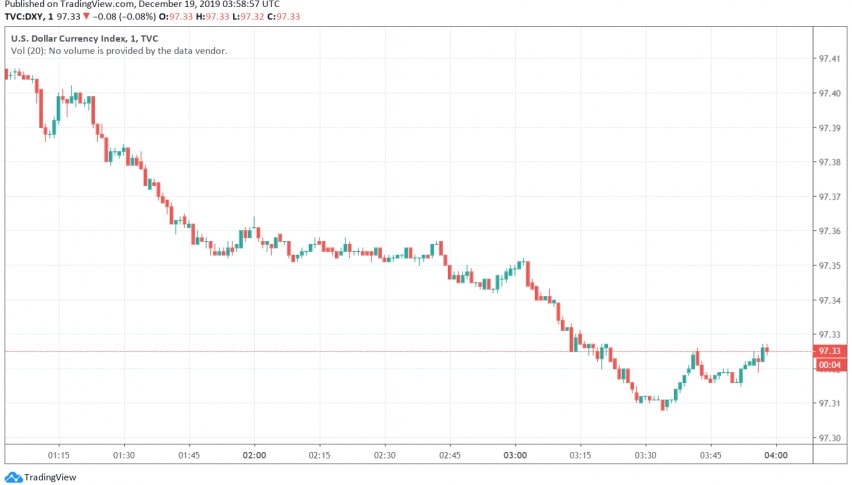
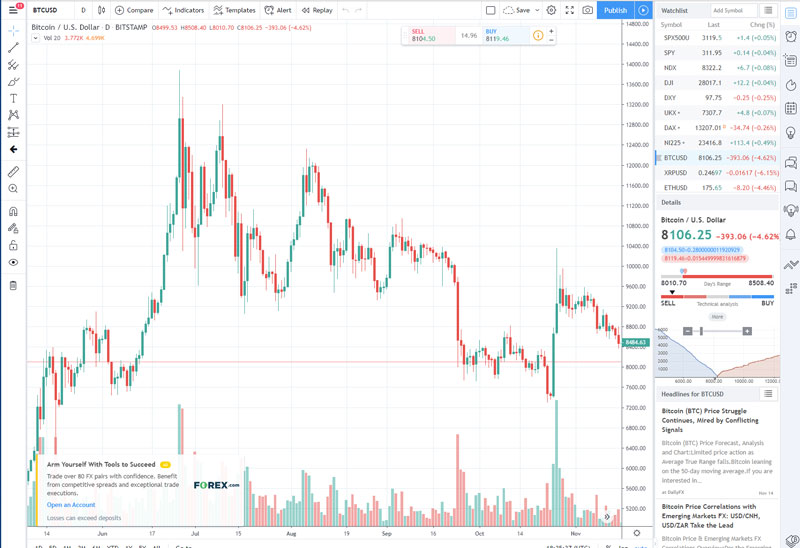
Some of these events are essential. For example, the US dollar has decreased slightly after trading steady among other global currencies, presenting a small gap after news emerged that former US President Trump had been impeached. On 19 December 2019, the US dollar index DXY was trading at 97.33.
Economic Events
Significant economic moves can change not only a single position on the market; some of them can affect the global economic landscape. That's what happened on Black Wednesday in 1992 when, between September and December, the GBP/USD declined by about 25% to 1.5057. Furthermore, there was no trading activity in that period.
Natural Disasters
The result of a natural disaster may cause a catastrophe for a country. Earthquakes, floods and hurricanes hurt a country's residents, confidence and infrastructure. Such disasters also harm a nation's official currency.
For example, Hurricane Harvey led to instability at the absolute worst time for markets. A previously weak dollar dropped to a one-and-half-year low against a currency basket.
The USD index fell to 92.501 by 28 August 2017 and had previously dropped to 92.372, the lowest position since early May 2016.
In brief, gaps are mostly built by significant changes, making it all the more valuable for traders to remain up-to-date on economic and geopolitical matters.
Gap Types
There are four types of gaps, excluding the gap that happens because of a stock reinvestment. Each type has its unique implications, so it's crucial to be able to select between them.
Common Gaps
They can develop from a stock reinvestment when the trading volume is low. These gaps are common and typically get filled almost immediately. 'Getting filled' means that the price action in the last few days or weeks usually returns at the lowest value to the previous day before the gap. This is also known as 'closing the gap'.
A common gap appears typically in a range-bound or congestion zone, where it strengthens the apparent absence of interest in the stock at that time. It's frequently increased to a higher extent by low trading volume.
Being conscious of these types of gaps is useful, but it's questionable that they'll provide trading opportunities.
Breakaway Gaps
It's a new trend where the asset 'gaps away' from the price pattern. If a breakaway gap is followed by higher trading volume, it may be worth opening a long position for a breakaway gap up and a short position for a breakaway gap down on the candlestick next to the gap.
Runaway Gaps
Runaway gaps are gaps caused by heightened interest in a stock. Runaway gaps usually describe traders who didn't get in through the first move of the uptrend and, while waiting for a temporary reversal in price, decided that it wouldn't happen.
Elevated buying interest appears suddenly, and the price gaps over the past day's ending. This kind of runaway gap describes a state of trader panic. Also, a good uptrend can have runaway gaps caused by significant news and events that produce new interest in the stock.
Exhaustion Gaps
In contrast to runaway gaps, there are occasions when the price does a final gap in the trend course but then shifts. It's often caused by a crowd mentality of traders racing to the trend and pushing the stock into the overbought area.
Accordingly, skilled traders will be waiting for the withdrawal and get the opposite position to the previous direction.
All of these kinds of gaps can be full or partial gaps. Common gaps are usually partial gaps, as the rate doesn't move substantially. Though, in some cases, the cost may not change much; in the end, it'll be a full gap. Breakaway, runaway and exhaustion gaps tend to become full gaps.
Gaps are classified as breakaway, exhaustion, common or continuation. The classification is based on when they happen in a price pattern and the meaning of the signals.
Gap Trading Basics
Now that you're acquainted with the various types of gaps, we'll talk about a few strategies for trading gaps in forex.
First, when trading gaps, it's essential to learn that price may not start rapidly moving in the expected direction. In many cases, a recovery move will arrive, filling part or the entirety of the gap space. Otherwise, you may even detect a false signal made by the gap. Let's review some different forex gap trading methods that will help you make the decision.
Gap Trading Strategies
Some traders use gaps for analytics. For example, if a gap happens almost at the start of a trend, then it's a breakaway gap or a runaway gap. It lets the trader understand the possible price.
Other traders use gaps for trading objectives. They may open positions after a gap happens. Let's take a look at some of the most effective strategies.
Buying the Gap
Traders usually call this strategy a 'gap and go'. A position could be taken at the moment the stock gaps with a stop order traditionally placed low under the gap bar. The gap should happen above a critical resistance and trade on heavy volume to enhance the possibilities of a successful trade. And conversely, traders could remain for prices to fill the gap and set a limit order to buy the stock almost before the preceding day's ending.
Selling the Gap
This strategy is related to the previous one. In this case, the trader opens a short position following a gap down.
Fading the Gap
Contrarians may apply a fading strategy to use gapping. Traders can get a trade in a different area of the gap under the assumption that most gaps tend to be filled over time. A stop-loss order is placed over the gap bar's high, developing a gap up, with a profit mark set near the preceding day's ending. For a gap down, the trader puts a stop-loss under the gap bar's low and sets a profit target near the previous day's close.
Gaps as An Investing Signal
Breakaway and runaway gaps can both indicate that there's more trend left to hold. Following one of these gaps, a long-term investor may open a position in the gap area (usually watching for gaps above).
They may hold onto the trade until an exhaustion gap happens or until a trailing stop disappears, giving them a reason to quit.
There are three main trading strategies: Buying the Gap, selling the Gap and fading the Gap.
How to Play the Gap in The Market
Let's review all the steps using the example of common or weekend gaps. Fans trade the weekend gap by requiring Sunday's opening price to be a replacement for Friday's closing price. Here's one of the forex gap trading strategies:
- Open a chart with the common gap.
- Find a chart pattern.
- Following the price gaps, place the first candle above or below the base of the gap.
- Enter quickly (aggressive entry) or enter at the recess of the candle high (conservative entry).
- Stop-loss orders are set under or over the candlestick's high/low.
- The target is the gap close or three pips above/below it.
Gap trading is complicated, but if you understand which gaps are tradable and which aren't, trading them should be more manageable. Try to find different gaps on your chart and examine how the price works after a gap forms. Finally, yet importantly, always manage risk!
Conclusion
Now, when you understand what large gap trading is and how you can take the upper hand, you should start practising trading. Learn how to trade big gaps before you start with real money.
Finally, Libertex provides the ability to trade, anytime you want.
Ready to practise your skills and without any risk? sign up for a free demo account now!
FAQ
What does a gap in the market mean?
A gap is a term used in technical analysis, which signifies a space on the chart where no trading took place. It occurs when a security's price moves sharply up or down.
What is a gap up and gap down in the stock market?
A gap up means that the highest price of one trading day was lower than the lowest price of the following day. A gap down means that the lowest price was higher than the highest price the following day.
How do you know the stock will gap up?
Some indicators include overnight news (political, economic, environmental) and companies suddenly releasing their earnings statements. However, there are no perfect indicators to predict a gap up opening.
What is a gap and go strategy?
Sometimes when security has gained momentum during the trading day, it continues the move in the same direction. If traders identify a gap up, they can go long; if the stock has gapped lower, they can go short.
What does gapped mean in the stock market?
It means the price movement backtracks to a similar value as the day before the gap. This is also called filling the gap' and 'closing the gap'.
Disclaimer: The information in this article is not intended to be and does not constitute investment advice or any other form of advice or recommendation of any sort offered or endorsed by Libertex. Past performance does not guarantee future results.
Why trade with Libertex?
- Get access to a free demo account free of charge.
- Enjoy technical support from an operator 5 days a week, from 9 a.m. to 9 p.m. (Central European Standard Time).
- Use a multiplier of up to 1:30 (for retail clients).
- Operate on a platform for any device: Libertex and MetaTrader.