From the fear of inflation to fear of recession

Ready to Start?
Join thousands of Libertex users.
83% of retail investor accounts lose money
First things first
Markets are in chaos, and there are massive sell-offs. The S&P 500 index had its worst H1 since the early 1970s, and the collapse of the crypto market led to record sell-offs of digital assets by crypto traders and even miners, as the cost of mining appeared to be higher than the market price.
At the end of January 2022, investors feared an acceleration in inflation, but what appeared to be a simple correction at the start of the year turned out to be the beginning of a deep decline. When it became clear that central banks could not control price rises by raising interest rates and tightening monetary policy, investors became depressed and began to sell off even more. Companies and consumers are now haunted by inflation and the rising cost of borrowing and servicing debt, which reached record highs during times of zero-per-cent interest rates.
As a result, companies' costs are rising, logistics remain expensive due to high oil prices, and consumption is falling or threatening to fall. All of this is happening amid a rollback in stimulus funding and a tightening of central banks' monetary policy. The war in Ukraine, sanctions against Russia, energy blackmail and political risks are adding to the uncertainty. The prospect of a recession on the horizon is clearly visible. And if risk aversion mode is triggered in the markets, almost all types of assets, from equities and bonds to cryptocurrencies, will be affected.
But even in the darkest of times, rays of light remain in the market, illuminating small islands of stabilities that provide potential investment opportunities. What's more, when you trade with Libertex, you always have the option to open both buy and sell positions, which means you can always capitalise on the decline in an asset's value.
Before moving on to analysing market sectors, we'll note one important feature of market behaviour during periods of instability. Typically, markets begin their decline eight months before the recession itself begins and bottom out within four months after they start to fall. As such, we may be close to the low point. Be sure to pay attention to the cryptocurrency market, too. As the riskiest market, it'll be the first to show signs of investors returning to high-yielding assets.
Currency and precious metals market analysis
Currencies and metals. Where to look for concerns
The world hadn't yet managed to fully recover from the consequences of the COVID-19 pandemic when new risks appeared on the scene. This time, however, they're geopolitical in nature. The armed conflict in Ukraine and the wide-scale economic sanctions against Russia because of it have heavily impacted practically the entire world economy.
Increased energy prices and disrupted logistics chains have caused the prices of most consumer goods and services to rise, which has resulted in a sharp increase in price pressure. In the United States, the United Kingdom and Eurozone countries, inflation has reached forty-year highs. As this happens, central banks have been forced to tighten their monetary policies, increasing interest rates and rolling back their quantitative easing programmes.
It's worth remembering, however, that in the last three years, economic growth was sustained due precisely to massive liquidity injections from national regulators. A complete 180° reversal is now taking place.
When markets see flight from risk en masse, one needs to find financial instruments that make it possible to diversify portfolios and, if not increase capital, at least keep them from losing value.
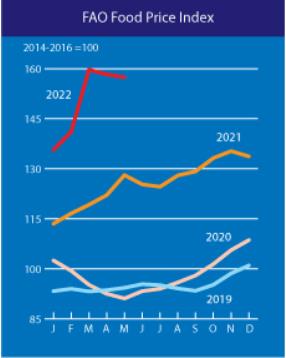
Inflation is very likely to continue to accelerate. Prices for energy resources are unlikely to stabilise in the next few months. In addition to that, the risk of shortages is high, and, as a result, so is the risk of heightened prices on key food items, whose price increases are already at highs not seen since 2008, according to data from the United Nations.
This could all lead to more than mere price pressure. For example, this autumn, the United Kingdom is expected to see runaway inflation.
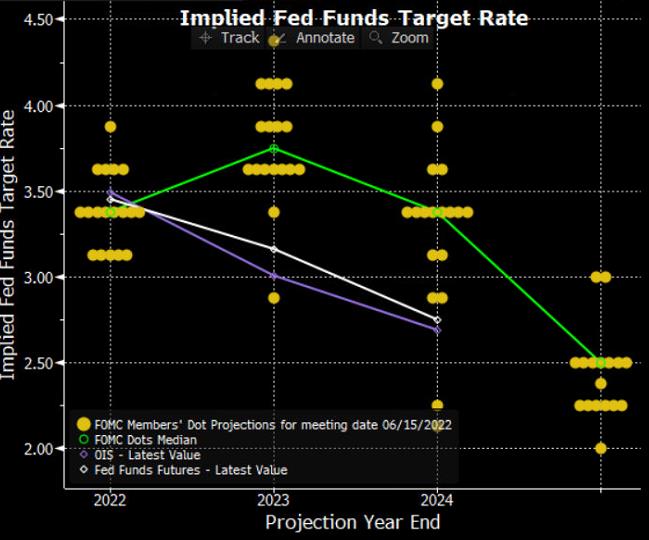
A similar situation will unfold in other economic powerhouse countries. Furthermore, if we look at the United States Federal Reserve, the regulator has made it quite clear that it is prepared to plunge the economy into a recession to combat inflation, although its representatives didn't come up and say it quite so directly. However, comments out of the Fed pretty clearly hint at this. One can come to this conclusion just by looking at the Implied Fed Funds Target Rate; the median forecasted target rate indicates that the interest rate could be 3.375% by the end of 2022.
On top of that, rising interest rates coupled with high inflation will negatively affect consumer lending and thus deal a blow to retail sales.
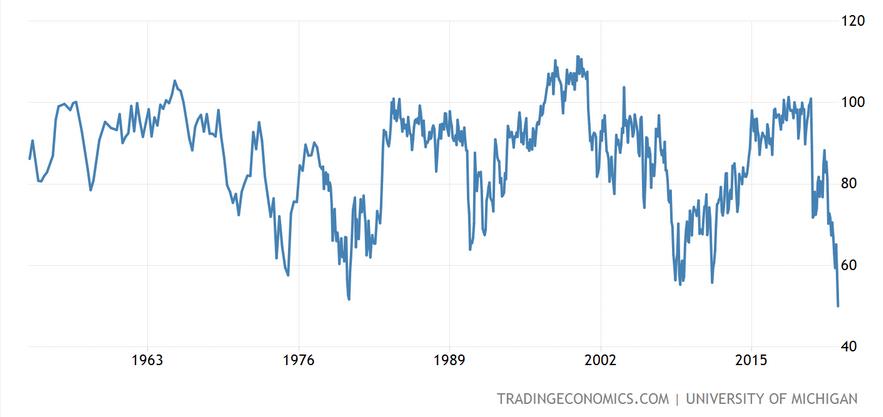
This is already baked into consumer expectations. The University of Michigan's Consumer Sentiment Index has fallen to its lowest level since 1982. This is a powerful confirmation of Americans' depressed outlook, which could have a strong impact on the country's service-based economy.
Things are following a similar path in most European countries. It's also worth noting that geopolitical risks are extremely high, which exacerbates the situation even further. On top of that, the probability of new waves of COVID-19 outbreaks should not be completely discounted, which also increases the probability of a recession. After all, some countries — China, in particular — are maintaining 'zero COVID' policies, the consequences of which could affect the health of the entire world economy since international supply and production chains could be damaged.
When inflation rises, defensive assets take on special meaning, especially precious metals. To be fair, it should be pointed out that at the stage when central banks raise interest rates, the rates partially lose their attractiveness. Why? Because they don't yield significant income. But looking at economic risks, it's clear that gold, silver and possibly platinum-group metals are what is needed at this stage to protect their assets from depreciation. The purchasing power of gold and silver can't be lowered by monetary policy, unlike that of global reserve currencies. Gold carries no credit or default risk, which can't be said for bank deposits. This is why precious metals have proven to be reliable money for thousands of years.
Taking into account what we've written above, one might expect gold to see a new wave of growth back to the highs it reached in March 2022. However, with yet another US Federal Reserve interest rate hike, gold may experience a drawdown to the support level of $1,770. The range between $1,770 - $1,800 per Troy ounce could be a good entry point for long positions.
If we return to the movement of major global currencies, it'll depend largely on different countries' varying monetary policies. That said, the situation looks pretty much like a dead end. ECB, the Bank of England and the Bank of Japan are being held hostage. In the current environment, they need to raise interest rates to protect their currencies, but it's not possible to do to the extent required because a banking crisis would arise. After all, the debt burden on economies is too high now.
To sum up: The dollar will remain the strongest in the currency market over the next few months, with the yen being the weakest. The central banks of England, Canada, New Zealand, Australia and even Switzerland have already raised their rates, the latter for the first time in 15 years. The ECB is showing clear intentions of taking such a step, while the Bank of Japan continues to harden its mantra of keeping its existing monetary policy. Considering the speed at which interest rates are rising, we could see the US Dollar Index strengthen further, making it an asset that can be included in your portfolios. You can also buy the dollar against the Japanese yen. Buying or selling other currency pairs should be postponed until better times, with clearer benchmarks to assess the impact of what is happening to national economies. That's when it'll be possible to say which country's economy has proved most resilient against inflation, geopolitics and other crises.
Raw materials market analysis: Energy and agricultural tools
Oil
Brent prices reached 10-year highs in June 2022 and have held above the psychologically important $100 per barrel mark since mid-March. At the same time, prices even reached $133 at one point, highs not seen since 2008.
The main reason is the high risk of Russia significantly cutting supply amid growing global demand. Global oil consumption is expected to reach 101.6 million barrels per day by the end of 2022, surpassing pre-pandemic levels.
These are perfectly justified concerns. The Russian Federation supplies the world market with about 7 million barrels per day. About half of this oil (or about 3.5 million barrels per day) goes to the European market. About 1% of Russia's oil production goes to the US.
Source: US Energy Information Administration
In early June, EU countries agreed to ban Russian oil deliveries by sea. This will affect about 70% of the oil shipped to the EU from Russia, resulting in a cut in consumption of Russian oil by 2 million barrels a day. Meanwhile, India and China are actively increasing purchases of Urals crude oil, as it's sold at a huge discount of $30 a barrel compared to Brent (versus the previous difference of $3).
So, an increase in demand for non-Russian grades of oil can be estimated at 2 million barrels a day.
To assess the scale of the problem, let's estimate the available capacity of OPEC and the US. According to Bloomberg, OPEC's oil production in May 2022 was 28.9 million bpd, and excess capacity reached 4.7 million bpd.
In such a scenario, the European market won't suffer much in the long term by moving away from Russian oil. However, it should be kept in mind that transitioning from one refining grade to another and the ramp-up of spare capacity mining will take time. Consequently, for a short period of about six months to a year, there could be some shortages in the market, which would keep prices higher if demand is high.
Natural gas
In June, natural gas prices at the Henry Hub gas distribution unit reached all-time highs in 2022. However, this rise was far more emotional than fundamentally sound.
The main growth driver for this was the war in Ukraine, which put supplies of natural gas to Europe at risk. What's more, this risk has a dual origin.
First, the largest gas pipelines run through Ukraine's territory and could be damaged at any time. Second, Russia is using natural gas supplies as a tool to apply geopolitical pressure on EU countries, which, in turn, are diversifying supply processes and are ready for Russia's energy embargo.
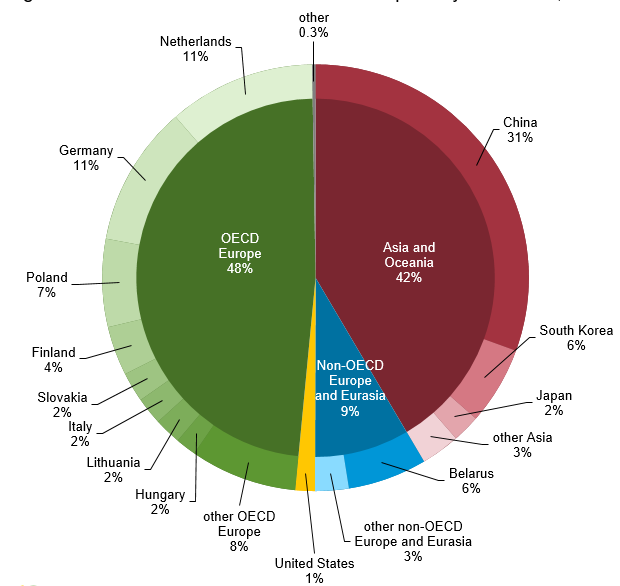
In 2021, the US exported up to 4 bcf/d of gas to the EU. This number reached 8 bcf/d in the first four months of 2022 (figure). To fully replace Russian gas, supplies must be increased by 15 bcf/d.
It should be noted that the growth in supply to the EU comes at the cost of reducing shipments to Asia. The rate of natural gas production in the US hasn't changed much. Neither have liquefaction and loading capacities.
Source: US Energy Information Administration
Consequently, the United States' capacity to supply liquified natural gas to the EU is now exhausted in terms of production, liquefaction and shipping.
Given the US political commitment to the EU, it can be expected that supply and demand in the domestic market will remain tight.
Prices at the Henry Hub gas distribution unit are likely to consolidate in the range of $6-9 per metric million British thermal units (MMBtu). Exhausted export transportation capacity will hold back a drop in supply for the US domestic market in any political circumstances.
We believe that in the current situation, buying natural gas (NG) in the range of $6 per MMBtu will be an interesting proposition.
Agricultural tools
Grains
The two largest grain exporting countries, Russia and Ukraine, are in a de facto state of war. In the current environment, markets are reacting accordingly, given the risks to exports (blocked Ukrainian ports) and sharp reductions in crop areas and crop forecasts. The situation has been worsened by a dramatic rise in the price of fertilisers and fuel, which significantly increases the cost of production. As a result, prices rose to the highest levels since the beginning of 2022. Corn rose by 39%, and the price of wheat grew by 77%, at which point it began to correct rapidly, losing over half of its rise. The main question for traders now is in which direction will the price go? Will it continue to correct downward, or will it start to rise again?
To see how the price is moving, let's look at the market balance based on data from the US Department of Agriculture.
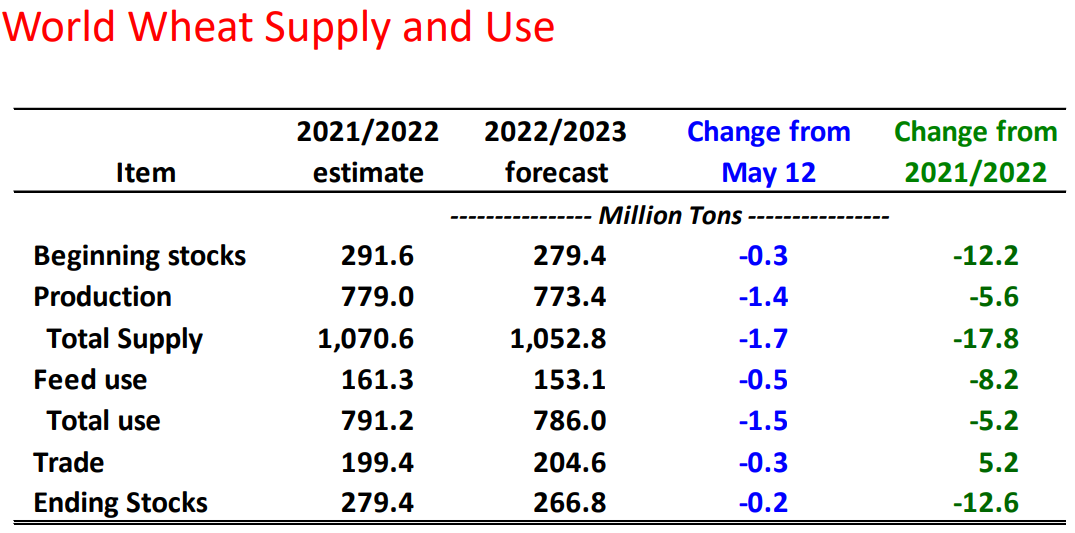
Based on the balance of world wheat supply and use, there's been a significant reduction in stocks and production (harvests). In June, these figures declined compared to the May estimates. Global wheat consumption figures have fallen significantly, exceeding the forecasted yield decline. As a result, given the greater slowdown in consumption than in harvests and the prospects of a partial resumption of exports by Ukraine, we can say that the market has moved past its extreme point. The baseline scenario is that the price will continue to move downward to $850, where wheat will again become attractive for purchasing. Ukraine's export and harvest situation remains a forecasting risk.
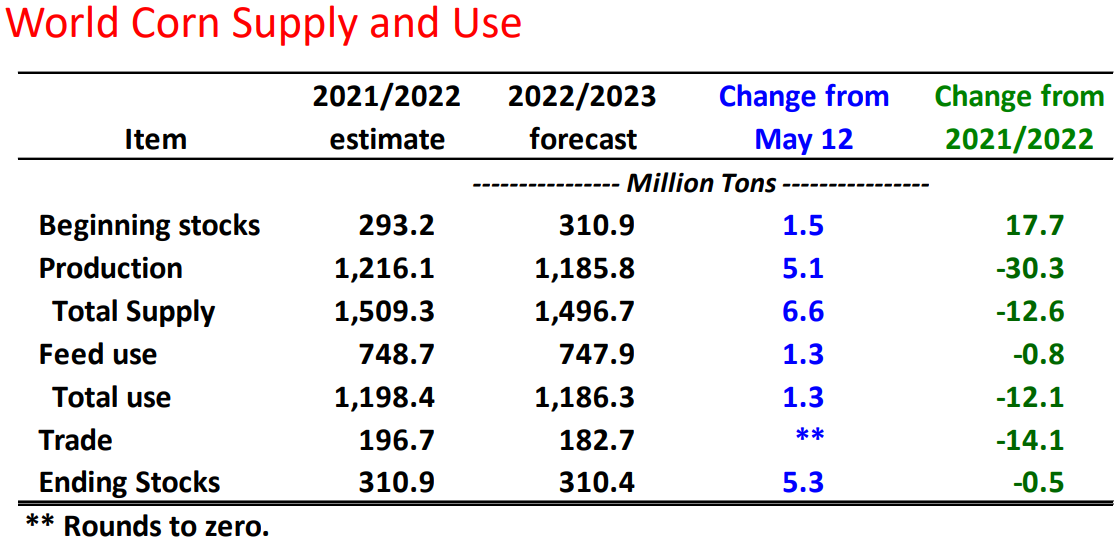
The balance of world corn supply and use and the outlook for this commodity don't look as pessimistic as they do for wheat. First, corn stocks at the start and end of the forecast period are almost identical. Second, although the corn harvest forecast has been significantly reduced, the market remains almost balanced in terms of total supply and consumption figures. Third, if we look at changes in the July forecast relative to May, we can see that most parameters have improved, putting pressure on corn prices.
The baseline scenario for the medium-term forecast remains a price correction into the area of $630, which corresponds to the average price for the last 12 months. At these levels, corn prices will likely stabilise, and further movements will depend on incoming information.
Stock market
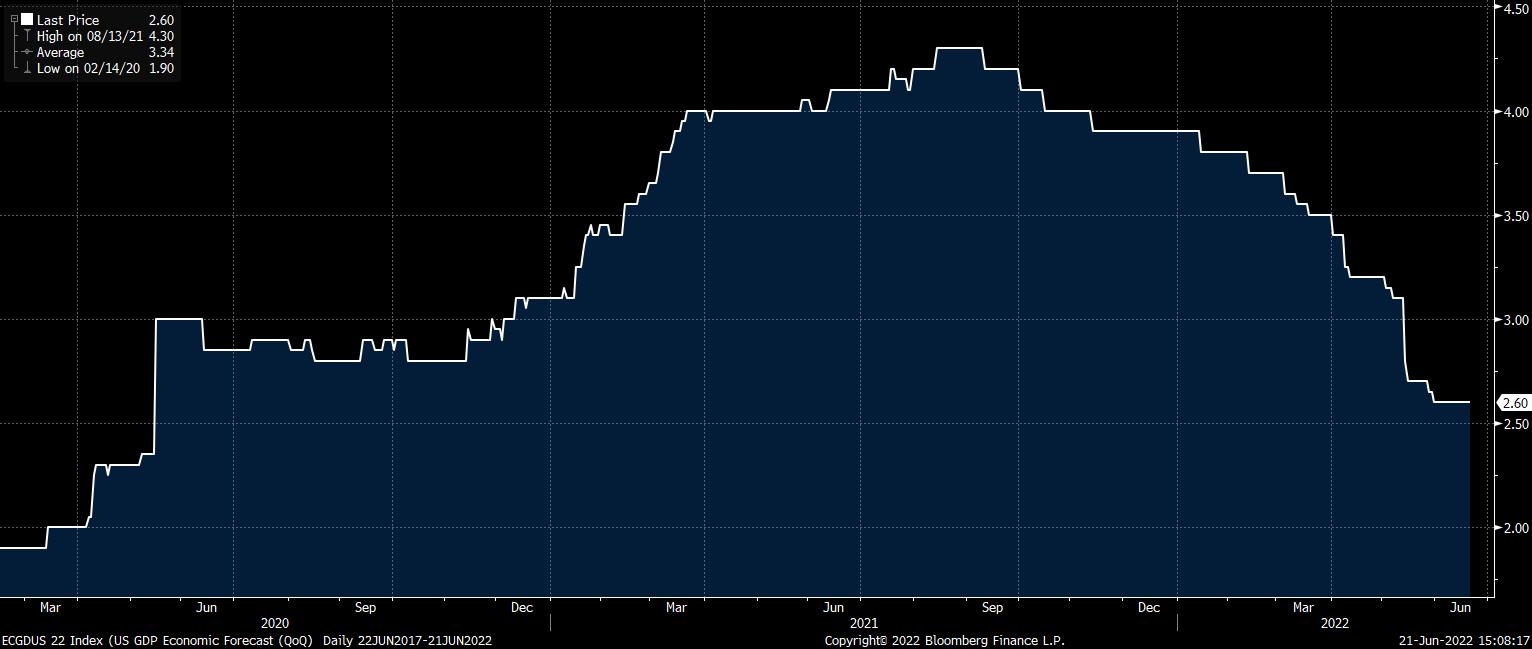
The US GDP growth rate decreased significantly in the last quarter. Whilst the economy grew at an annualised rate of 6.9% in Q4 2021, Q1 2022 saw a decline of 1.4% y/y. The forecasts for 2022 are dropping at an ever-increasing rate.
Source: Bloomberg
The decline in economic activity doesn't appear to be widespread yet. Instead, it has largely been driven by the expectations of economic agents. We've seen a decline in GDP due to a reduction in inventories and cuts in spending by federal and local authorities.
Only foreign trade could be cause for concern; exports are down, and imports are up. However, this is due to a stronger dollar and rising energy prices. These factors aren't structural problems, so their impact on GDP growth may be transitional.
The Conference Board's authoritative Leading Economic Index, a composite measure of the performance of key leading macroeconomic indicators, confirms that the economy still looks healthy.
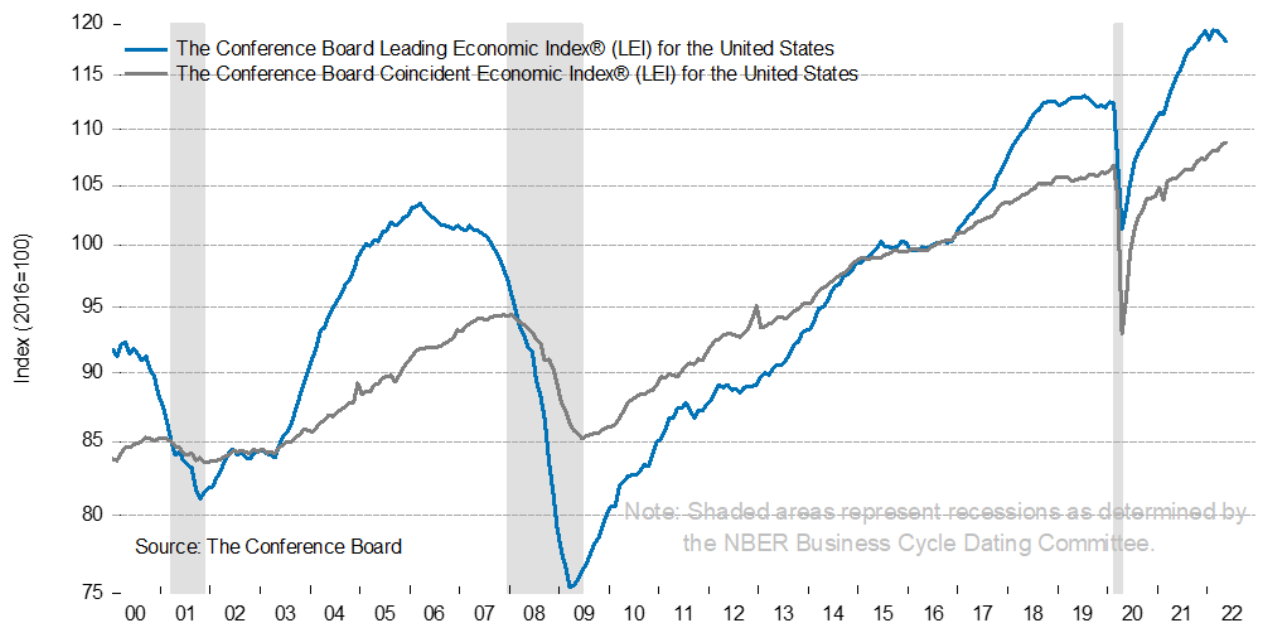
Source. Conference Board
Historically, at the start of a recession in the United States, the curves of the leading and coincident indices have intersected one another. In the figure, recessions are represented by areas that are shaded grey.
The US economy is facing a serious challenge affecting expectations and thus stock indices. Long years of ultra-dovish monetary policy and COVID-19 have, after all, skyrocketed inflation to thirty-year highs.
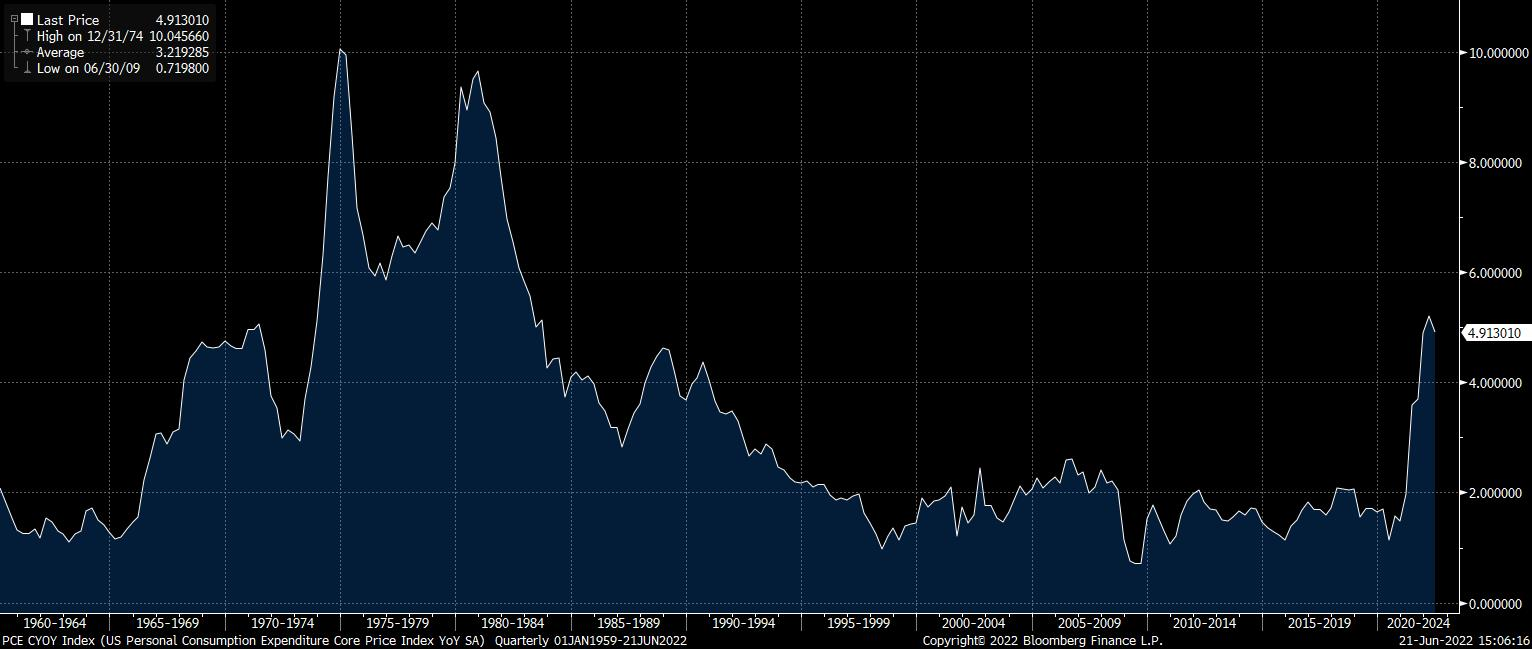
Source: Bloomberg
High inflation is forcing the Fed to react. To recap, the US Federal Reserve has a dual mandate: it must ensure price stability and facilitate maximum employment. The unemployment rate currently stands at 3.6%, a figure at all-time lows. Therefore, the Fed can raise interest rates without looking back. Chairman of the Federal Reserve Jerome Powell recently stated that he's prepared to sacrifice economic growth to stabilise prices.
The pace of interest rate hikes, which started in March, has been significantly faster than economic agents had forecasted. The Fed indicated a willingness to raise the key interest rate by 0.75 percentage points in one go, the largest such hike in 30 years. Surveys of Federal Open Market Committee members with the right to vote on interest rate decisions indicate that the interest rate could reach 4% by the end of 2023 and only then gently start to decline in the longer term.
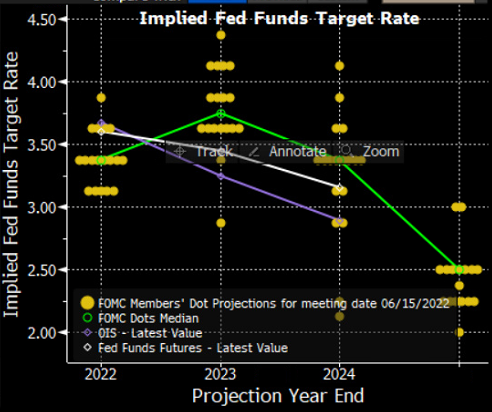
Source: Bloomberg
Here's how stock market investors see things. The economy looks good, and the situation in the labour market is fairly positive. But inflation is at historic highs, and the Fed needs to act now. It's chosen a path of aggressive interest rate hikes without regard to economic growth. This brings stock indices under pressure, with some falling by 30% from their all-time highs.
The big question is: Where and when can the decline end?
Before answering, it should be noted that a rate hike cycle can have two effects on the economy: it can trigger a recession or deal with inflation without a decline in economic activity.
If we look at all the rate hike cycles since the end of WWII, the following data emerge. A cycle of rising interest rates without the economy falling into recession causes stock indices to fall by around 15% on average. A rate hike cycle followed by a recession causes indices to fall by 30%.
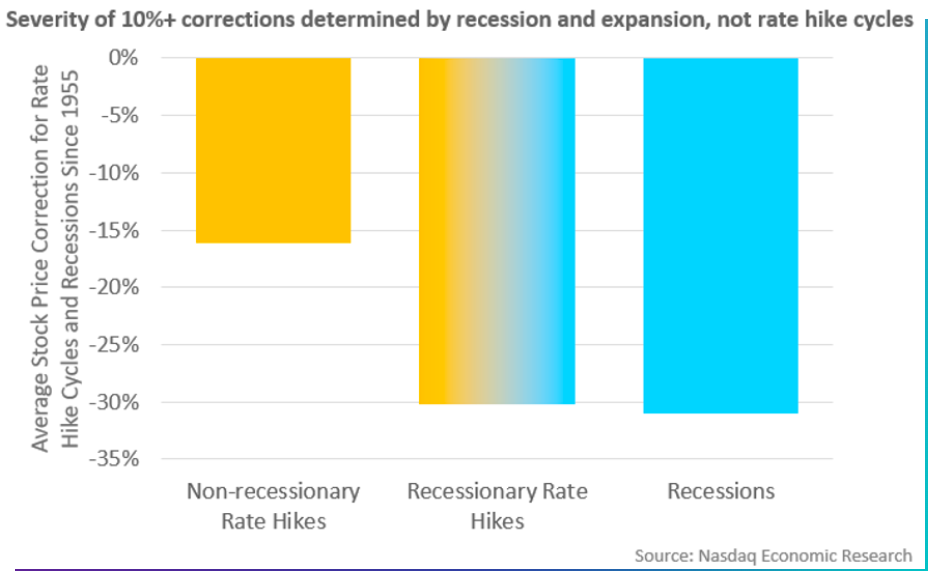
Source: NASDAQ Economic Research
As of June 2022, it appears that the current rate hike cycle could be accompanied by a recession. We've already seen a quarter with negative GDP growth. Add one more, and the US is officially in recession. To conclude, the current drop in GDP growth doesn't look like a structural problem. Instead, it looks like an opportunistic short-term trend.
Stock indices' drop has already reached 25-30%. As such, it can be assumed that a significant part of negative expectations is already priced in. As soon as inflationary pressures start to ease — and there are signs of this already happening — we can expect indices to begin a recovery cycle. Technical analysis tools can be used right now to look for long-term long positions in stock indices at extremely low price levels.
For the S&P 500, that's around 3,370.
Cryptocurrency market analysis
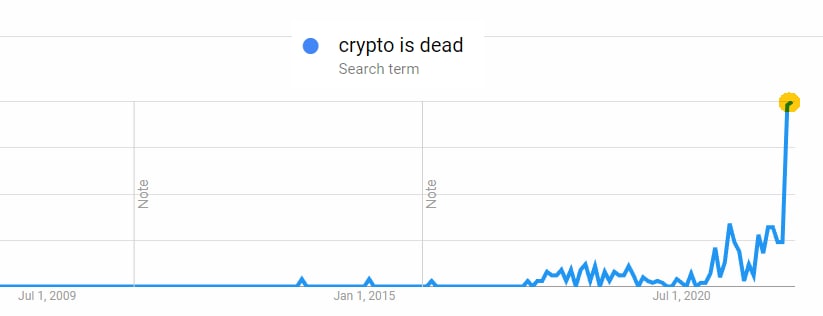
Crypto is dead?
The frequency of this and similar queries in Google Trends recently is off the scales. But is it really the case? Let's take a look.
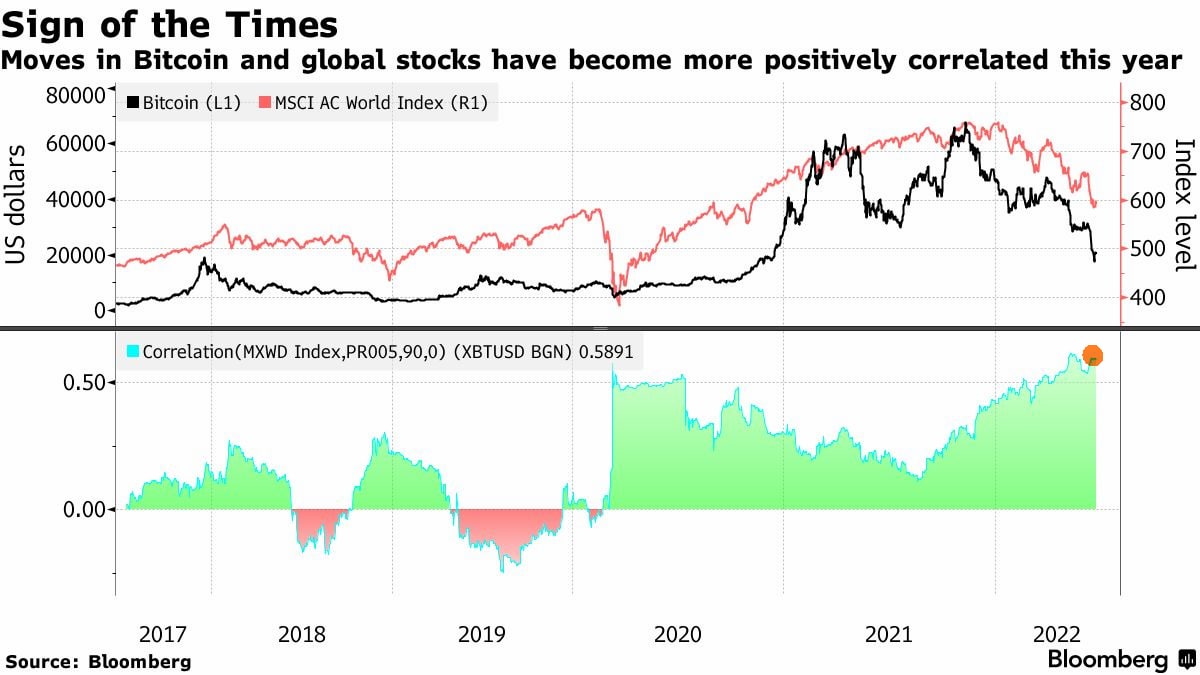
On average, cryptocurrency prices have dropped three-fold from their highs in November 2021. Bitcoin, in particular, has fallen by more than 73% from its all-time high. At the same time, stock markets have also come under significant pressure, which has resulted in the stocks of the largest companies shedding 20-40% of their value. It should be noted that there's been a high level of correlation between the crypto and stock markets recently. Bitcoin, in particular, has a 59% correlation with global stocks' movement. As has already been stated, the reason for everything is the flight from risk seen around the world, record global inflation and a bold tightening of monetary policies (i.e., making lending more expensive) by the US Federal Reserve and other central banks.
Cryptocurrencies have their own particularities, but they have also suffered as a result of the massive reduction in borrowed funds. The problem lies in the mass use of leverage by crypto traders and the subsequent forced liquidation of their positions upon a collapse. Both on-chain DeFi markets and off-chain entities lost leverage as exchanges, lenders and hedge funds became insolvent, illiquid or liquidated. Events in May related to the collapse of Terraform Labs' (LUNA) UST stablecoin, which lost its peg to the US dollar and thus jeopardised the reputation of all stablecoins, caused a powerful decline in the crypto market. This even caused Tether (USDT) to stagger, losing more than 5% as UST fell. In June, sights fell on the stablecoin USDD from the Tron network. Although it didn't hit zero as UST did, it also lost its peg to the US dollar. The company Celsius faced significant problems that led it to suspend withdrawals from the platform and file for bankruptcy protection in mid-July. Celsius' issues negatively impacted Tether, which was a key investor in the company.
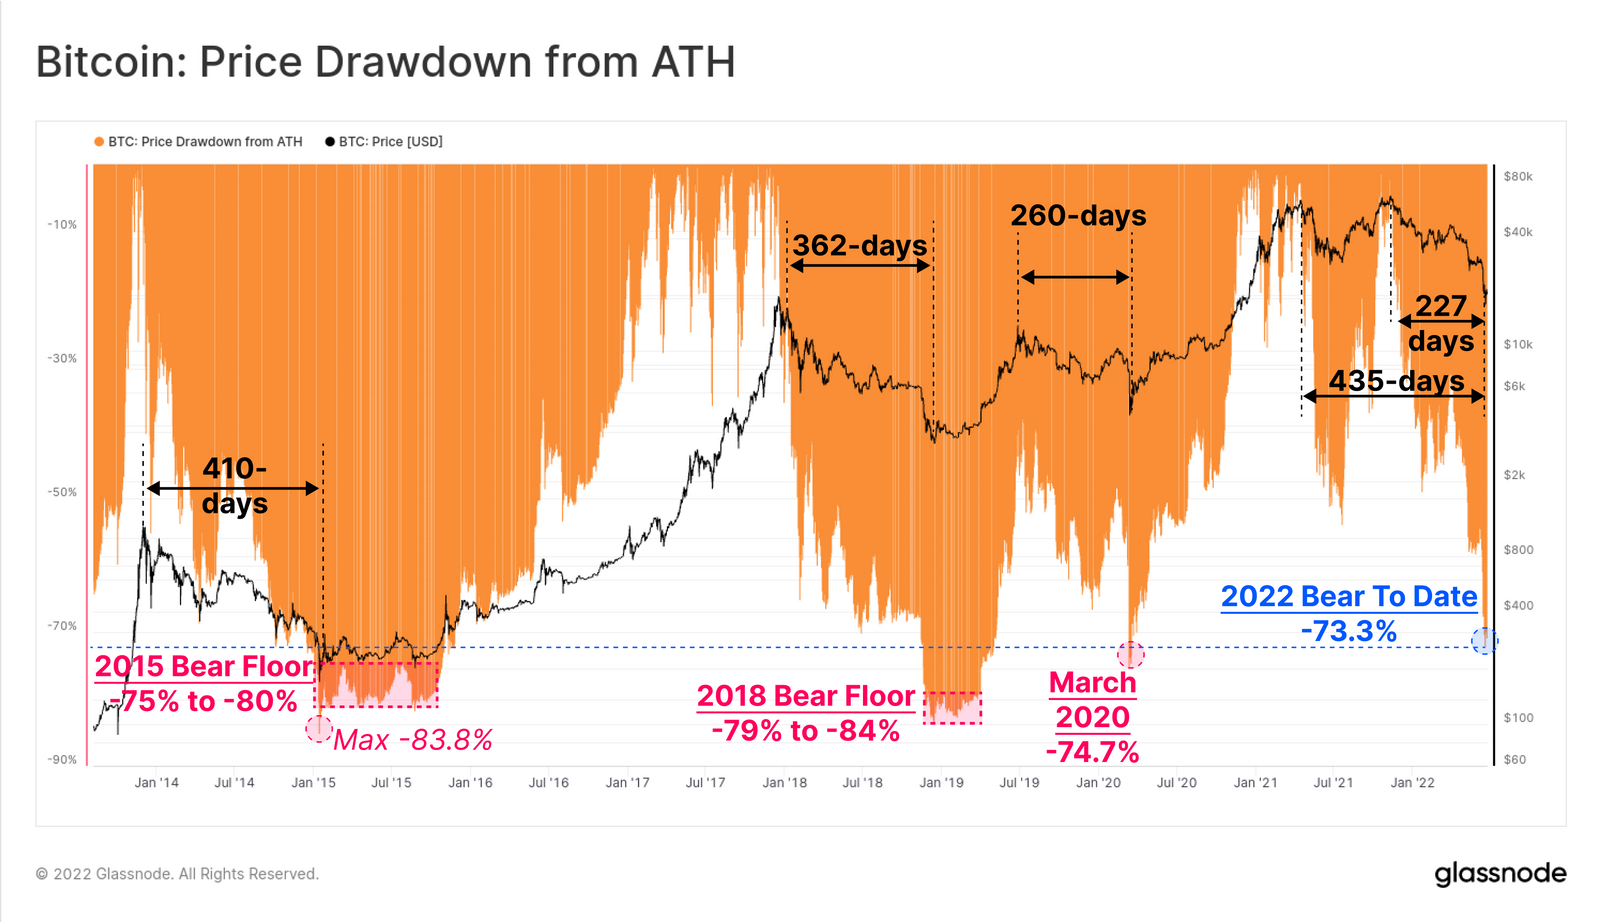
To analyse Bitcoin's current situation, we need to assess the scale and duration of the current drawdown compared to the bearish cycles of 2015, 2018 and 2019. Bear market lows have historically been set by BTC drawdowns of -75% to -84% from its all-time highs (ATH) and lasted from 260 days in 2019-2020 to 410 days in 2015. With the current decline of 73.3% below the ATH reached in November 2021 that has continued for a period between 227 and 435 days, this decline is firmly within historical boundaries. However, the support level near $20,000 may not hold, and the price could test $11,000 - $14,000 per BTC. Interestingly, the region between $12,000 and $14,000 holds the most risk for margin traders, who would be forced to liquidate if the price reaches this range.
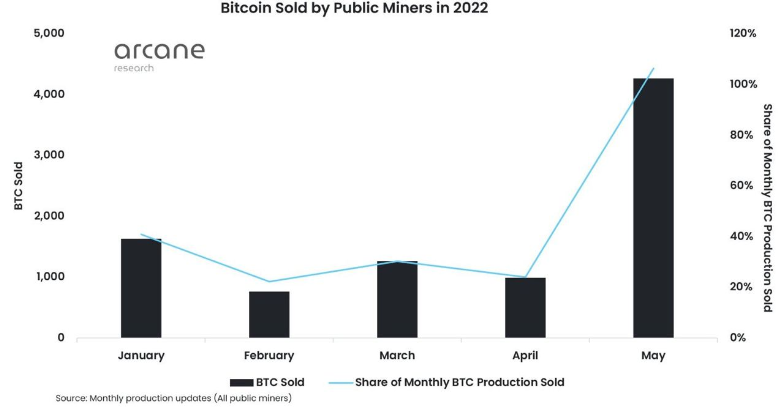
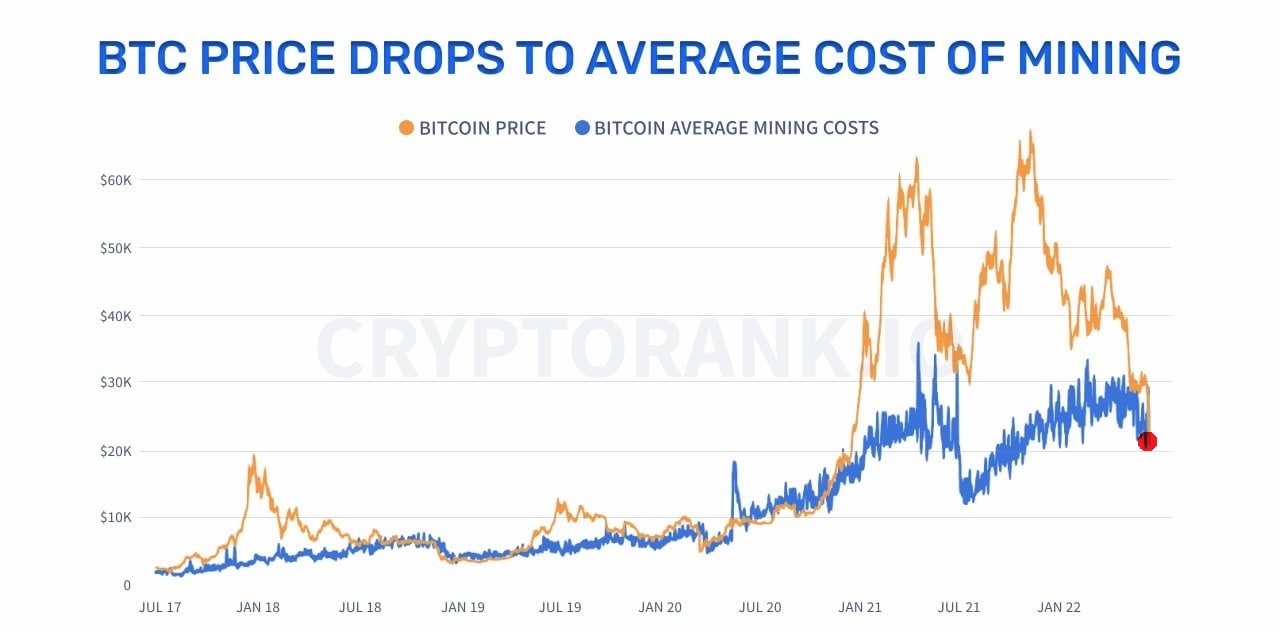
According to data from Arcane Research, in May 2022, BTC miners sold more coins than they mined. They also sold part of their old stocks of coins. The corresponding sales figure exceeded 100% of monthly mining. That figure is usually 25%-40%, enough to cover operating expenses. However, this time, miners were forced to sell more than they mined during the money, which could indicate that mining the first cryptocurrency has become a lossmaker for some.
The cost of mining today is between $20,000 and $25,000 and will continue to grow due to increasing energy prices. However, if we look at the profitability of mining as a business, we can see that the operation is definitely under threat. Essentially, at a price below $20,000 per BTC, mining will stop to yield profit for all groups of miners. We already see ASICs, the equipment used to mine Bitcoin, being disconnected from the network en masse and a significant fall in the mining hashrate. As we already know, a reduction in supply creates a shortage. It's probably not too much of a stretch to say that another growth wave could be not far away. The asset's price can't stay below the breakeven point for long. If it does, a huge shock awaits the entire crypto industry.
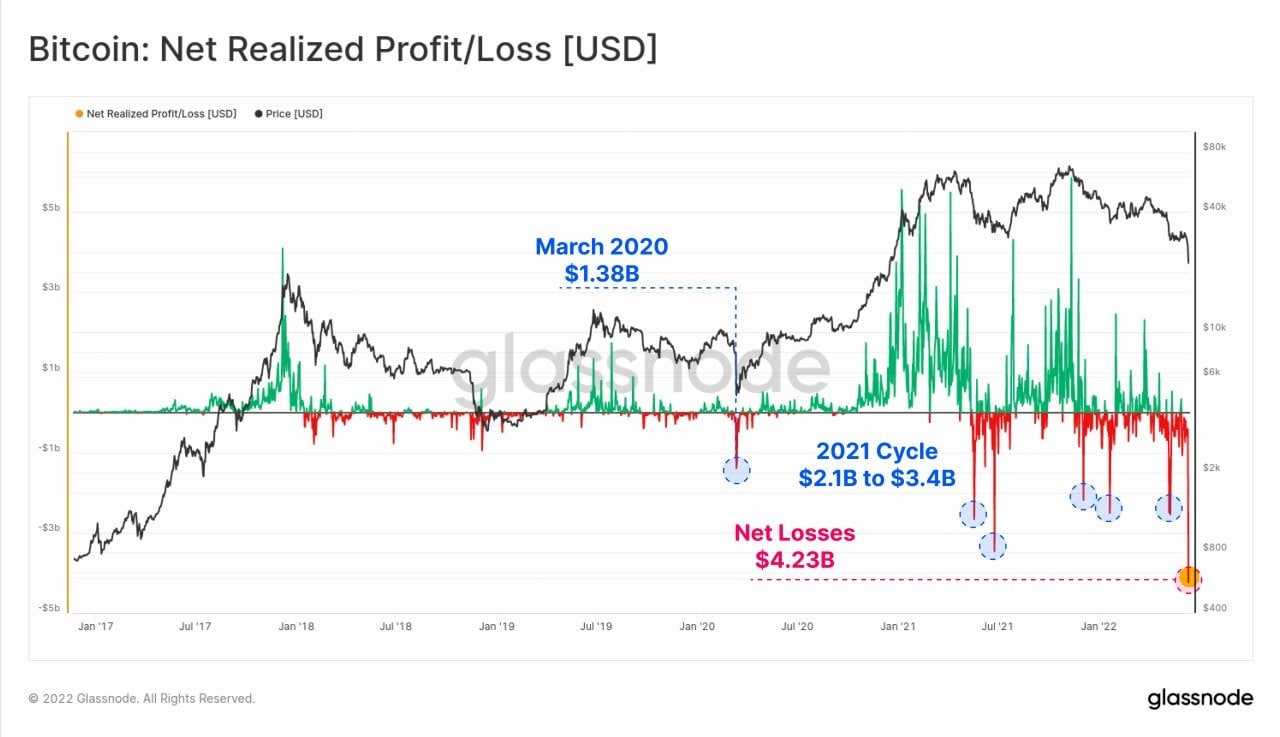
Another potential sign that Bitcoin has hit bottom was the capitulation of retail and non-retail crypto traders, market participants that eagerly used leverage. Essentially, because they were forced by exchanges to liquidate their positions, they sold their coins for a loss at very low prices. This event hit traders the hardest in the entire history of cryptocurrency analysis. It's events like these that often signal a subsequent trend reversal since only buyers remain in the market when there are no more traders willing to sell.
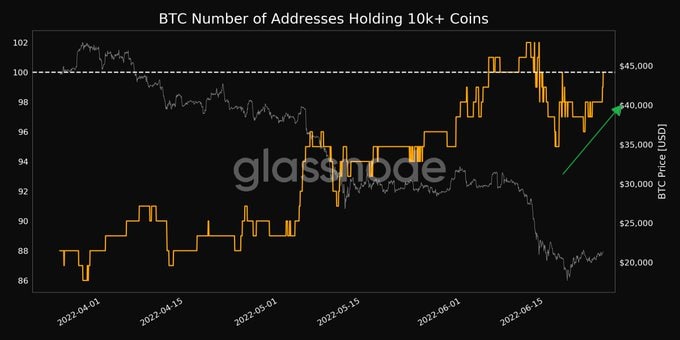
The sharp increase in activity among whales as smaller market participants sell off is also a positive factor. According to Glassnode, BTC wallets with a balance of 10,000+ coins have begun to accumulate coins again. In other words, large traders are taking advantage of the fall to buy Bitcoin at lower prices.
Conclusions
- Sentiment among small traders is clearly negative, as they've suffered some of the biggest losses in cryptocurrency trading. The peak in the frequency of Google searches for the "death of crypto" also indicates that they've completely given up. Such situations are often critical.
- We're seeing increased activity among whales, who are buying at the lowest prices in five years.
- A 73% correction is within the norm for such a situation, and the bottom is probably very near. However, we don't rule out the possibility of BTC's price continuing to fall to somewhere between $11,000 and $14,000 to lose any hangers-on for good.
- Bitcoin is used as a defensive asset in the crypto industry. Fearing a drop, investors convert their risky assets to BTC and stablecoins, which causes demand for Bitcoin, one way or another. Bitcoin is traditionally the first crypto asset to rise after a crypto winter.
- Today, we're seeing a unique situation that has only happened two or three times in the past.
- According to the news and market sentiment, it's likely the price of Bitcoin will consolidate in the range between $18,000 and $24,000 next month.
Ready to Start?
Join thousands of Libertex users.
83% of retail investor accounts lose money