
What Are Bollinger Bands, and How Are They Used in Trading?
Prepared by the Libertex team
Content reviewed internally in accordance with regulatory standards.
Bollinger Bands are commonly used as a tool in technical analysis in a range of financial markets, including forex. It helps understand the market conditions and identify the right moment for entry/exit, which is an essential skill for any trader.
Bollinger Bands demonstrate the prices and volatility over time of a given asset and are used in various trading strategies. The formula was first introduced in the 1980s by the American financial analyst John Bollinger. Since then, these statistical charts have been utilised to analyse market data, inform trading decisions and manage algorithmic trading.
What Are Bollinger Bands?
Bollinger Bands demonstrate on-chart market volatility. They are two intervals drawn to predict an asset's potential volatility range in relation to its moving average (MA). Normally, these price channels move across the chart symmetrically, but the distance between the bands varies significantly in certain market conditions.
Bollinger Bands demonstrate on-chart market volatility.
Despite trends, market moves can be quite erratic. Technical analysis applies this method for anticipating a price action. Bollinger Bands appear as three bands, the middle being a simple moving average usually plotted in a 20-minute period.
The other two bands (upper and lower) are reactive to volatility shifts and indicate the two extremes. They are calculated around the simple moving average shown below. They are drawn first and then projected into a channel that will contain the expected price changes. For trading decisions, the important pieces of information derived from the bands include the entry and exit points for trades. And unless the price moves way beyond the price channel, traders can be fairly certain about what to expect.
Bollinger Bands appear as three bands, the middle being a simple moving average and the other two bands (upper and lower) being reactive to volatility shifts.
Some prefer to connect the top or bottom of the price to determine the upper or lower extremes. And then, they extend parallel lines to illustrate the interval of price changes.
Bollinger Bands Calculation
Bollinger Bands can be used in five-minute charts, daily, hourly or monthly timeframes. Traders can adjust the following two parameters: period and standard deviations (StdDev).
Traders can adjust the following two parameters: period and standard deviations.
The most used period is 20, but it can be modified to suit a specific need. As for the standard deviation, it's often positioned at 2.0. Consequently, Bollinger Bands denoted (20,2) indicate that the period and the standard deviation are set at 20 and 2, respectively. A high StdDev means that the price is less likely to reach either band. With a low StdDev, the price will possibly break out of the channel.
To calculate Bollinger Bands, you need to determine the Middle, Lower and Upper Bands separately. The formulas are as follows:
Middle Band = 20-day SMA (simple moving average)
Lower Band = 20-day SMA – (20-day standard deviation of price x 2)
Upper Band = 20-day SMA + (20-day standard deviation of price x 2)
How to Use Bollinger Bands
The simplest way to interpret and use Bollinger bands in trading strategies is to view the channel as a measure of the highness or lowness of the price relative to previous trades.
Let's quickly go over the kind of information traders can gauge from this indicator:
- The upper band demonstrates statistically higher prices.
- The lower band demonstrates the opposite.
- The bandwidth, i.e. difference between the upper and the lower Bollinger Bands, corresponds to market volatility.
As a volatility indicator, Bollinger Bands tighten or broaden around the price plot on the chart. As seen in the formula above, the price range widens as the standard deviation goes up and vice versa. For example, when the volatility of a given currency pair is low, the channel narrows down.
Bollinger Bands can also be used to confirm a trend and describe its direction and strength:
- During an upward trend, the price will continuously reach the upper band, meaning buying activity is strong.
- The trend is likely to head up when it is higher than the 20-period MA and when it goes beyond the upper band.
- In case the price is pulling back during an upward trend, it can mean two things. If it doesn't drop lower than the SMA and goes back up, it confirms the trend's strength. Alternatively, if it breaks the lower band, the uptrend is reversing.
By confirming the price action, Bollinger Bands provide traders with information on whether they should make buying or selling orders. For instance, a sell trade should be carried out at the upper band limit; entering a buy trade is advisable at the lower band limit. If a currency normally follows a range pattern, this method will be useful. However, mistakes can cause huge losses, such as when a breakout occurs.
As a technical analysis tool, Bollinger Bands offer reassurance when traders make certain decisions. When trading near the outer boundaries, they can be confident there's resistance (upper band) or support (bottom band). But Bollinger Bands alone are an insufficient signal as they simply offer a perspective on the price relative to historical volatility.
5 Bollinger Bands Trading Strategies You Show Know
Having determined what Bollinger Bands are, how to calculate them and what kind of information they provide, it's time to look at the strategies. We have five trading strategies to showcase this trading indicator in action.
Bollinger Band Squeeze
When the distance between Bollinger Bands reaches a six-month minimum, it's identified as a Squeeze. When the volatility is that low, traders should prepare for the eventual breakout. The biggest challenge is to figure out the direction of the breakout:
Assume other indicators, such as relative strength index (RSI) and a volume-based indicator, are heading up. At the same time, the price is going down or sideways. These are indications of a bullish market.
Alternatively, look for a bearish breakout when the price goes up and the indicators are flat or making a lower top.
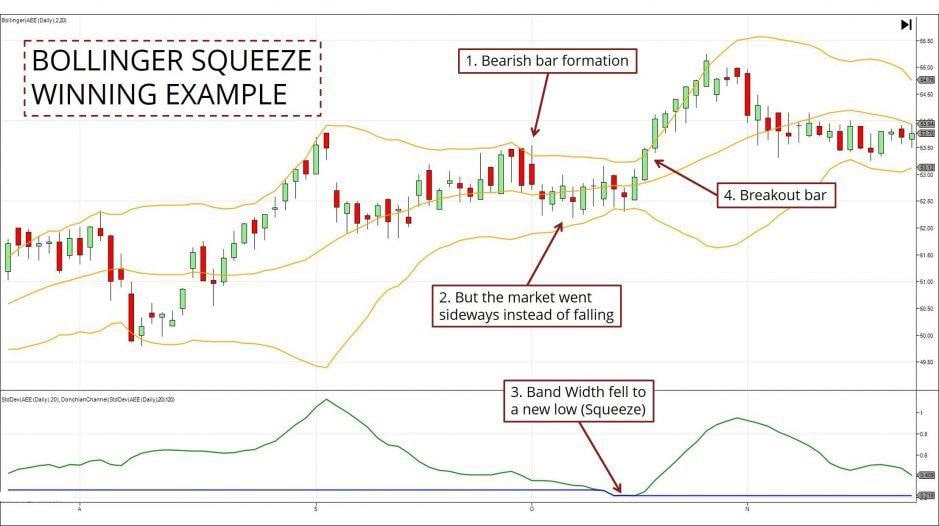
When the price takes off in either direction after this period of consolidation, the price move is often large. If it breaks through the upper band, traders need to make buy orders and vice versa. A stop loss is preferably set on the opposite side of the breakout.
Double Bollinger Bands
First, you apply Bollinger Bands using the default parameters:
- Period: 20
- Deviations: 2
Next, the second set of Bollinger Bands should be set at slightly different settings:
- Period: 20
- Deviations: 1
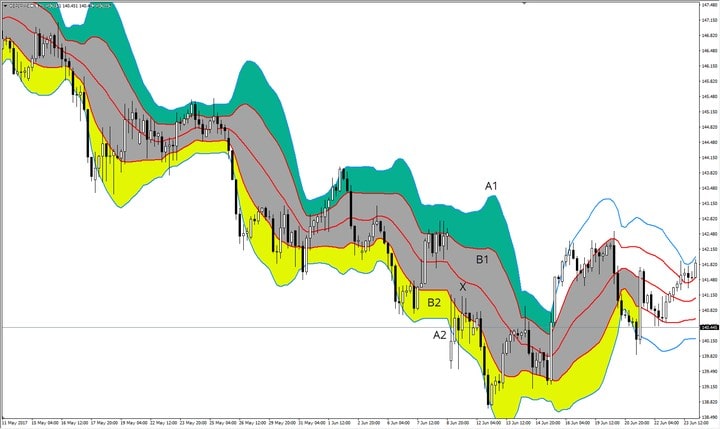
These two BB indicators outline the following areas of the chart:
- A1-B1: Buy Zone
- B1-X: Neutral Zone
- X-B2: Neutral Zone
- B2-A2: Sell Zone
If the upward trend is strong, it's very likely the price will move up. Provided the candles will be closed at the topmost zone, traders should hold long trades or even enter new ones. If the downward trend is strong and the candles close in the lowest zone, traders are advised to keep short trades or open new ones.
Bollinger Bands Scalping
This strategy takes advantage of short-term volatility in the currency. It's well-suited for range-bound conditions accompanied by close to flat horizontal Bollinger Bands.
Here are the settings:
- Bollinger Bands are set at default parameters – 20,2
- The best timeframes for Bollinger Bands Scalping are 1-minute, 5-minute and 15-minute charts.
- The recommended trading sessions are London, New York and Tokyo.
- Lastly, traders could potentially yield maximum profits by trading currency pairs with low spreads, such as GBP/USD, EUR/USD, etc.
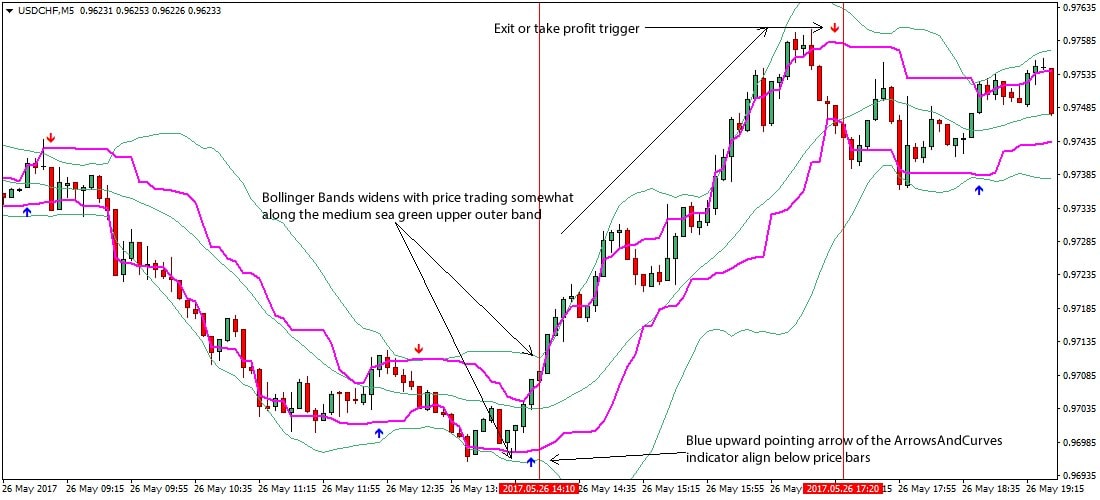
It may be advisable to enter a long trade if:
- The price stays above the middle band and is drawn to the upper band
- The bandwidth widens
- The price seems to be pushed higher.
The sell entry rules are the following:
- The price stays below the middle band and is drawn to the upper band
- The bandwidth widens
- The market sentiment points to the bearish movement, and the price is pressured further down.
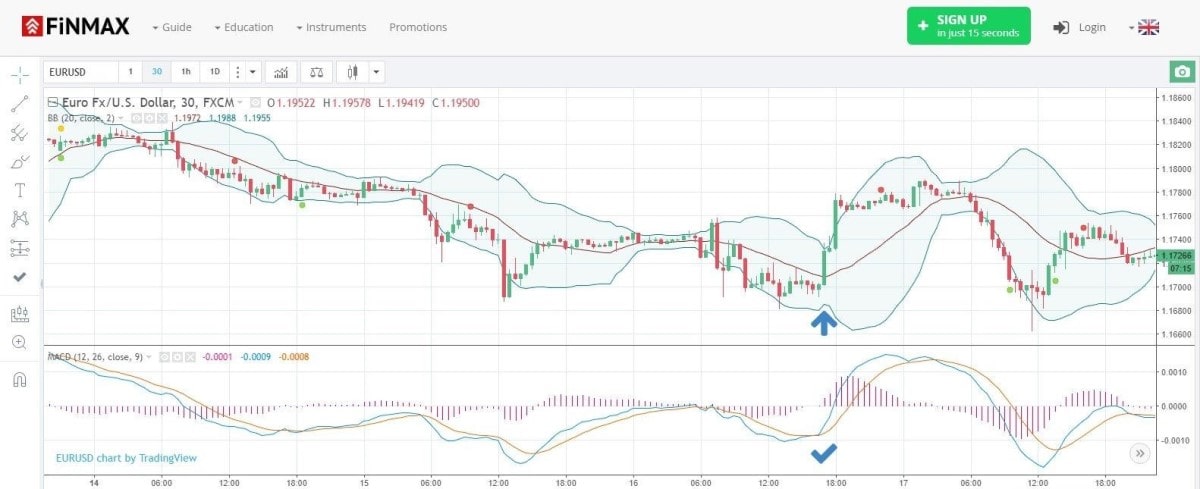
Bollinger Bands & MACD Indicator
The strategy is set up to use the MACD indicator to define the trend and the Bollinger Bands to trigger the trade.
The settings for the MACD indicator are:
- Slow-moving average at 26
- Fast-moving average at 12
- 9-day EMA as the 'signal' line
The Bollinger Bands settings are:
- MA at 12
- StdDev at 2
The conditions for entering a long position are: MACD should be higher than the signal, zero lines and a buy stop order should be placed at the upper Bollinger Band.
The short trade is entered when MACD is lower than the signal, zero lines and the sell stop order is set at the lower Bollinger Band.
With this strategy, you receive accurate signals, avoid substantial streaks of losses, and have the opportunity to profit from consolidating and trending conditions. However, it requires you to constantly observe the charts.
Gimmee Bar
This trading strategy aims to trade on reversals downward from the top of a trading range or upward from its bottom.
When to enter a long trade:
- Prices are going down inside the trading range
- Prices are tagging the lower Bollinger Band
- The bar should close higher than open, which is the Gimmee bar
- A buy order should be placed one tick above the bar
When to enter a short trade:
- Prices are rising inside the trading range
- Prices are tagging the upper band
- The bar should close lower than it opened
- A sell order should be placed one tick below the bar
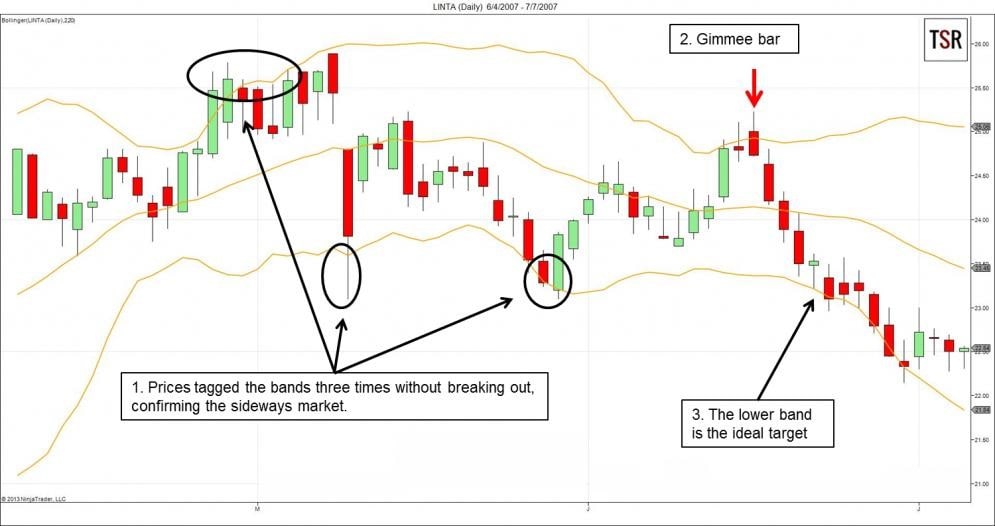
The strategy creator warns traders about certain scenarios with Gimmee bars. For example, you shouldn't trade when the bar overlaps or moves closer to the MA.
Trading with Bollinger Bands
All traders need to determine how the markets are moving. Bollinger Bands are applied to analyse trend strength, monitor when a reversal may be occurring and inform them if they should enter or exit the market to generate profit.
Even with certain limitations of Bollinger Bands strategies, the indicator has become one of the most useful and commonly used tools. Since the bandwidth contracts and widens with volatility, it helps traders take advantage of oversold and overbought conditions.
With this information in mind, you can find a strategy that suits your skills and preferences with Libertex. Please keep in mind that CFD trading is risky, even when you're using the best tools available. The platform is built by professionals, which ensures features and insights for every skill level. Start a free Demo account to learn more about selecting and placing trades and step up to more complex strategies.
Disclaimer: The information in this article is not intended to be and does not constitute investment advice or any other form of advice or recommendation of any sort offered or endorsed by Libertex. Past performance does not guarantee future results.
Why trade with Libertex?
- Get access to a free demo account free of charge.
- Enjoy technical support from an operator 5 days a week, from 9 a.m. to 9 p.m. (Central European Standard Time).
- Use a multiplier of up to 1:30 (for retail clients).
- Operate on a platform for any device: Libertex and MetaTrader.