
Fibonacci Tools for FX Trading
Prepared by the Libertex team
Content reviewed internally in accordance with regulatory standards.
Every trader should have a wide range of instruments to predict market movements. And, of course, every trader should know about the Fibonacci indicator instrument. This indicator provides many signals that will help you place profitable trades. However, it's tricky to put it on a chart, so read on to reveal its benefits.
What is Fibonacci?
Fibonacci is a commonly used trading indicator used in technical analysis that provides levels of support and resistance. At the same time, these levels can be used as perfect entry and exit points if you know how to use Fibonacci signals.
The Fibonacci Sequence
In the 13th century, Leonardo Fibonacci discovered a sequence of numbers aptly called Fibonacci numbers: 0, 1, 1, 2, 3, 5, 8, 13, 21, 34, 55, 89, 144, etc. If you look carefully, you'll notice that every subsequent number is the sum of the two previous ones. What's more interesting is that their ratios represent the proportions seen in the universe. For example, a tree branch has a Fibonacci spiral.
How to Calculate Fibonacci
The Fibonacci retracement levels are counted using these numbers. Each previous number amounts to approximately 61.8% of the following number, 38.2% of the number after, and 23.6% of the one after that.
The crucial Fibonacci retracement levels are 161.8%, 61.8% and 38.2%.
There's also another figure that is presented as a ratio between any number of the row and the previous one. It amounts to 161.8%. However, there's also the 50% line that takes part in many signals.
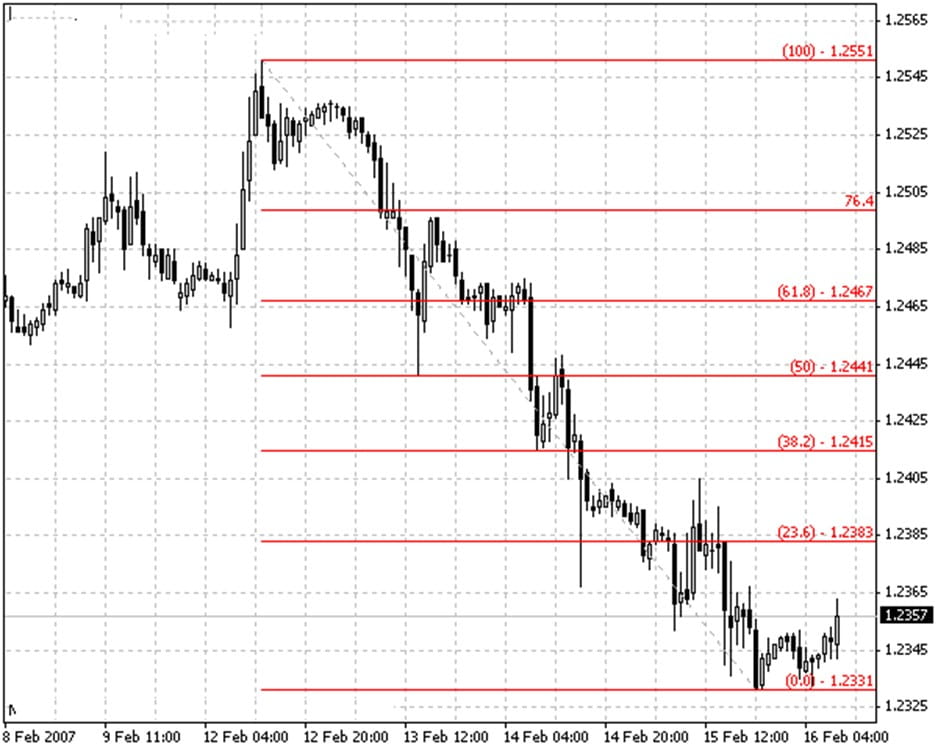
What Fibonacci Levels Look Like
Fibonacci tools look like horizontal lines with specific numbers and one baseline that connects two points of the current trend.
Where to Find Fibonacci Tools
As Fibonacci tools are highly popular among traders, they can be found on different trading platforms. If you use a version of MetaTrader, find the 'Fibonacci' window in the 'Insert' tab, where you'll see a list of tools you can choose from.
One of the advantages of Fibonacci tools is that they're available for free and don't require additional downloads.
Fibonacci retracements and expansions are the most famous of the Fibo tools.
The Fibonacci tools contain Fibonacci retracement levels, Fibonacci expansions, fan, arcs and time zones. We'll talk about Fibonacci retracements and expansions because they're the most frequently used.
How to Use Fibonacci Retracement in Forex
Fibonacci retracement levels are used to predict the price correction against the primary trend.
How to Place Levels
It's essential to apply the indicator correctly to catch working trading signals.
- Find the Fibonacci retracement on your trading platform.
- Determine the current trend and find the highest and lowest points. There must be no other tops or bottoms that exceed the ones you've chosen.
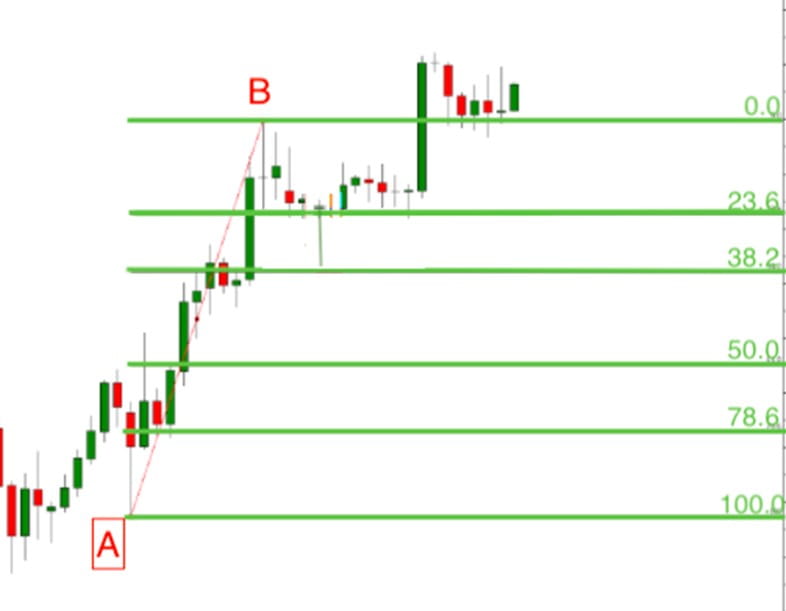
- Draw a line — the so-called baseline — connecting the highest and lowest points.
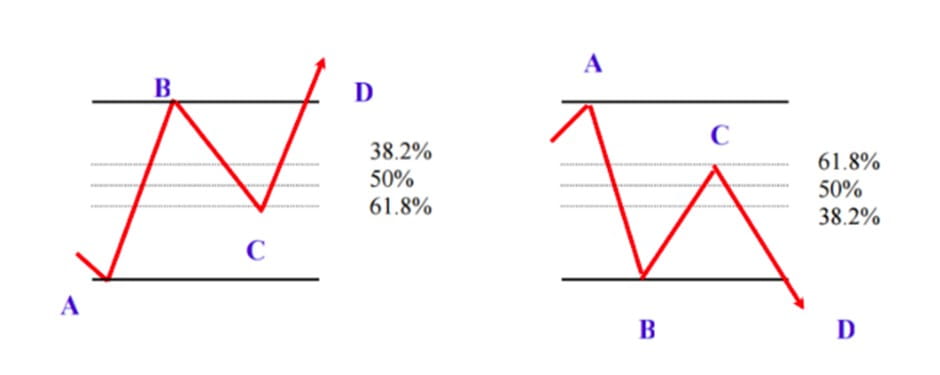
- If you're trading in a bullish trend, draw the line from the bottom to the top. If you're considering a bearish trend, the line should go from the maximum to the minimum. To make it easier, remember that you should draw the line from the left corner to the right corner.
- As soon as you draw the line, six horizontal Fibonacci levels will appear. They are 0.0%, 23.6%, 38.2%, 50%, 61.8% and 100%. You can always add additional levels if your trading strategy requires it.
- Because these levels are used as support and resistance points, the price is supposed to consolidate near them. In such a situation, the price should either break the Fibo level, which would mean the trend is strong or moving to the next level, thus signalling a continuation of the correction.
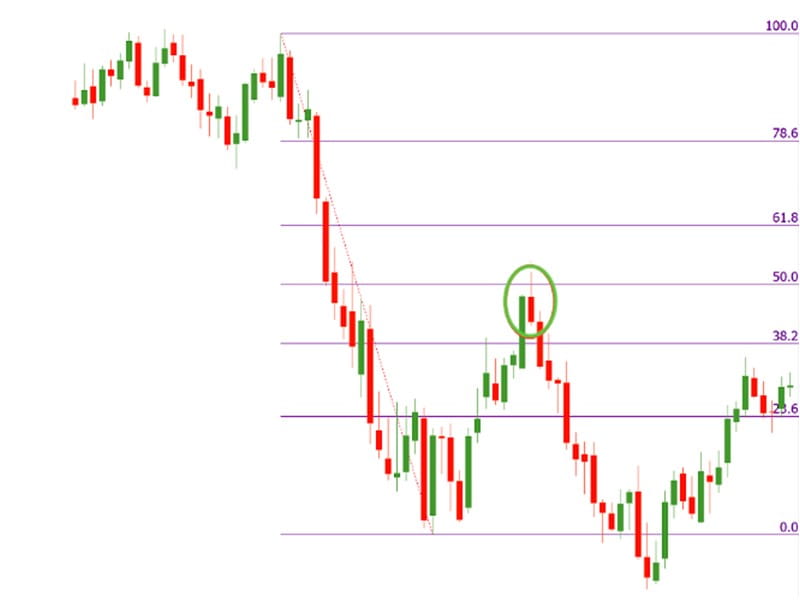
Fibonacci levels are widely used in the swing trading strategy. When approaching Fibonacci retracement levels, the price starts to consolidate.
Consider some signals the levels may provide.
- If the price moves by more than 61.8% of the preceding movement, there's a chance it will hit the level of the beginning of the trend.
- The 50% level is one of the most crucial ones. If there's an uptrend and the price breaks above it, that's a signal to buy. If the price is moving in a downtrend, it's a sign of a short position.
- The essential levels where the price shows the strongest reactions are at 50%, 61.8% and 78.6%.
How to Trade Using Fibonacci Retracement
You can trade on Fibo retracement either in an aggressive or conservative way.
- Trade aggressively. During corrections, you can place new trades on each level of Fibo retracement against the prevailing trend.
- Trade conservatively. If you believe the trend will resume, wait for the price to move in the direction of the trend after it rebounds from Fibonacci levels.
A crucial benefit of Fibonacci levels is that you can use them on different timeframes. That means you can apply this tool to several Fibonacci charts at once. If the levels converge, the signal is more prominent.
Fibonacci levels are considered support and resistance points that should prevent further price movement, and usually, the price exceeds them. So, you need to wait for confirmation from other indicators.
Fibonacci Retracement and Other Indicators
Fibonacci retracement levels are reliable levels for entry and exit positions. However, like any other instrument, Fibonacci tools don't guarantee 100% success. We recommend combining their signals with other indicators.
Fibonacci tools don't guarantee 100% success. That's why you should combine them with other indicators and patterns.
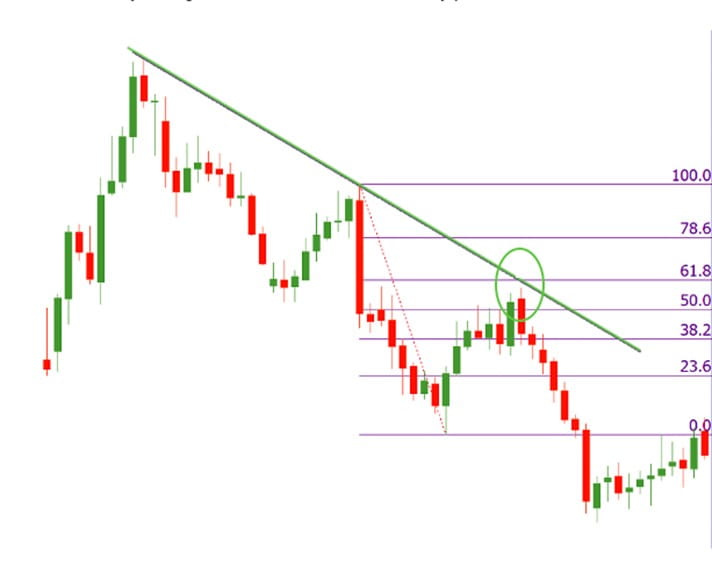
- Trend line. Because the main aim of the Fibonacci retracement is to signal the most reliable support and resistance levels, you can confirm the signal by drawing a trend line. If the trend line and any of the levels coincide, this point may become the most forceful support or resistance level.
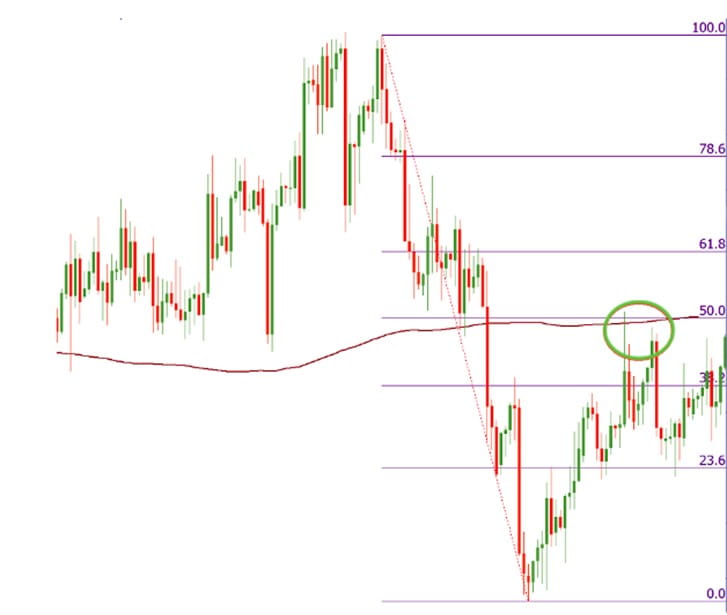
- Moving Average. As we mentioned above, 50% is a substantial level that determines where the market will move in the future. Moving Averages are also a useful tool to find support and resistance levels. You can apply a 200-period Moving Average on the chart. As such, if the 50% level intersects the 200-period MA, that's a strong level to Take-Profit and continue trading in the direction of the primary trend.
- Candlestick patterns. If you need a confirmation of a reversal, you can use candlestick patterns. If you find any of the reversal patterns near the Fibo retracement level, it's a signal the market may turn around
We mentioned the most famous levels of the Fibonacci retracement end up with 100%. But what if the price moves beyond it? For that, there's a Fibonacci expansion tool.
What Is a Fibonacci Expansion?
If you want to use Fibonacci expansions, you should know about two waves.
- The first one is AB, which represents the entire trend. The distance between A and B amounts to 100%.
- The second wave is BC, which represents a correction of the primary trend. Point C is the start of the expansion. The expansion levels are 61.8% and 161.8%. There can also be two additional points: 261.8% and 423.6%.
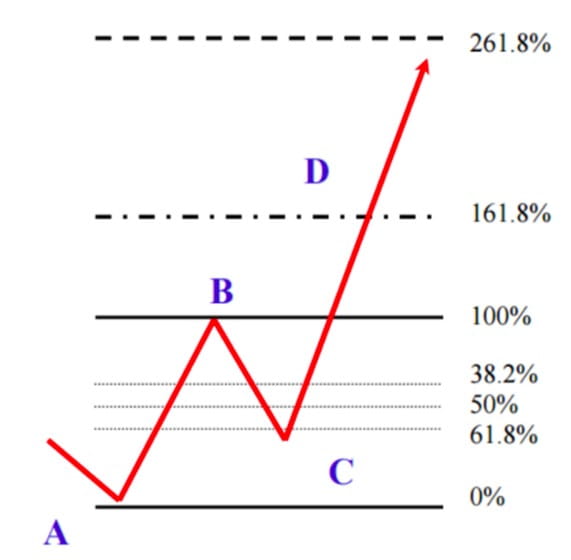
In general, three points are required to implement the tool. You need to determine the start of a new trend. After that, you'll need to find a higher low if you're trading in the downtrend or a lower high in case of an uptrend.
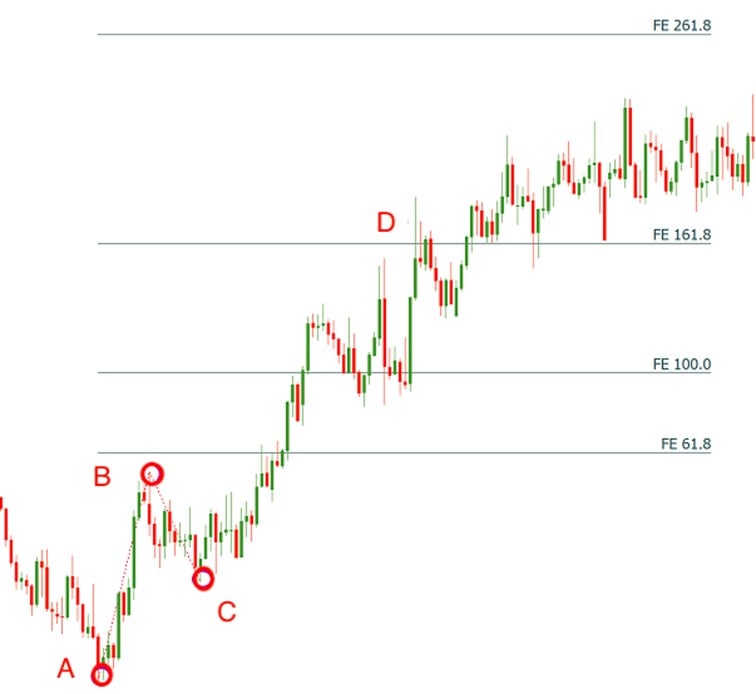
Let's consider an example. We have a price chart on which we connect points A and B to determine the strength of the trend. After that, we need to select the Fibonacci tool again by clicking on the baseline. We draw the second line, dragging the line to the third top or bottom (Point C). All three points should connect.
How to Trade a Fibonacci Expansion
There are two points where you can open a position.
- The entry point may lie at one of the Fibonacci retracement levels (38.2%, 50% or 61.8%). For instance, at point C.
- Or, you can place the trade when the price is beyond point B (end of the first wave).
The Take-Profit level will lie at 161.8%. If the third line is strong, the price may move to the next levels, for example, 261.8%.
Fibonacci Drawbacks
Although Fibonacci tools are widely used by traders, some limitations should be considered when applying them.
- Subjective approach. There's a precise rule on how to draw the lines, but not all traders place the tool in the same way. It's hard to determine the point of the beginning of the baseline and the point of the end of the baseline. Some traders place it on the open or close prices of the candlestick or the lowest and the highest points of candlestick's shadows.
- Not fully accurate. Although Fibonacci levels work as support and resistance levels, the price often goes beyond them, which confuses traders. To avoid mistakes, you need to combine Fibo tools with other indicators.
Fibonacci Retracement Strategy
Previously, we mentioned how you can use Fibonacci tools to enter and exit positions, but there are other strategies you can apply to your trading.
Fibonacci and Candlesticks
As we said above, it's never enough to use Fibonacci tools alone. To get confirmation, you can use candlesticks. Because the main idea of the Fibonacci level is to determine price corrections, you should use reversal candlestick patterns that will confirm the correction.
The most famous patterns are the 'hammer' and 'shooting star'. Hammer is a bullish pattern that signals the end of the downtrend. The shooting star is a bearish pattern that determines the end of the uptrend.
Trade in the uptrend
Step 1. Find a strong uptrend. Draw Fibonacci levels from the lowest to the highest levels.
Step 2. Wait for the price chart to form the bullish reversal pattern, i.e., hammer. Enter the market with a long position.
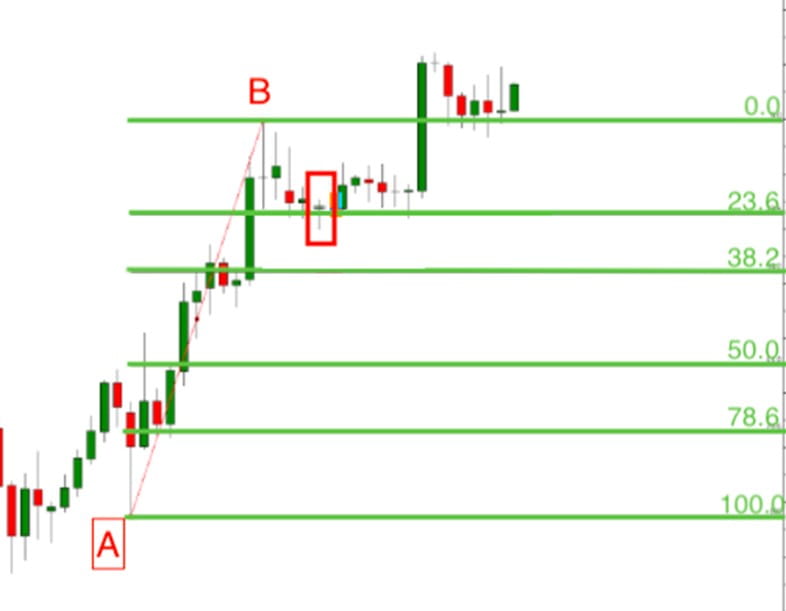
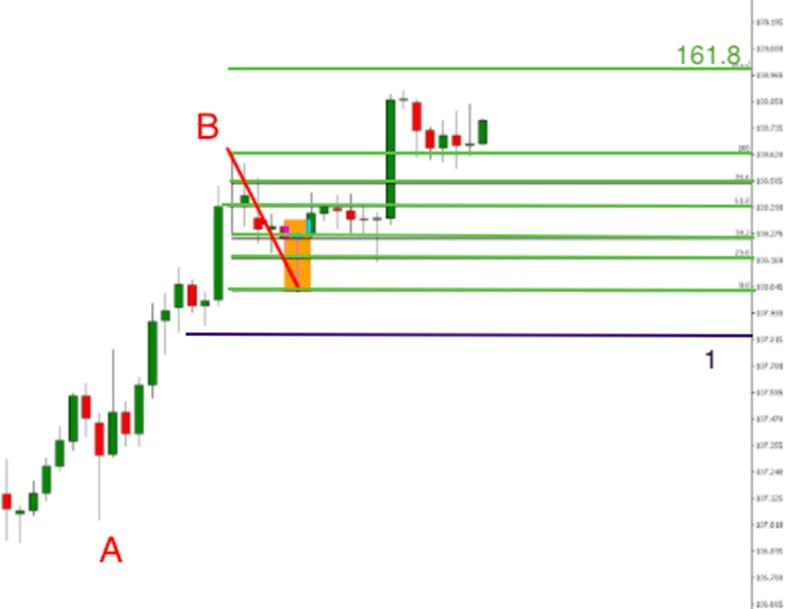
Step 3. The price target should be placed at a 161.8% Fibonacci extension level. To find this level, you need to draw a line from point B (the highest point of the trend) to the low of the hammer candlestick.

Step 4. Place a Stop-Loss. The market can always move in the opposite direction. So, it's crucial to place a Stop-Loss level (1). The Stop-Loss should be placed below the entry point.
Trade the downtrend
You can apply the same strategy to the downtrend.
Step 1. Find a strong downtrend and draw the line from the highest level to the lowest level of the trend.
Step 2. Wait for a bullish candlestick pattern — for example, a shooting star. Place the sell position at this level.
Step 3. Place the Take-Profit order at a 161.8% Fibonacci extension level. To get the 161.8% level, you need to draw the second line from the lowest point to the level of the candlestick.
Step 4. Don't forget about the Stop-Loss order. Place the level above the reversal candlestick.
Conclusion
Fibonacci tools are one of the most reliable instruments for forex trading. They allow you to determine strong support and resistance levels together with the perfect entry and exit points. However, like any other indicator, they have drawbacks.
It's not easy to draw Fibonacci levels. To know how to place them correctly, you should practice your trading skills. A Libertex demo account allows you to draw as many Fibonacci levels as you want. You can also check whether the signal would work on the previous price movements.
Here are answers to some of the questions you still may have.
FAQ
What Is Fibonacci Trading?
It's trading on specific levels that determine possible market corrections.
Does Fibonacci Work in Trading?
Sure, Fibonacci tools are one of the most reliable trading instruments. Fibonacci levels represent strong support and resistance levels along with crucial entry and exit points. However, you should always remember the signal confirmations.
How Do You Use Fibonacci in Trading?
There are two main instruments traders use. These are Fibonacci retracement and expansion levels. These levels determine the support and resistance levels.
Why Is Fibonacci Important?
Fibonacci is used only as a separate instrument but in a famous theory, like that of Elliott Waves. Fibonacci determines strong entry and Take-Profit points.
What Are the Fibonacci Retracement Numbers?
The retracement numbers are 23.6%, 38.2%, 61.8% and 78.6%. Also, the 50% level is considered one of the crucial points. The levels at 0% and 100% serve as starting points.
What Does the Fibonacci Spiral Mean?
The spiral of Fibonacci is a sequence of numbers that starts from zero. Every following number is a sum of two previous numbers. These numbers are used to calculate Fibonacci levels.
Disclaimer: The information in this article is not intended to be and does not constitute investment advice or any other form of advice or recommendation of any sort offered or endorsed by Libertex. Past performance does not guarantee future results.
Why trade with Libertex?
- Get access to a free demo account free of charge.
- Enjoy technical support from an operator 5 days a week, from 9 a.m. to 9 p.m. (Central European Standard Time).
- Use a multiplier of up to 1:30 (for retail clients).
- Operate on a platform for any device: Libertex and MetaTrader.