S&P 500 Forecast: Will Stock Markets Continue to Rally?
Prepared by the Libertex team
Content reviewed internally in accordance with regulatory standards.
With America's top 500 companies whose common stock is listed on the New York Stock Exchange or NASDAQ, S&P 500 captures the pulse of the US corporate economy. This article will cover the basics of this index, what factors drive it, its performance and its outlook.
What Is the S&P 500?
One of the most highly followed equity indices in the world, the Standard and Poor's 500 (S&P 500) is a stock market index that tracks the performance of the 500 largest companies listed on stock exchanges in the United States. This index is regarded as the most accurate indicator of how the US stocks perform overall.
The S&P 500 is weighted by market capitalisation. Companies with a high valuation, such as Apple and Amazon, have a larger impact on the index than smaller ones, such as Macy's. Based on it, this index keeps fluctuating throughout the day.
Top Factors That May Impact the S&P 500
Put simply, anything that adversely affects the US economy harms this index.
The Federal Reserve, the United States' central bank that controls monetary policy, has a major role in how stock markets operate. As it took a patient stance in 2020, interest rates were halted and lowered. COVID-19 led the Fed to decrease interest rates, presenting a more favourable investment opportunity.
The current and expected future state of international affairs also directly impacts this index. The US-China trade talks and Brexit are noteworthy political events largely affecting the index price movements.
A Historical Overview of the S&P 500
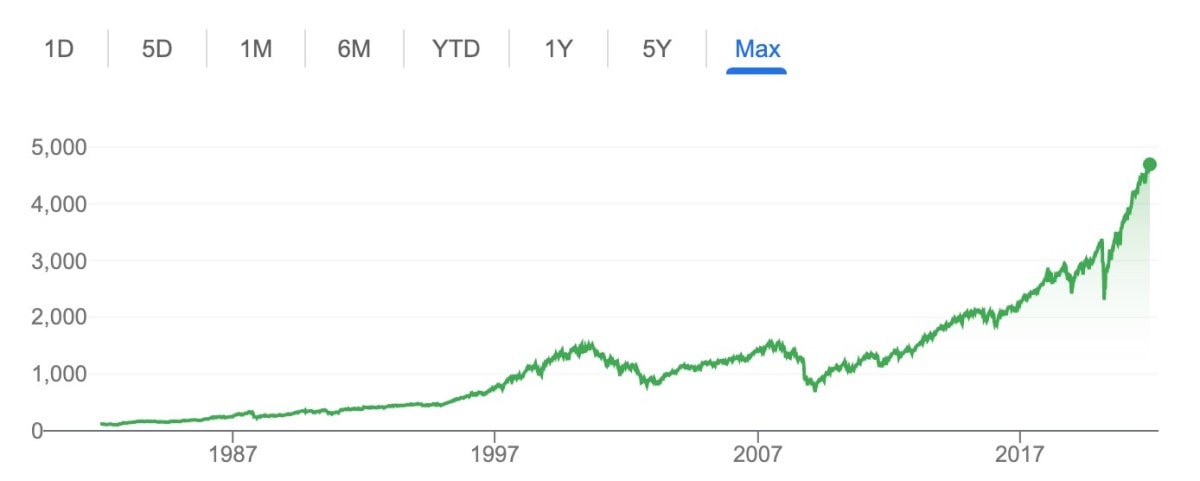
In its 64-year history, the S&P 500 has achieved impressive milestones and witnessed severe blows.
- Against the booming economic backdrop following World War II, this index increased to around 700.
- From 1969 to 1981, the index slowly declined to below 300 due to pricing inflation and stagnant economic growth.
- Due to the Great Recession, the index fell by a drastic 57.7% in a bearish movement from October 2007 to March 2009.
- By March 2013, the index had recovered entirely, increasing over 400%.
- In 2020, the index again dropped by 51% as the COVID-19 pandemic hit the equity markets full force.
The Current S&P 500 Index
According to the Wall Street Journal's market outlook, the S&P 500 was valued at 4,697.96 in late November 2021.
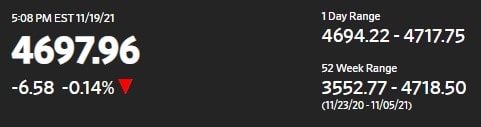
This is preceded by a period of consistently high prices where the S&P 500 stayed roughly between 4,600 and 4,700, further heightening investor confidence. This index has an astonishing market cap of $40.3 trillion.
Short-Term S&P 500 Price Prediction for 2021-2022
For December 2021, Long Forecast has predicted the S&P 500 to close at 4,803. It's a significant increase (above 4.10%) over the value in November 2021.
Many world-renowned brokerages have forecasted a promising S&P 500 outlook for next year. The multinational investment banking company Goldman Sachs has quoted a price target of 5,100 for the end of the year. In contrast, Wells Fargo, the multinational financial investment strategist, predicts that the value can go as high as 5,300.
While some might call such figures an overestimate, it's worth mentioning that even those who predicted lower values (4,400 by Morgan Stanley and 5,050 by Royal Bank of Canada) are expecting an uptrend line in the S&P 500 value.
Long-Term S&P 500 Forecast: The Next 5 Years
For future performance, most predictions rely upon more federal stimulus money, further inflating the prices of equities. The current tech bubble is expected to continue for a few years and result in annualised index growth, per the forecast.
By 2026, Forbes estimates that the minimum value of the index would be around 2,000, while it expects that the maximum could even hit the 5,000 mark.
Long-Term S&P 500 Prediction: The Next 10 Years
The forecast for the long term is seemingly bright. Over the next ten years, i.e., by 2030, Bank of America predicts that this index will have a 47% to 61% overall upside. If predictions can even be slightly relied upon, the outlook is highly positive, with the expected value of the S&P 500 going way beyond the 10,000 mark by 2030.
S&P 500 Technical Analysis
Although the moving averages are neutral for the index, other technical indicators suggest a strong buy on daily, weekly and monthly charts. Additionally, the ultimate oscillator and ROC are both indicating towards buying. This is bound to bring buying pressure and create an attractive option for traders and investors.
S&P 500 Forecast by Experts
Many Wall Street analysts have predicted a bullish trend for this index. While it's easier to make predictions for the short term, experts are finding it increasingly difficult to tell where the market is headed in the long run.
Despite this, there are professionals such as Alla Harmsworth, co-head of Institutional Solutions and head of Alphalytics at AllianceBernstein, whose vision has set a decade-end target price of 8,000 by 2030.
Robert Sluymer, a technical analyst at Fundstrat, made an eye-popping prediction of the S&P 500 reaching 14,000 by the end of this decade!
What to Do With the S&P 500: Trade or Invest?
According to the index performance in 2021 and the forecasts for the next few years, both trading and investment seem to be worth it. However, those looking for short-term solutions and preferring quick gains might find trading the more attractive option and a riskier one.
To design an investment strategy or simply learn where to begin, you can experiment in a Libertex demo account before stepping into real-world trading and investing.
Conclusion
Forecasts for the S&P 500 show a potential upside, but many factors impact the index's performance, meaning anything can happen to it. You can simulate trading and investment activity with this index to see how it works by opening a risk-free Libertex demo account first.
FAQ
Is It a Good Time to Invest in the S&P 500?
According to the current market situation and the prediction for the last month of 2021, a bull market is expected, making it a relatively safe time to invest in the S&P 500.
Will the S&P 500 Go Up in 2022?
For the coming year, it's forecasted that the S&P 500 will go up and cross the 5,000 mark with no downgrade in the value expected.
Will the S&P 500 Ever Crash?
Although most predictions suggest a promising future, the volatile nature of this market means that anything — from incredible surges to shocking crashes — is possible.
Does the S&P 500 Pay Dividends?
Around 84% of the 500 companies listed on this index pay dividends.
What Is the Highest the S&P 500 Has Ever Been?
In late November 2021, it had an all-time high with an intraday value of 4,718.50.
What Is the S&P 500's Return for the Year?
The total year-to-date return for 2021 is 26.67%, while the price return is 25.08%.
Why Is the S&P 500 So Important?
It's viewed as an essential benchmark for the US stock market.
Disclaimer: The information in this article is not intended to be and does not constitute investment advice or any other form of advice or recommendation of any sort offered or endorsed by Libertex. Past performance does not guarantee future results.
Why trade with Libertex?
- Get access to a free demo account free of charge.
- Enjoy technical support from an operator 5 days a week, from 9 a.m. to 9 p.m. (Central European Standard Time).
- Use a multiplier of up to 1:30 (for retail clients).
- Operate on a platform for any device: Libertex and MetaTrader.