
What Is the S&P 500?
Prepared by the Libertex team
Content reviewed internally in accordance with regulatory standards.
The Standard & Poor's 500 Index, known by its shorthand as the S&P 500, is arguably the most important stock index in the world. It's made up of 500 companies, including many of the largest companies in the world.
The index is widely followed and used as a reference for the most liquid exchange-traded funds and derivatives in the world.
S&P 500 definition
The S&P 500 index is an index of 500 of the most valuable listed companies in America. The index is market cap-weighted and includes the 500 most valuable companies that are profitable, headquartered and publicly listed in the United States.
History of the S&P 500
The index that later became the S&P 500 was originally launched in 1923 by the Standard Statistics company. At that point, the index included 90 companies in 26 industries. In 1957, the index was introduced in its present form, and the number of companies was increased to 500.
Some of the biggest financial product innovations of the last 50 years have been based on the index. In 1976, the world's first index fund was launched and designed to track the performance of the S&P 500. In 1982 the first index futures contract, which is also based on the S&P 500 index, was launched. In 1993, the world's first exchange-traded fund, which also tracks the index, was launched.
As of 2018, the index covered 83% of the market value of all US-based listed companies. Another 2,500 companies account for most of the remaining 17% of the market value of US-listed companies.

How the S&P 500 is calculated
The index is weighted according to each company's market capitalisation. The following steps are used to calculate the weight of each component:
- Calculate the market capitalisation (or market cap) of each company by multiplying the number of outstanding free float shares by the share price.
- Add up the market caps of all 500 companies.
- Divide the market cap of each company by the total market cap of all 500 companies.
To calculate the index's value, each company's market cap is multiplied by its weight. Then, the weighted values are added together. The total is then divided by a base year value and multiplied by 100.
How Does the S&P 500 Work?
The index is managed by the US Index Committee at S&P Dow Jones Indices. The committee meets monthly to evaluate the current constituent companies and any changes that may be made.
For a company to be eligible for inclusion, certain criteria besides the company's market value must be met. A company's stock must be highly liquid and have a public free float of at least 50% of outstanding shares. The company's earnings for the last quarter and for the previous 12 months must be positive, too.
The index is rebalanced quarterly. Companies that qualify for inclusion are added to the index, while companies that no longer qualify are removed from it.
The index is calculated using the prices of the securities in the index, so the index itself cannot be traded. However, a large number of financial products use the index as a reference price or track the index by holding the same securities in the same proportion as the index. These include derivatives like futures and options and funds like mutual funds and exchange-traded funds.
S&P 500 Companies
As of 29 September 2020, the following were the 20 largest constituents of the index.
|
Company |
Symbol |
Industry |
Weight |
|
AAPL |
Consumer Electronics |
6.65% |
|
|
MSFT |
Software |
5.71% |
|
|
AMZN |
Internet Retail |
4.87% |
|
|
FB |
Internet |
2.22% |
|
|
Alphabet Inc |
GOOGL |
Internet |
1.58% |
|
Alphabet Inc |
GOOG |
Internet |
1.55% |
|
Berkshire Hathaway Inc |
BRK.B |
Insurance |
1.52% |
|
JNJ |
Drug Manufacturers |
1.39% |
|
|
PG |
Household and Personal |
1.24% |
|
|
V |
Credit Services |
1.22% |
|
|
NVDA |
Semiconductors |
1.16% |
|
|
MA |
Credit Services |
1.08% |
|
|
HD |
Home Improvements |
1.06% |
|
|
JPM |
Banks |
1.05% |
|
|
UNH |
Healthcare Plans |
1.04% |
|
|
VZ |
Communication Services |
0.88% |
|
|
ADBE |
Software |
0.84% |
|
|
DIS |
Communication Services |
0.82% |
|
|
PayPal Holdings Inc |
PYPL |
Credit Services |
0.81% |
|
CRM |
Software |
0.81% |
The 10 most-valuable component companies account for 28% of the index's value, and the 50 most-valuable companies account for 55% of the index.
The leading sectors in the index are information technology, healthcare and communications, which account for 26%, 15% and 11% of the index, respectively.

Pros and Cons of S&P 500 Index
Pros
- The S&P 500 index includes many of the most successful companies in the world. Silicon Valley has produced 8 of the largest 10 technology companies in the world. These eight rapidly growing companies are all in the index.
- The index and products based on it are the most liquid in the world. The S&P 500 is widely followed and used as a benchmark for funds and the performance of the stock market in general.
- Trading instruments like CFDs, futures and ETFs that are based on the index are amongst the cheapest and most liquid to trade.
Cons
- With so many companies in the index, it may be slow to respond to changes in the performance of certain sectors.
- Although the S&P 500 index includes many of the largest companies in the world, some notable companies that are not headquartered in the US are excluded.
- ,The S&P 500 is heavily influenced by large technology companies (Apple, Amazon, Microsoft etc.). If these companies underperform, it will affect the index significantly. However, the effect won't be very visible as the index itself is the benchmark against which most investments are measured.
S&P 500 vs other indices
S&P 500 vs Dow Jones
The two most widely tracked indices in North America and possibly in the world are the S&P 500 and the Dow Jones Industrial Average. The two indices differ in three ways. Firstly, the Dow includes just 30 stocks, while the S&P 500 includes 500. Secondly, the Dow index is calculated by simply adding up the prices of the 30 stocks rather than considering the market value. When it comes to constructing an index, prices are an arbitrary measure to use. Finally, while the S&P 500 has objective criteria for including companies, there are no particular criteria for choosing Dow 30 components.
Despite all these differences, the performance of the two indices is quite similar. The Dow outperformed slightly prior to 2010, and the S&P 500 has outperformed slightly since then.
S&P 500 vs Nikkei 225
The Nikkei 225 index is one of two leading stock market indices in Japan. As the name implies, the index includes 225 companies, which are also the largest public companies in Japan. The biggest difference between the S&P 500 index and the Nikkei 225 is that the Japanese index is price-weighted like the Dow 30, while the S&P 500 is market-cap-weighted.
The Nikkei index was one of the world's top-performing indices during the 1980s but has underperformed for much of the period since then. Since 2010, the S&P 500 has returned 240%, while the Nikkei has returned about 120%.
S&P 500 vs CAC 40
The CAC 40 is the benchmark index for France's stock market. The index includes the 40 most-valuable public companies in France and is weighted by market capitalisation.
The CAC 40 index is exposed to quite different sectors when compared to the S&P 500. While the S&P's leading sectors are technology, healthcare and communications, the CAC 40's leading sectors are consumer and industrial companies. This is one of the reasons the CAC 40 has underperformed the S&P 500 substantially since 2012.
S&P 500 vs Russell 2000
The Russell 2000 index is another widely followed US index. This index differs substantially from the S&P 500 in that it includes small-cap companies. Specifically, the index is constructed by considering the 3,000 largest companies in America and then excluding the largest 1,000.
The Russell 2000 index tends to perform well during strong bull markets and underperforms the S&P 500 during bear markets and corrections. It has underperformed the S&P 500 significantly since mid-2018.
Why trade the S&P 500 Index
There are lots of reasons to invest in the S&P 500 index for the long term. But, while the returns are respectable, they're relatively modest. Actively trading the index is one way to improve returns.
By trading the index using instruments like CFDs or futures, you can capture all the positive and negative short-term movements that ultimately result in modest annual returns. You can also use leverage to increase the size of returns when trading, though the use of leverage is risky and may result in the loss of capital invested.
How to trade the S&P 500

S&P 500 trading hours
The index is based on US stock prices, so the index itself is updated during US trading hours which are 09:30 am to 4:00 pm EST. These are the hours during which the market is most liquid.
However, various S&P 500 derivatives like futures and options trade around the clock. The official S&P futures market is open from 6:00 pm EST on Sunday until 5:00 pm on Friday, with a break from 4:15 pm to 4:30 pm every day. Most CFD brokers follow these hours, though some vary slightly.
Fundamental analysis of S&P 500
The value of the S&P 500 index is affected by a lot of different factors. Over the long term, the index reflects the growth in corporate profits for America's largest companies.
In the medium term, both the economy and demand for equities affect their value. The ratio between the value of the index and company earnings (the PE ratio) has varied a lot over time. While the long-term average PE ratio is around 16, it has been considerably higher over the past decade.
In the short term, geo-political events, corporate news and speculation about interest rates affect the index.
Many of the companies in the index operate around the world, so it's not just the US economy but the global economy that affects the index.
With 500 different companies in the index, forecasting price movements using economic and company data is very difficult. Price action is a more reliable indicator of what is happening.
Technical analysis of the S&P 500
- Every trader develops their own approach to analysing S&P 500 charts. However, the following observations may help.
- Timeframes: The index is quite challenging to trade on very short timeframes. Moves will be more reliable if you look for trades that have a time horizon of days and weeks.
- The 50-day moving is a good indicator of the medium-term trend. Trading in the same direction as this moving average will mean you're trading with the medium-term trend, which is often more reliable than shorter trends.
- There are lots of different price oscillators to use, but the RSI and Stochastic oscillators are all you really need.
- Bollinger bands can also be used to identify the trading range.
Tips and tricks for trading the S&P 500
- Look for patterns that repeat in the charts. Use a combination of 4-hour, daily and weekly charts to increase the number of patterns you can find.
- Always use a Stop-Loss. At times, the index can become quite volatile and unpredictable. A Stop-Loss will help you minimise losses.
- Scale out of your winning trades. The index can often move more than anticipated, but you also need to lock in profits along the way.
- Treat short positions with caution. When the index declines, it often reverses very quickly.

What is CFD trading of S&P 500
CFDs are a type of derivative instrument, similar to futures contracts. They allow traders to open both long and short positions using leverage. CFDs can be traded on any liquid assets, including indices, stocks, currencies, cryptocurrencies and commodities.
They offer more flexibility than other types of derivatives. You can start trading CFDs with any account size, and you can trade several asset classes using one trading platform like the Libertex platform.
Because CFDs are traded using margin, only a small percentage of the value of a position needs to be deposited before making a trade. CFDs are also easier to short-sell than other instruments.
The best strategies for trading the S&P 500
The following strategies have worked well for the S&P 500 over the past decade. That doesn't mean they'll continue to be successful, but they're worth considering while they continue to be profitable.
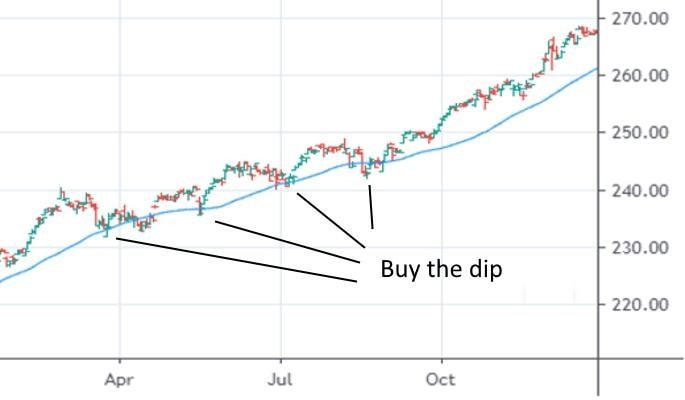
Buy the dip
Since the index's 2009 low, one of the most successful strategies has been to simply buy S&P 500 CFDs whenever there is a dip in the price. This may seem overly simplistic, but it has been remarkably successful.
Most of the time, the index falls around 3-6% before continuing higher. One way to implement this strategy is to wait for a correction of at least 3% and then wait for a bigger-than-normal up day. The last thing to check is that the 50-day moving average is still heading higher and has not turned downward.
If the index falls more than 6%, the 50-day moving average will probably begin to fall, too. In this case, you'll want to make sure the index has broken the short-term downtrend and crossed above the moving average before buying.
You never know how much the price can rise after a small correction, so it's best to scale out of the position.
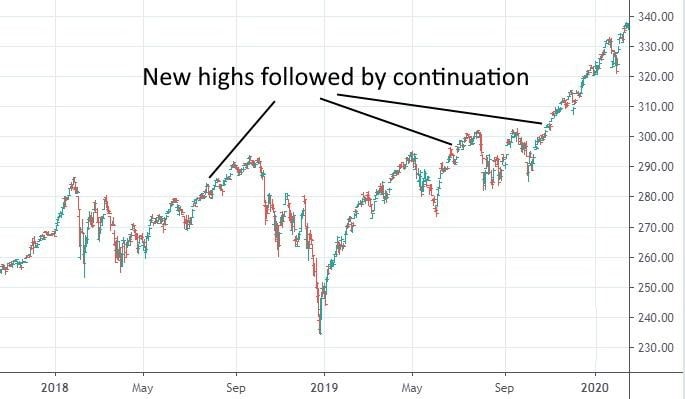
New highs
The S&P 500 often adds 5% to 10% after it breaks its previous all-time high. This allows you to enter trades with a favourable risk-to-reward ratio just after a previous high is breached. If you place your Stop-Loss just below the previous high and begin scaling out of the trade when the profit level reaches 5%, your profits should outweigh the occasional loss.
Alternatively, when the index makes a new high, you can wait for it to pull back and test the breakout level.
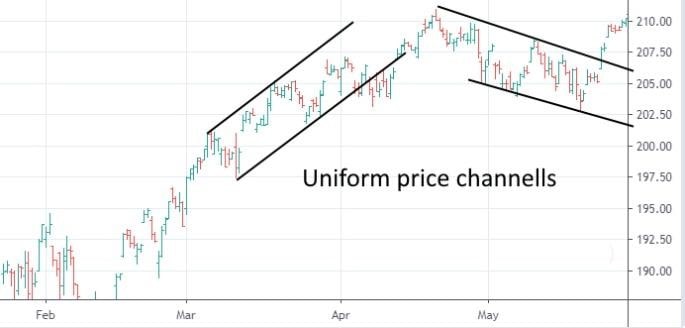
Swing trading
Sometimes the index trades in a channel that rises slightly or declines slightly. During these periods, the price action is quite sluggish, but the price swings are fairly uniform in size.
This is a good time to swing trade within the channel. You can trade long and short positions in line with the medium-term trend. Remember that, at some point, the price will break out of the channel, and a new trend will emerge. So, you'll need to exit positions and move to a different strategy if and when that happens.
Interesting Facts About the S&P 500 Index
- Tesla is not included in the index despite being the 14th most-valuable company listed in America. Although Tesla was profitable for four consecutive quarters by September 2020, the S&P Index Committee may disagree with certain accounting methods.
- Since 1968, the S&P 500 index has been a component of The Conference Board Leading Economic Index. It's the only stock market index used as part of a broader index for the health of the economy.
- While the companies in the index are all based in the US, as much as 40% of the revenue they earn comes from other countries.
- As of September 2020, there were actually 506 stocks in the index. The reason is that some companies issue different classes of shares. So, there are only 500 companies in the index, but six of those companies have two classes of shares.

The index was expanded to 500 companies in 1957. Of the initial 500 companies, only 86 remain in the index. While some companies have gone bankrupt or declined, most companies no longer in the index were acquired or merged with other companies.
Conclusion
If you invest in only one index, it should probably be the S&P 500. It includes many of the most successful and rapidly growing companies in the world. If you invest 30% to 70% of your portfolio in the index, you can be far more selective with the other stocks you own. After all, by investing in the index, you're investing in Apple, Alphabet (Google), Microsoft, Amazon, Facebook and countless other great companies.
When it comes to trading, the index is very liquid and cheap to trade. However, because it's traded by so many people, trading on very short timeframes is challenging. That said, it's a very good index to trade if your time horizon is 10 to 30 days.
You can trade index CFDs with Libertex. But please note that trading CFDs with leverage can be risky and can lead to losing all of your invested capital. If you want to get started,you can open a risk-free demo account today. This will allow you to get used to the trading platform and learn more about trading the S&P 500 Index at no risk or cost.
Libertexis a broker and trading platform that offers CFDs, stocks, commodities, indices, ETFs and cryptocurrencies with leverage for retail clients 1:30. The platform offers free trading tutorials and state of the art trading tools.
FAQ
What does S&P 500 stand for?
S&P stands for Standard and Poor's, the company that introduced the index. The index is now managed by S&P Dow Jones Indices. The number '500' indicates the number of companies in the index.
How is the S&P 500 calculated?
The index is weighted according to the market capitalisation of each company. The sum of the weighted values is then divided by the same value from a base year and multiplied by 100.
Is the S&P 500 Expensive?
As of October 2020, the S&P 500 Index is quite expensive compared to its historical average. However, its valuation does sometimes remain elevated for years at a time.
What is the 10-year average return on the S&P 500?
Over the past 10 years, the average annual return for the index has been 18.9%.
Can the S&P 500 go to zero?
Theoretically, yes, but that would imply investors attribute no value whatsoever to any companies in the index. The likelihood is virtually zero.
How many sectors are included in the S&P 500 index?
The index includes companies in 11 different sectors.
Should I invest in the S&P 500?
It's a very good idea to invest in the index as it will give you exposure to the most successful public companies in the US.
Disclaimer: The information in this article is not intended to be and does not constitute investment advice or any other form of advice or recommendation of any sort offered or endorsed by Libertex. Past performance does not guarantee future results.
Why trade with Libertex?
- Get access to a free demo account free of charge.
- Enjoy technical support from an operator 5 days a week, from 9 a.m. to 9 p.m. (Central European Standard Time).
- Use a multiplier of up to 1:30 (for retail clients).
- Operate on a platform for any device: Libertex and MetaTrader.