Stochastic Oscillator: Find Your Reversal Point
Prepared by the Libertex team
Content reviewed internally in accordance with regulatory standards.
The stochastic oscillator is one of the most useful indicators among traders worldwide. It was developed at the end of the 1950s and, since then, its popularity has only increased. Why do traders like this indicator, and how can you catch its signals? We have created a complete guide that will tell you everything you need to know about the stochastic oscillator.
What Is the Stochastic Oscillator?
The stochastic oscillator is one of the technical instruments traders use to identify buy and sell signals and the trend direction. It measures market momentum and shows possible trend reversals.
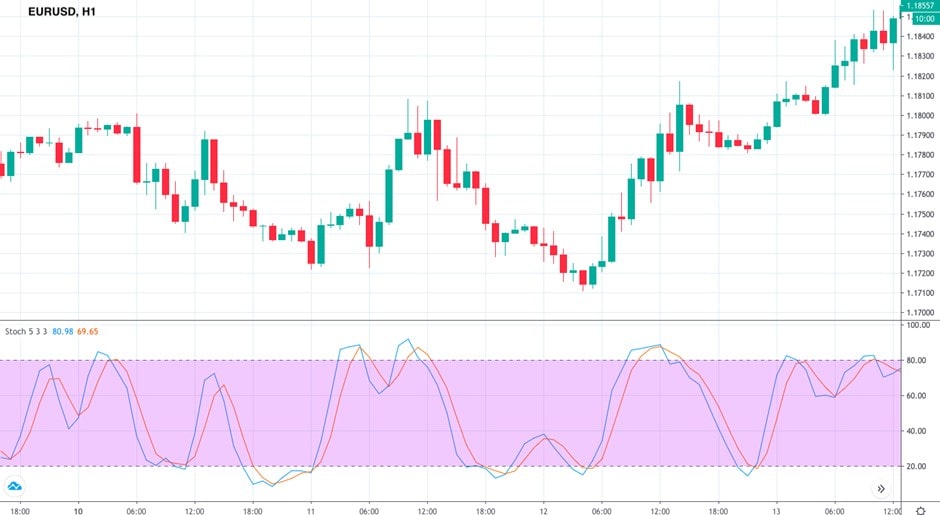
The stochastic oscillator consists of two lines, %K and %D. It's located in the window below the price chart.
The indicator consists of two lines. The fast line is called %K (blue); the slow one is %D (orange). The slow line is the moving average of the faster %K line. The stochastic oscillator, like most oscillators, is located below the price chart. See the image below.
How to Use the Stochastic Oscillator Indicator in MetaTrader 4
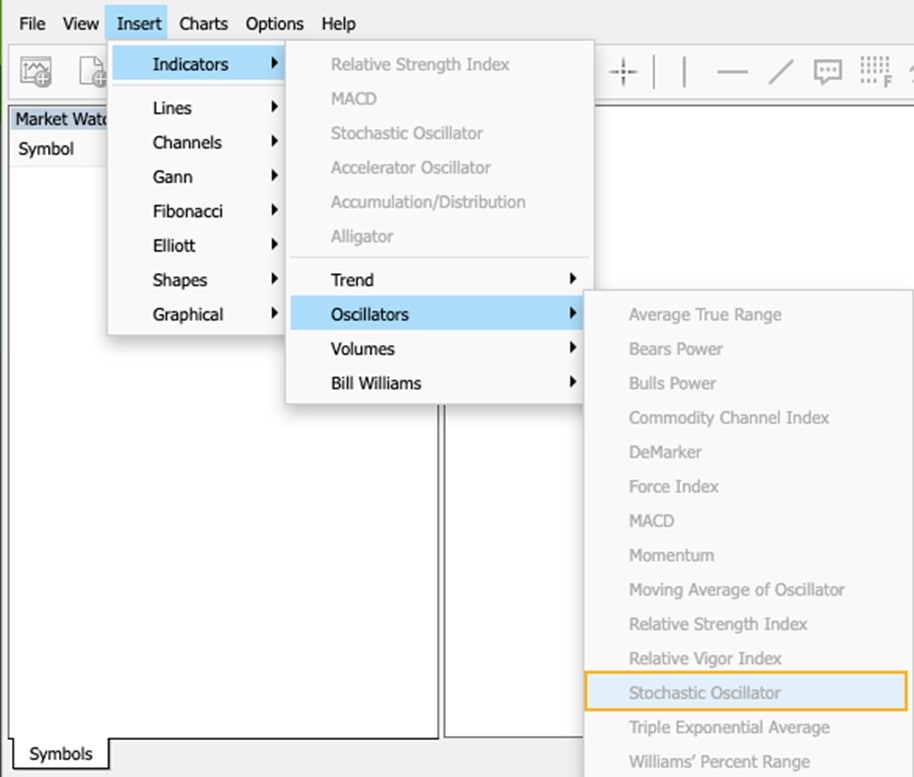
Fortunately, the oscillator is set by default in MetaTrader 4 and most trading platforms, so you don't need to download it separately. All you need to do is click 'Insert' – 'Indicators.' There, you'll see groups of indicators. Choose 'Oscillators', then 'Stochastic Oscillator'.
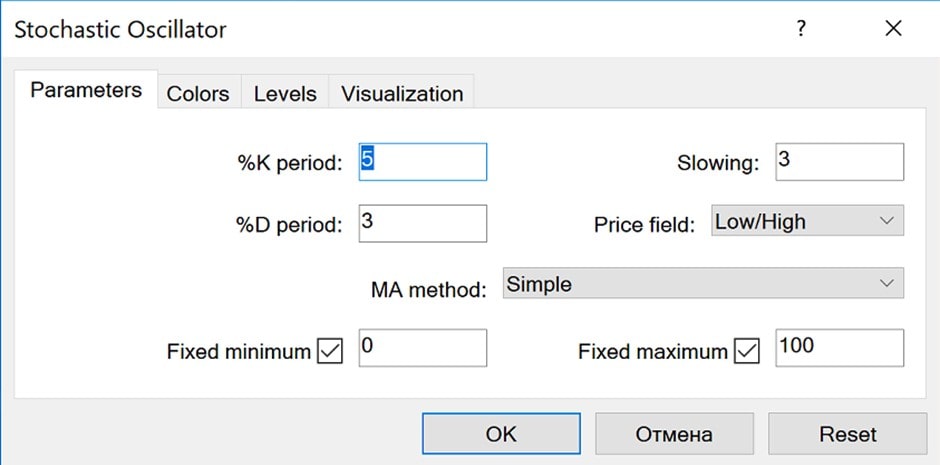
The stochastic oscillator is set by default in MetaTrader 4 and most trading platforms. The standard settings are 5 for the fast line, 3 for the slow line and 3 for slowing.
If you're familiar with technical indicators, you'll know each of them has its own unique settings. A great feature of the index is that it can be applied to any timeframe. The standard settings are 5 for the fast line, 3 for the slow line and 3 for slowing. The indicator compares close prices to prices of the specified period of the timeframe. So, the price field setting should be Low/High'.
You can still use other settings that may be more suitable for your trading strategy. For example, you can try 14 or 21 for %K, 3 or 5 for %D, or 3 or 5 for slowing.
How Is the Stochastic Oscillator Built?
Although the index is measured automatically, it's worth knowing its formula, so let's have a look at how the indicator is calculated.
As we said above, the indicator consists of two lines, each of which should be measured separately. To calculate %K, follow the next steps:
- Subtract the lowest price of the previous 14 trading sessions from the current close price.
- Subtract the lowest price of the previous 14 trading sessions from the highest price of the previous 14 trading sessions.
- Divide the first result by the second one.
- Multiply the result from the previous step by 100.
To measure the %D line, you should subtract the period simple moving average of %K from 3. %D has a slower reaction to the change of the price.
Types of Stochastic Oscillators
There are three types of stochastic oscillators: fast, slow and full. The type difference is based on the calculation.
There are three types of stochastic oscillator indicators: fast, slow and full.
Fast Stochastic Oscillator
This type reflects the current price positions regarding the set of a number of previous bars. The fast stochastic oscillator usually has the following settings: 5 for the %K line and 4 for the %D one. The fast stochastic oscillator has a quicker reaction to price changes.
As for the formula, the %K is calculated as follows:
[(Close Price – Low Price) / (High Price – Low Price)] x 100
The Fast %D line is similar to the standard formula. It's a simple moving average of the %K line with the period of 3.
Slow Stochastic Oscillator
There are not many differences from the fast stochastic. However, the slow %K is the same as the fast %D (thus, it's a 3-period moving average of the fast %K). Simultaneously, the slow %D is also a moving average but of the slow %K. The standard settings for the slow stochastic are 14 for %K and 3 for %D line. The slow stochastic oscillator limits the number of false signals.
Full Stochastic Oscillator
The full stochastic oscillator is like the slow one, but it includes an additional parameter. It allows an investor to determine the period of the simple moving average besides the standard period of 3. 14 and 3 are considered the standard settings for this type of oscillator.
Read Signals
We are at the most exciting part of this tutorial. Now, you'll learn how to read this indicator's signals.
The stochastic oscillator is a range-bound tool that moves from 0 to 100. It means you can easily determine the points when the market is overbought and oversold. It will give you potential entry and exit signals along with the possible market trend.
There are two main points: 20 and 80. When the indicator is above 80, it's a sign that the market is overbought. You can expect a downward movement. Readings below 20 signal oversold conditions. This means the market may turn up soon.
20 and 80 are the crucial points that determine when the market is oversold and overbought, respectively.
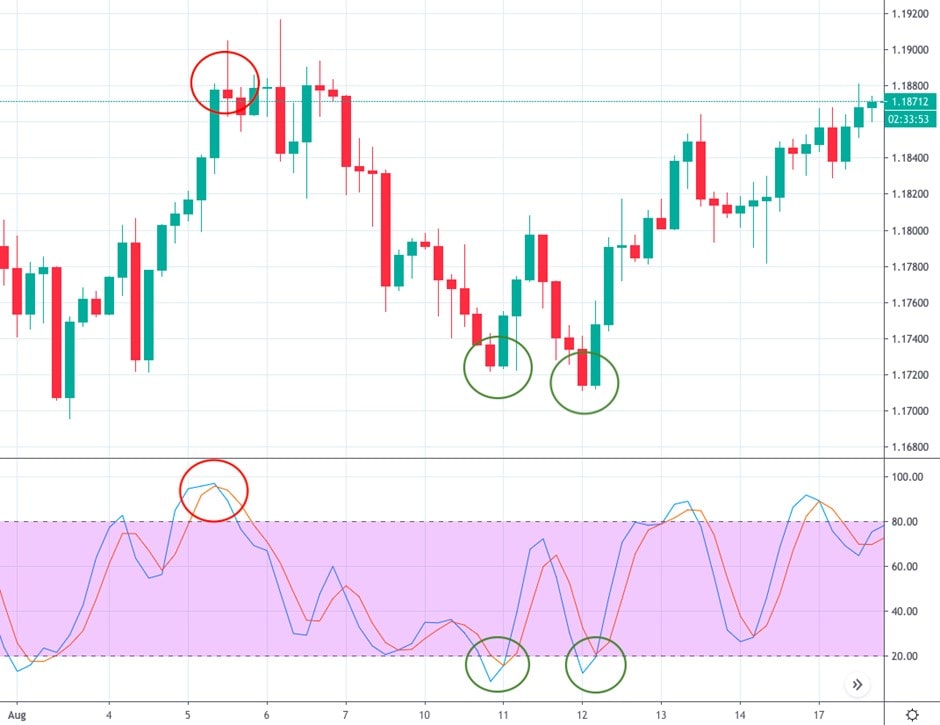
However, that's not all. When it's inside these areas, the indicator doesn't guarantee a 100% reversal. If the market trend is robust, there are risks the price won't reverse. That's why it's worth looking at the indicator's lines, as they were created for a reason.
As we mentioned above, there are two lines: %K and %D. Their interaction is crucial for forex signals. You get a sign of an upward movement when %K crosses %D from the bottom up and a signal of a downward move when %K breaks %D from the top down. However, the signs will be more precise if the cross is in the overbought area for a sell signal or in the oversold territory for a buy signal.
Previously, we warned you that there could be a stable trend that may cause false signals. We'll teach you how to avoid those.
When opening a position in one timeframe, check the current trend on a bigger one.
For example, if you trade on , check the trend on the daily one. If there's a strong trend, don't open a position against it, even if the indicator is in extreme areas. It can stay there for an extended period, and you'll just suffer losses. It's better to trade with the trend. To do so, focus on signals positively correlated with the current market conditions. For instance, if there's an uptrend, wait until the indicator forms a buy signal. If you're trading with a downtrend, wait for a sell signal.
If this sounds complicated, we created a video for you that will explain stochastic signals in a nutshell. Watch the video and keep it as a tip that you can find fast.
Stochastic Divergence
Divergence is an additional option to catch stochastic signals. Put simply, divergence is the difference between the direction of the price chart and the indicator. Look at the picture below.
Divergence is an effective method that helps determine price reversals. It's easily defined using the stochastic oscillator.
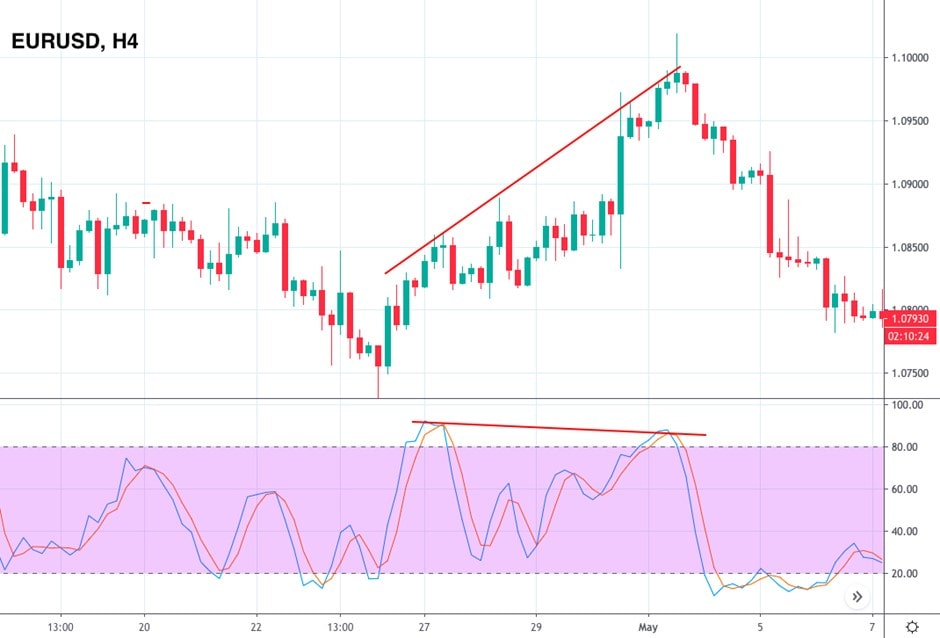
- If the price falls and forms a lower low, while the stochastic oscillator moves up and forms a higher low at the same time, this is called a bullish divergence. It means that the market will soon turn upward.
- If the price moves up and forms a higher high, while the indicator falls and has a lower high, we have a bearish divergence, which means the market will soon decline.
Benefits and Limitations
In addition to knowing how to use technical indicators, you also need to know their disadvantages. By knowing their limitations, you can use the index more efficiently.
|
Pros |
Cons |
|
Ease. The stochastic oscillator is an easy-to-use indicator. First, it's a standard indicator of any trading platform. Second, it doesn't require specific settings; you can use the default ones. |
Confirmation. Like any other indicator, the stochastic oscillator needs proof of other indicators. There is a risk the index will be in oversold or overbought territory for an extended period, and the market won't reverse as you expect. |
|
Clarity. The indicator provides signals often, and even a beginner can read them. |
Effectiveness. Although the indicator is useful, it may provide the wrong signals during strong trends. It works better during periods of consolidation. |
|
Effectiveness. The stochastic oscillator provides all the signals a trader needs for profitable trading. You can determine the direction of the trend and enter and exit the market at perfect points. |
Stochastic Oscillator and RSI: Are They Different?
These indicators look similar and give the same signals. But why do we have two instruments when we could just use one?
|
Similarities |
Differences |
|
Divergence. You can find divergence using either of the indicators. |
Crucial points. The stochastic oscillator has the points 20 and 80 that determine oversold and overbought conditions, respectively. As for the RSI, these levels are 30 and 70. |
|
Oscillators. Both technical tools are oscillators used to gauge market momentum. They are range-bound and move from 0 to 100. |
Implementation. The stochastic oscillator works better when the market is consolidating, while the RSI is preferable during trends. |
|
Signals. Both indicators provide buy and sell signals based on the index's location in the overbought and oversold areas. |
Lines. The stochastic oscillator has two lines, while the RSI is represented by only one. |
|
Accuracy. It seems that the point above is not essential. Does it matter whether there are one or two or lines? In this case, it does. The stochastic oscillator provides more accurate signals because it has two lines, one of which is the moving average that filters signals. The RSI, on the other hand, has only one line that doesn't provide 100% precise signals. |
|
|
Aim. The stochastic oscillator was invented to determine the price movement in consecutive ranges. The RSI gauges the speed of price moves. |
Let's Read the Chart
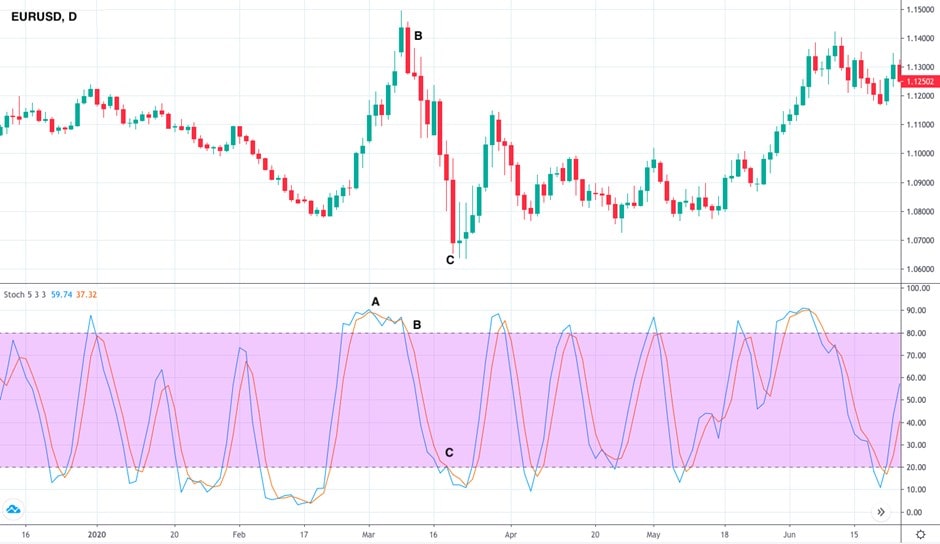
Everything sounds clear, but when traders start their paths, it can be complicated to understand how to read the price chart. Let's take a look at the example below.
You can see that the indicator was in the overbought area. The signal to sell appeared when the %K line (blue) crossed the %D (orange) from the top downwards. However, we see that the crossover happened several times. Here, we add an additional tip that will limit false signals. When the fast %K line crosses the %D line, wait until both lines break one of the crucial levels. We open a sell trade at point B, not point A.
Great! Now that we've opened a sell position, it's time to determine the take-profit level. Again, the stochastic oscillator can help us do this. Wait until the lines touch the opposite crucial point. In our case, we close the position at point C.
Use the Stochastic Oscillators: A Step-by-Step Guide
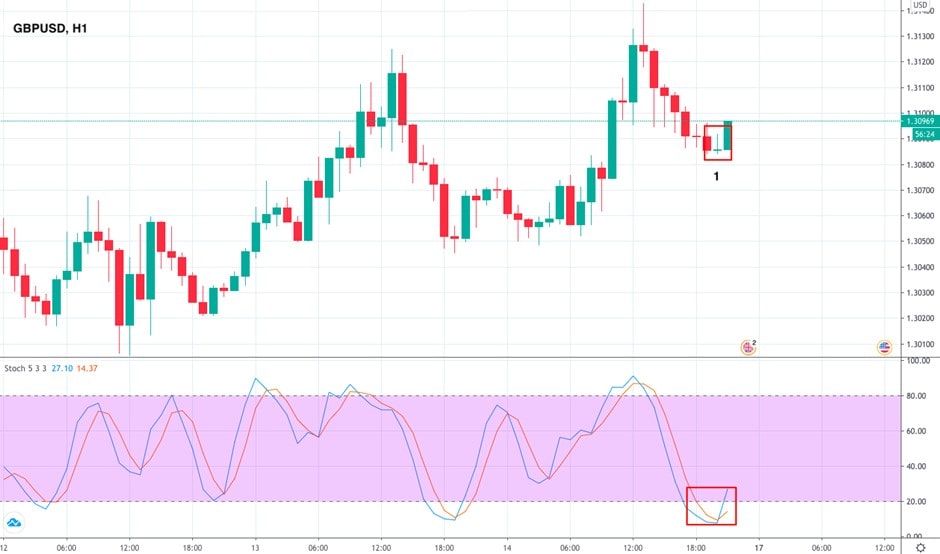
Let's consider how we can apply the stochastic oscillator to the price chart step-by-step. We will be looking at the GBP/USD pair and H1 chart.
Choose the indicator on the platform where you trade. Place 5, 3 and 3 as the %K, %D and Slowing settings, respectively. Now, look at the chart. In our example, we see that the %K line (blue) crossed the %D line (orange) upwards in the oversold area. However, we need additional confirmation. We can get confirmation of the upward movement from the Inverted Hammer candle (1). However, we see that the indicator hasn't crossed the 20 level. We should wait until it does it before opening a buy position.
Stochastic Oscillator: Choose Your Strategy
We'll consider a trading strategy you can use if you haven't created your own yet. Still, it's worth thinking about your strategy, as it's always better to pick up the conditions that will work for you. If you're a day trader, this strategy will be useful.
Choose the security you want to trade. In our example, we'll be looking at the EUR/USD pair. You'll need to switch between the 15-minute and daily charts. Set 3 for the %D line, 5 for the %K line and 3 for slowing (the period length).
- Step 1. We should start with the daily chart. It's an example of the buy signal. We need to find a point where the indicator lands in the oversold area (below 20). At the same time, the %K line should have crossed the %D line.
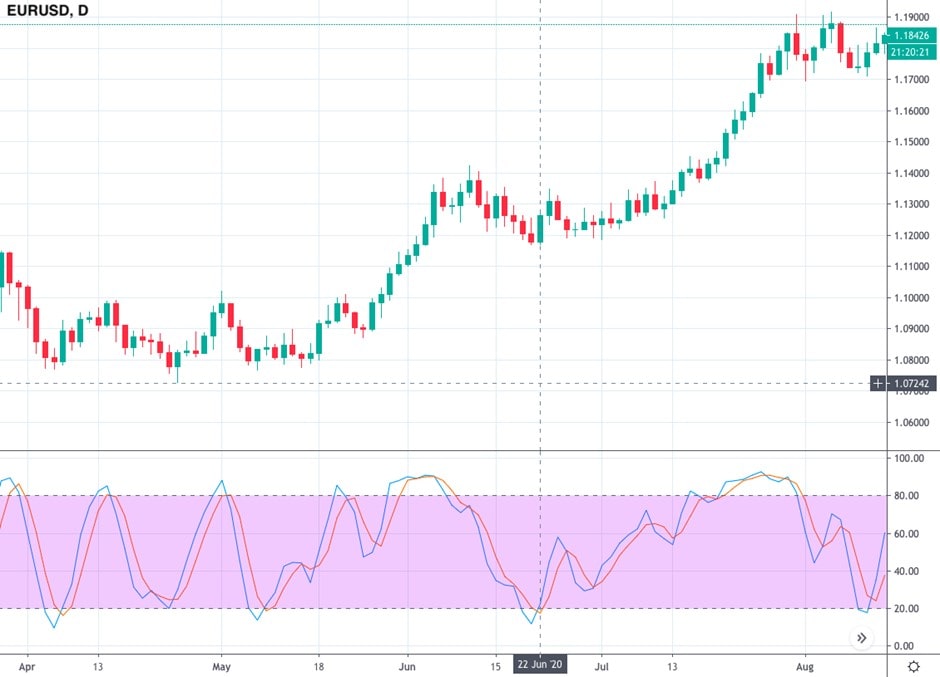
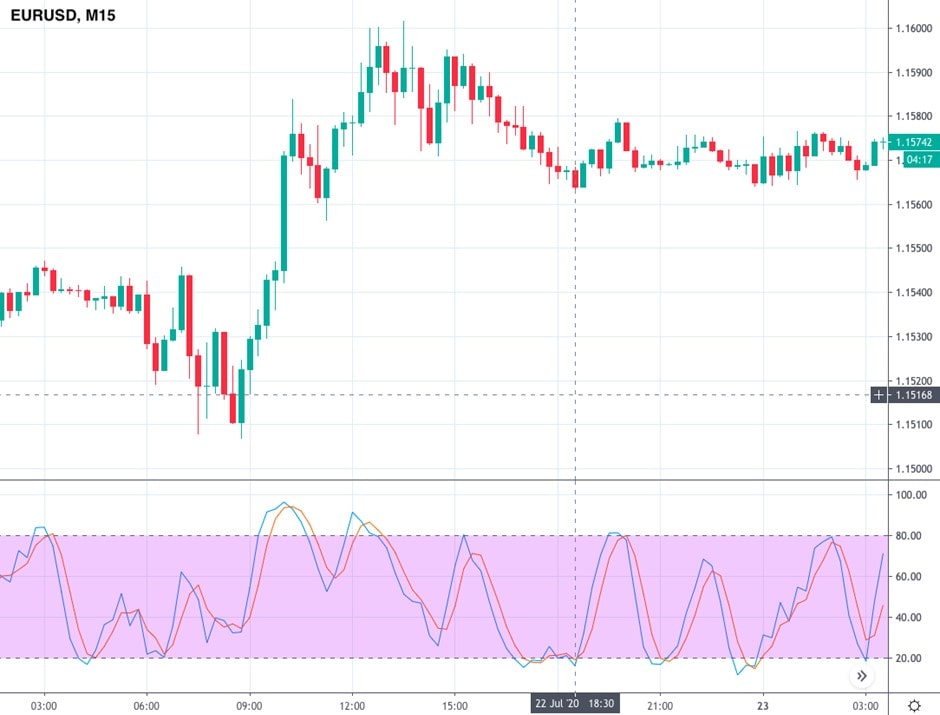
We start with the daily chart because it's crucial to consider the significant trend. We mentioned this rule above. We'll trade in the direction of this trend. - Step 2. Go back to the 15-minute chart. Here, we need to wait until the lines break below 20. Again, the %K line should break above the %D line from the bottom up.
- Step 3. We need confirmation that will ensure we can enter the market. We'll look for a swing low pattern, which consists of three candlesticks. The second candle should have a lower low, while the third one should have a higher low.
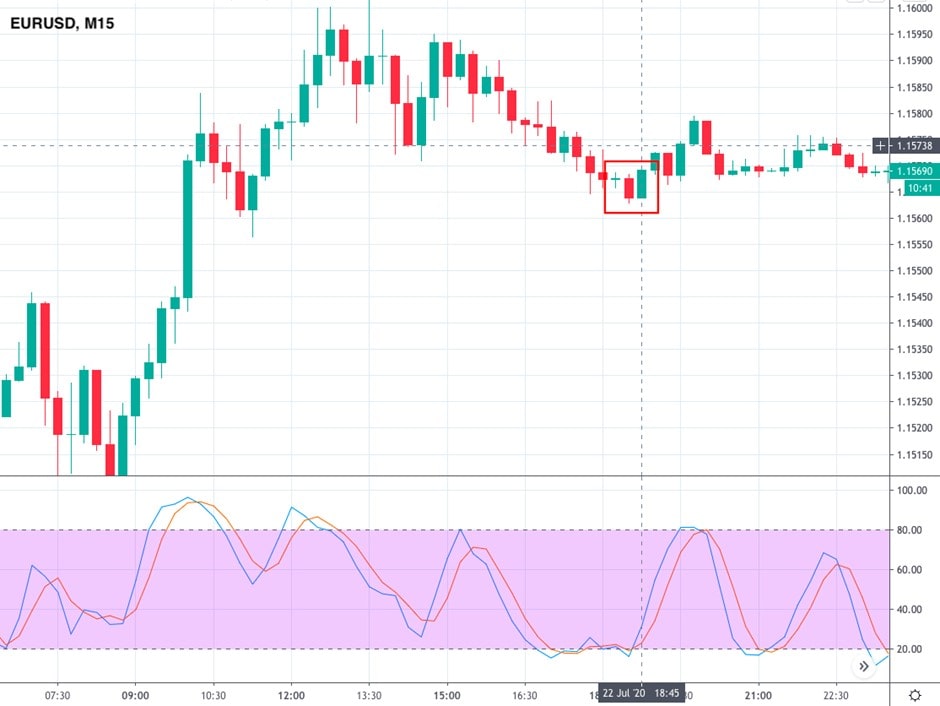
- Step 4. Are we ready to enter the market? Yes. We should open a trade as soon as the following candlestick breaks above the highest point of the swing pattern.
- Step 5. We need to place a stop-loss order. The stop-loss level should be located below the swing low pattern. You can set it five pips below the previous low to avoid a false breakout. In our case, it's 1.15585.
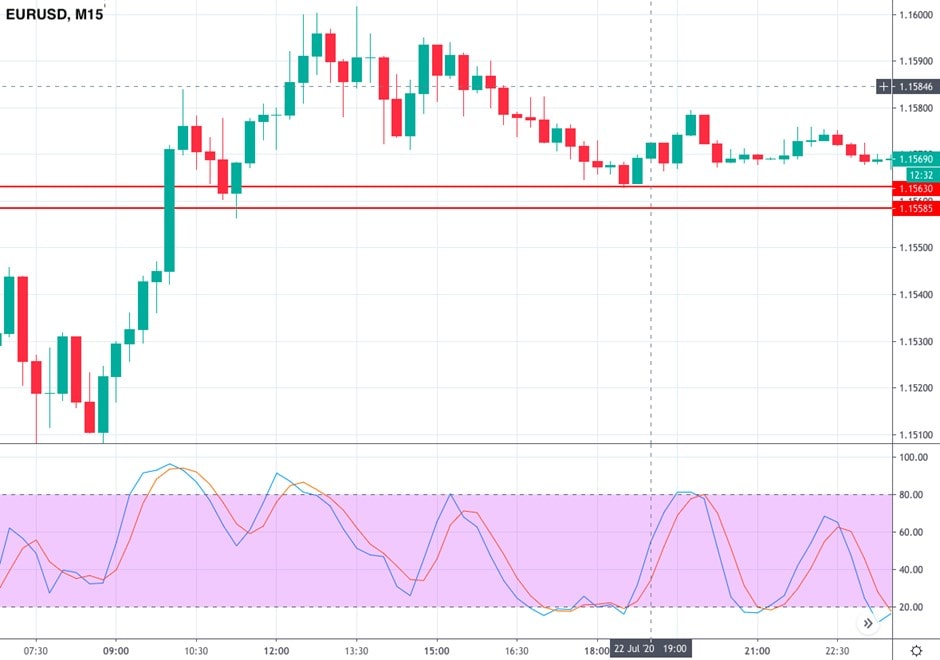
- Step 6. The most interesting point for any trader is to count profit. In this strategy, we can determine the profit on the stop-loss level. As the major rule is ½ ratio, you can simply double the distance between the entry point and the stop-loss order. In our case, that's 1.1579.
You can apply the same strategy for a sell position. You should use the same step but in the opposite way.
Tips for Stochastic Oscillator Users

Expert advice:Use the indicator for decision-making because it can confirm signals during sideways movements.
Expert advice: Divergence is the oscillator's most reliable signal. It's a divergence of peaks of the price chart and the oscillator. For instance, in an uptrend, the rising high of the price chart corresponds with the oscillator's falling peak.
Expert advice: Oscillator signals are not useful in strong and prolonged trends because they're mostly used for decision-making during times of uncertainty.
We're coming to the end of our tutorial and would like to help you avoid the most common mistakes many traders make when applying the stochastic oscillator.
- No confirmation. The first thing many traders forget is confirmation. Although it seems the stochastic oscillator provides accurate signals, there are risks of false alarms. As such, traders should find confirmation from other indicators. We recommend combining the stochastic oscillator with the Alligator, Heiken Ashi and MACD indicators.
- Wrong settings. Some indicators work well in any timeframe with the same settings, but that's not the case for the stochastic oscillator. You need to choose the settings that work best for your timeframe. The most common settings are 14 and 3, 21 and 3 and 5 and 4.
- False signals. Some traders forget that the indicator's presence in either overbought or oversold territory doesn't 100% guarantee a trend reversal. The indicator may stay in the zone for a long time. That's why it's worth trading with the trend and waiting until the fast %K line crosses the slow %D line.
Conclusion
To conclude, the stochastic oscillator is one of the most popular technical tools. It's simple and set by default on any trading platform. Moreover, it determines crucial areas, such as overbought and oversold territory, which allows traders to enter and exit the market at perfect points.
However, the indicator works differently depending on the settings you choose. That's why it's essential to practice before entering the real market. A Libertex demo account allows newbies to gain the experience they need before placing an actual trade, while professional traders can develop strategies with a new indicator.
Read the answers to the most popular questions about the stochastic oscillator indicator.
FAQ
What Is the Best Setting for the Stochastic Oscillator?
There's no 'best' setting, but we recommend using 5 and 4, 14 and 3 or 5 and 3 for %K and %D, respectively.
What Are K and D in the Stochastic Oscillator?
These are the indicator's two lines that provide signals. %K is referred to as a fast line; %D line is a Simple Moving Average of the %K line.
How Do You Read the Stochastic Oscillator?
The stochastic oscillator is a range-bound indicator that measures market momentum. It identifies the periods when the market is overbought and oversold. As a result, it provides perfect entry and exit points.
Is the Stochastic Oscillator a Good Indicator?
Because the stochastic oscillator is widely around the world, it has proven its effectiveness. It was developed at the end of the 1950s and is still applied to different strategies.
Is RSI or the Stochastic Oscillator Better?
Looking at the RSI and stochastic oscillator indicators as an either/or choice is probably not the best idea. After all, traders very often use both. However, the stochastic oscillator's signals can be considered more reliable because the tool has two lines that help identify a more robust signal.
How Is the Stochastic Oscillator Calculated?
Because the indicator consists of two lines, you should calculate both lines separately. To calculate %K, subtract the lowest price of the previous 14 trading sessions from the current close price. After that, subtract the lowest price of the last 14 trading sessions from the highest price of the same period. Divide the first result by the second one. Then, multiply the last result by 100. To gauge the %D line, subtract the period simple moving average of %K from 3.
Disclaimer: The information in this article is not intended to be and does not constitute investment advice or any other form of advice or recommendation of any sort offered or endorsed by Libertex. Past performance does not guarantee future results.
Why trade with Libertex?
- Get access to a free demo account free of charge.
- Enjoy technical support from an operator 5 days a week, from 9 a.m. to 9 p.m. (Central European Standard Time).
- Use a multiplier of up to 1:30 (for retail clients).
- Operate on a platform for any device: Libertex and MetaTrader.