Relative Strength Index – Your Key to Strong Signals
Prepared by the Libertex team
Content reviewed internally in accordance with regulatory standards.
Traders and analysts are divided into two major groups. The first one prefers fundamental analysis; the second one is fond of technical indicators. However, there's the third group. They combine both fundamental and technical factors. Nevertheless, all of them should know the crucial points of each analysis type.
In this article, we'll talk about one of the most significant technical indicators, the RSI.
What Does RSI Stand For?
The Relative Strength Index was created by J. Welles Wilder. Before he became a technical analyst, he worked as a mechanical engineer. This fact helped him develop not only the RSI but other indicators, such as the Average Directional Index, Average True Range and Parabolic SAR.
As for the RSI, it's a price oscillator. But before we go into more detail, let us explain what the oscillator is. If you open a trading platform, for example, MetaTrader and choose the indicators tab, you'll see a list grouped by their functions or the name of the creator. So, you may see trend indicators, oscillators, volumes and Bill Williams.
Oscillators are technical indicators that vary over time between two main points (key levels) and determine market conditions. Thus, they show if the market is overbought or oversold.
It's time to get back to the RSI. We've mentioned the relative strength index is an oscillator that shows the price strength, counting the speed and magnitude of the recent price changes and depicting overbought and oversold market conditions.
If the concept is still tricky, let's move on to examples.
How RSI Works and How to Read It
As we said earlier, there are different types of indicators. They differ in functions, names, and placement. For example, take a look at the chart below. Trend indicators are applied on the chart, while oscillators are located in a window below the chart.
Same with the relative strength index. It's placed in a window below the price chart. As you can see, there's a line, the index, and two levels, 30 and 70. The indicator shows the market sentiment.
RSI Indicator: Buy and Sell Signals
The first and primary RSI function is to determine the market condition. You'll need to look at the indicator. The 30 level is a border of the oversold area. A break below this level signals sellers (or bears) prevail in the market. This situation means the asset is oversold, and traders can expect a market reversal.
Remember one crucial aspect of trading: the asset's rise or fall can't last forever, a reversal will take place soon. However, the indicator will give you a signal only if it crosses the 30-level bottom-up. It'll mean the reversal is taking place. Nevertheless, don't blindly believe one indicator. Get a confirmation from a candlestick or another indicator, for example, MACD. As soon as you get more proof, you can go long.
The 70 level is the second crucial indicator level. It's a vital point in the overbought area. If the indicator enters the area above the 70 level, it means there are too many buyers (or bulls) in the market, and the asset is overbought. Thus, traders can expect a reversal down. Again, the signal appears only if the index crosses the 70 line from top to bottom. Remember the confirmation. If you get it, open a short or sell position.
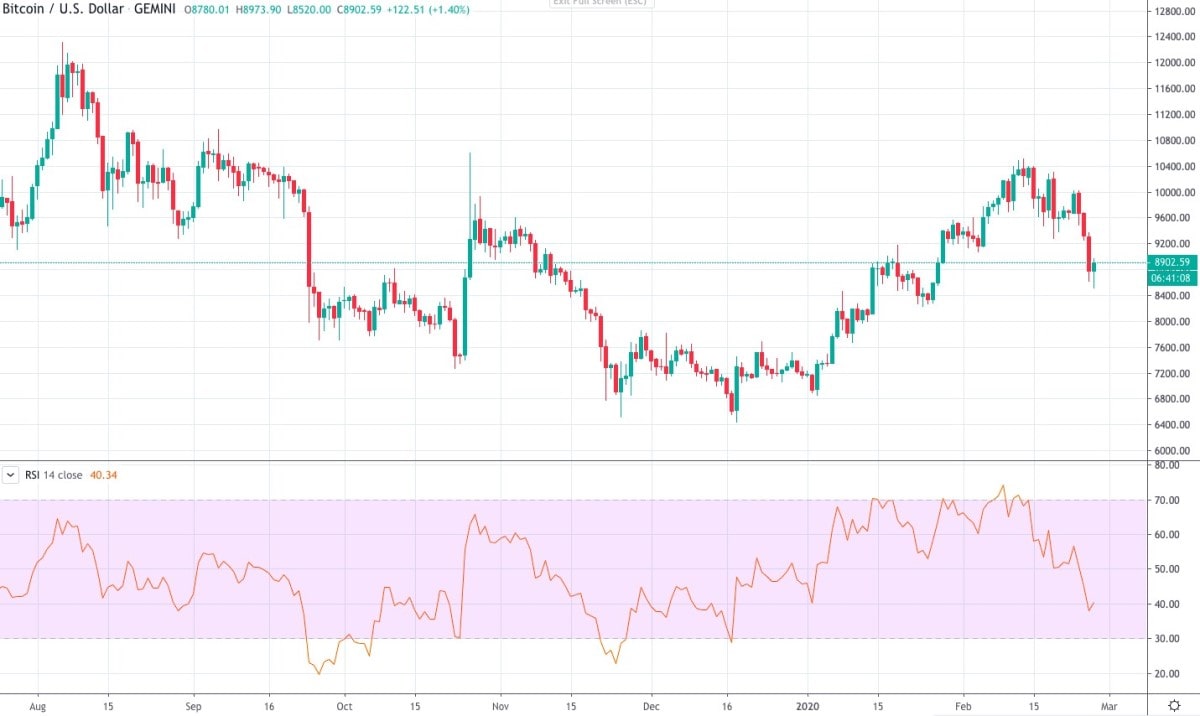
Note: although the indicator signals when the market is oversold or overbought, you should look at the situation as a whole. In times of a strong trend, the indicator can stay in the oversold/overbought area for a long time. If you notice a strong downtrend, don't wait until the RSI crosses the 30 level from bottom to top. Sell until the indicator is in the oversold areas. The same rule applies to the overbought zone. Buy within the strong uptrend. We can find a good example in the crypto market.
On the daily BTC/USD chart, you can see that the RSI indicator was in the overbought area several times. However, the direction of the pair didn't change due to the strong uptrend. Moreover, if the indicator doesn't go far in overbought or oversold territory, it's more likely that the trend will continue.
Bullish and Bearish Divergence
Divergence is the second indicator's function. Divergence gives a stronger reversal signal than the 30/70 levels. All you need to do is find a difference between the direction of the price chart and the indicator. When a new high of a price isn't followed by a new top of the relative strength index, it's called a bearish divergence. You get a signal to sell. That means the price will move down soon. If the price forms a lower low while the index has a low that is higher than the previous one, it's a bullish divergence or a signal to buy.
Bitcoin RSI Chart
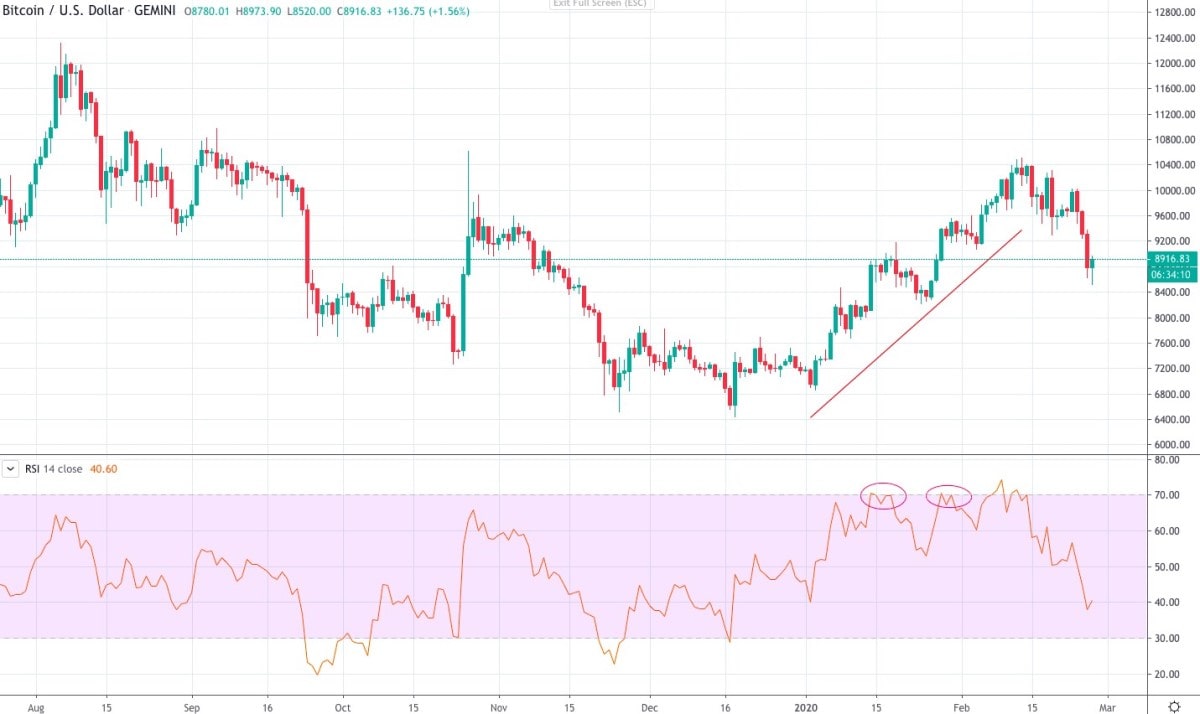
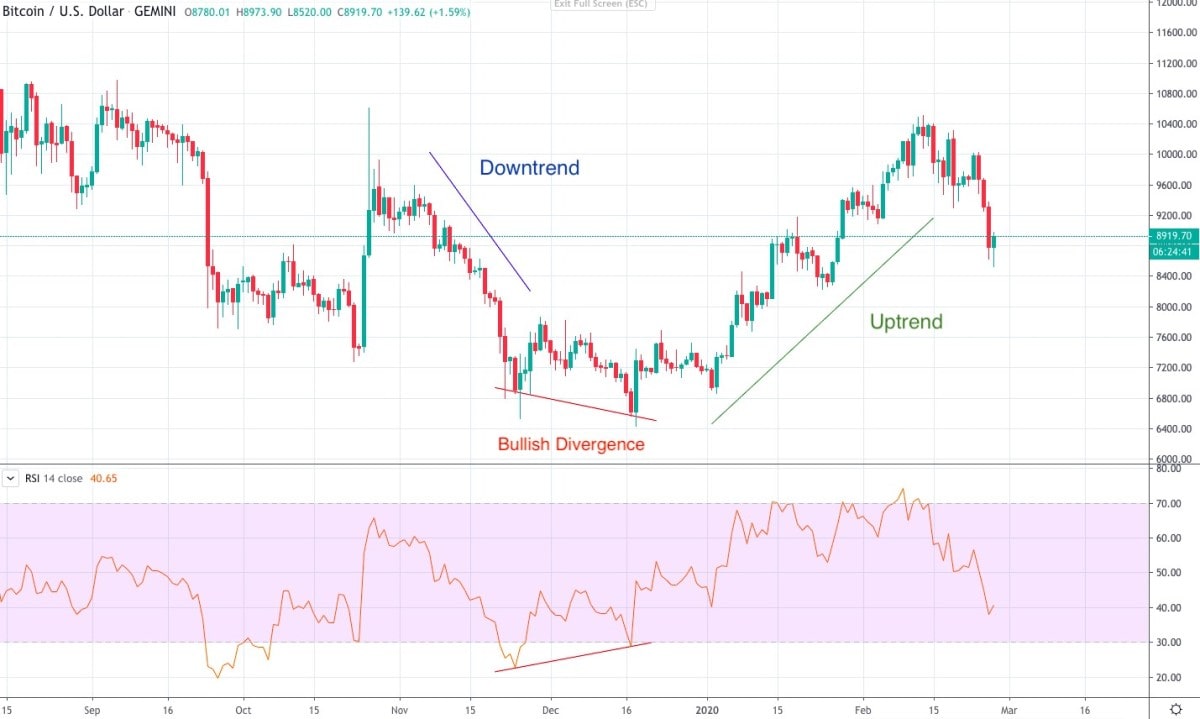
On the daily BTC/USD chart, we noticed a bullish divergence when the price formed a lower low, while the low of the RSI was higher. It was a signal of the trend reversal. Before the divergence, the price slowed down, forming a downtrend. After the divergence, we see a consolidation followed by the trend's change.
How to Calculate the RSI Indicator
It's unlikely you'll need to calculate the indicator. It's implemented in MetaTrader (later, we'll explain how). However, if you still want to measure the index, we're ready to present the formula.
The calculation consists of two parts. The first one reflects the initial Relative Strength value. It presents the ratio of the average UP closes to the average Down closes within the chosen period (N period).
| RSI = 100 - (100 / 1 + RS) |
Let's take the standard period setting of 14.
- *RS or Relative Strength is Average Gain divided by Average Loss.
- Average Gain = Sum of Gains over the past 14 periods / 14.
- Average Loss = Sum of Losses over the past 14 periods / 14
Losses are counted as positive values.
The second step smooths the result:
| RSI = 100 – (100 / (1 + [previous Average Gain x 13 + current Gain] / [previous Average Loss x 13 + Current Loss]) |
How to Implement the RSI Indicator
Now you've learned the basics about this indicator, and you might already want to apply it to your trading. Here, we'll tell you step-by-step instructions on how to do that. Although it's quite simple and will not take too many steps.
- Go to MetaTrader. Click 'Insert' on the upper panel, choose Indicators. You'll see a list of the indicators we talked about before. You need oscillators. Click the tab and pick up the RSI. Now, you need to set up.
- A period is a number of the previous bars the indicator counts. 14 is a standard setting. You can set any period and check the strength of a signal.
- The second setting is the price. It can be close, open, high, low, etc. In this case, the standard close price setting works the same as other settings.
- Other things you can do are just changing the colour, the line format, and placing additional levels. 30 and 70 levels are basic. However, later you'll see that some strategies require additional levels.
Relative Strength Index: Strengths and Weaknesses
The relative strength index is one of the most accurate indicators. And still, it has pros and cons.
|
Benefits |
Drawbacks |
|
Straightforward function. Despite the disadvantages, the RSI indicator is very beginner-friendly. It's a standard indicator in MetaTrader. Thus, you don't need to download or buy it. Additionally, it provides clear signals. There are only two areas (above 70 and below 30) and one line that moves within them. |
Short-term signal. Regardless of the indicator period and asset timeframe you choose, the indicator's signal will take place for a short period. Moreover, the indicator can be in the oversold/overbought area for a long time while sharp trends. Thus, if you wait for the strong trend reversal, the RSI isn't the best indicator to help you. |
|
More accurate than others. No indicator will give a 100% correct signal to open a position. All indicators suffer a time lag just because they count the previous price movements. Nevertheless, there are indicators with more and less accurate signals. So, the Relative Strength Index is the one that gives strong signals. |
Period mistakes. 14 is the default period. Nevertheless, it's not the best setting for all timeframes. If you trade on short timeframes, this period will miss many signals. While trading on a long timeframe, you may come across fake signals. Thus, finding the perfect period for your timeframe isn't easy. Remember that a bigger period smooths the price fluctuations but gives fewer signals, while a smaller period gives more signals, but they can be fake. We recommend using the standard 25 period for long timeframes and 9 period for short timeframes. |
Bonus. Useful Strategy for the Relative Strength Index
To avoid making unsubstantiated statements, we present a strategy you can use for trading with the RSI indicator.
Entry:
- Currency pair: any
- Timeframe: H4
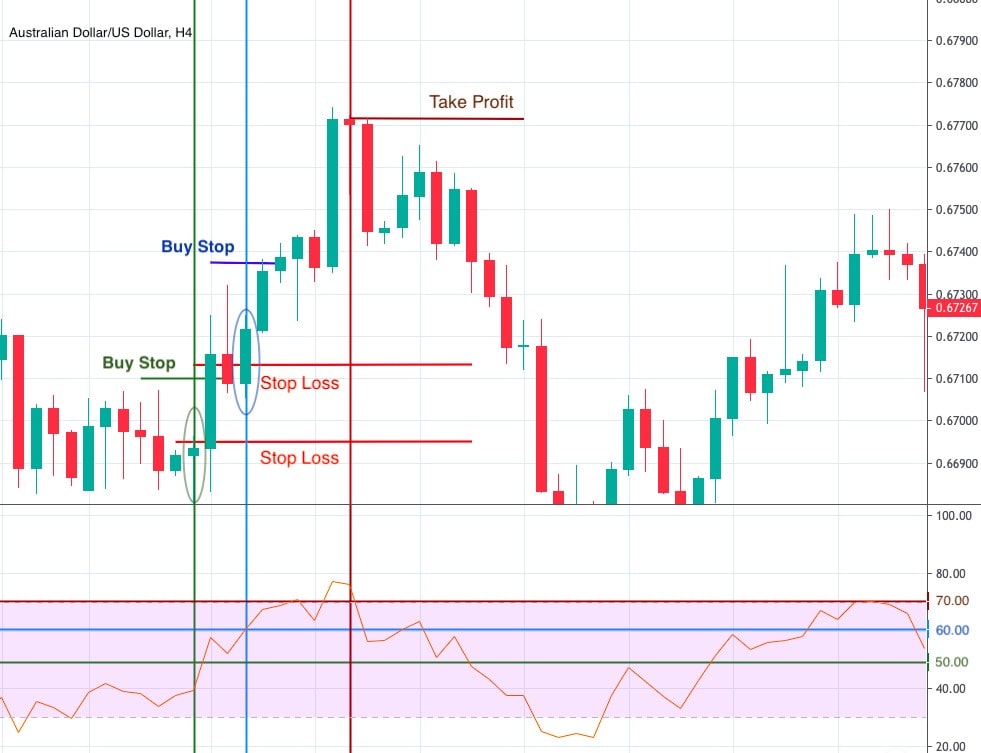
- RSI: Period 8, apply to “Close”, levels: 30, 40, 50, 60, 70
Buy Signal
- Notice that we added more levels than usual. You can do that in indicator settings. When the RSI crosses the 50-level bottom-up, place a Buy Stop pending order 15 pips above the candlestick where the cross happened. Locate Stop Loss 5-10 pips below the local minimum.
- When the RSI overcomes the 60 level, place the second order. The Stop Loss should be placed 5-10 pips below the local minimum.
- The signal to close the position will appear as soon as RSI falls below the 70 level.
Sell Signal
- When the RSI breaks the 60 level from top to bottom, place a Sell Stop pending order 15 pips below the candlestick where the cross happened. The Stop Loss should be 5-10 pips above the local high.
- When the indicator breaks below the 50 level, place another pending order below the candlestick of the cross. Remember about the Stop Loss. It'll be above the local high as well.
- When the index breaks above the 30 level, close the position with your profit.
Combine the RSI Indicator with Others
Do you remember we recommended comparing signals from at least two indicators or an indicator and a candlestick? It's a crucial rule that will help traders become more successful.
Market Conditions
The Relative Strength Index is similar to the Stochastic Oscillator. That's why you can use both to get a stronger signal. Another indicator that can help you is the MACD indicator. It differs from the RSI, so the signal could be even stronger.
Find a Trend
The RSI is used to determine a trend reversal. That's why trend indicators will be the right addition to that. Combine signals of Moving Averages or Ichimoku Kinko Hyo with RSI.
Conclusion
Now, you're ready to use this new knowledge in practice. However, don't rush. You could become confused by the many levels and functions of the indicator we explained above. Take your time to learn how the indicator works; choose the best period setting for your strategy. We would recommend applying several RSI indicators on the chart with different settings and then seeing which signals work better. Use a Libertex demo account to practise this technique.
Here, we gathered the most frequent questions you may also have.
FAQ: What We Haven't Said About the RSI Indicator
What Is the Best RSI Setting?
The only setting you should change is the period of the index. 14 period is a standard setting. However, it's not the best one. Forex traders mostly use the 9 period for smaller timeframes and the 25 period for bigger timeframes.
What Is the Best RSI Setting for Day Trading?
When trading within a day, you use small timeframes from one minute to four hours. That means the indicator should have a period not bigger than 14. 8 or 9 are the most commonly used periods. However, you are free to reduce the period to your liking. Just remember that small periods increase the risks of fake signals.
What Is an RSI Buy Signal?
If you want to buy, wait until the index crosses the 30-level bottom-up. However, don't buy at the break of the 30 level in the strong trend. Another buy signal may appear when the downtrend turns around. Wait for the bullish divergence (higher low of the RSI and a lower low of the price).
Disclaimer: The information in this article is not intended to be and does not constitute investment advice or any other form of advice or recommendation of any sort offered or endorsed by Libertex. Past performance does not guarantee future results.
Why trade with Libertex?
- Get access to a free demo account free of charge.
- Enjoy technical support from an operator 5 days a week, from 9 a.m. to 9 p.m. (Central European Standard Time).
- Use a multiplier of up to 1:30 (for retail clients).
- Operate on a platform for any device: Libertex and MetaTrader.