
Everything You Need to Know About Trend Analysis
Prepared by the Libertex team
Content reviewed internally in accordance with regulatory standards.
Trend analysis uses past data to assist you in analysing and predicting future events. This helps traders recognise the potential effect the past could have on a future event, which is a key aspect required for successful trading. But what is the mechanism behind it? This article will provide a comprehensive discussion and guide on stock trend analysis, how it works, the tools used, real-life examples, predictions, practical tips and strategies.
To begin with, what exactly is trend analysis?
What Is Trend Analysis, and Why Is It Important?
Trend analysis is a technical analysis technique that refers to gathering data from different time periods and plotting the information on a horizontal line to find actionable patterns and trends. There are three main horizons: short-, intermediate- and long-term trends.
Trend analysis assists traders in making suitable comparisons between the past and the future and makes market sentiment predictions based on this information. So, moving in and not against the direction of the trend will bring you profit.
Next, we'll look at the working mechanism behind trend analysis and the different strategies you can apply.
What Is the Mechanism Behind Trend Analysis?
Trend analysis works by trying to make trend predictions. Once it does, it continues to move with the trend until the time period data indicates a reversal. For instance, if the trend predicted is a bull market, then traders should follow it. Traders should also follow suit once the data analysis changes the trend's prediction to a bull-to-bear market.
Trends can be up or down, depending on whether the market is bullish or bearish. Also, note that a long-term trend offers better reliability.
What Is a Stock Market Trend?
Have you ever noticed the zig-zag up and down lines on the price chart of a stock? And that all seem to be driven by a certain market trend?
In simple words, a trend in the stock market refers to a stock's upward and downward movements during a particular time. But when we speak about trend analysis, we don't mean movements; instead, we dive into the details, such as how much the stock climbed in a bull market and how little it decreased in a bear market.
To do this, we first need to understand what the different types of stock market trends are:
- Uptrend: An uptrend is identifiable by the overall upward movements of peaks (tops) and troughs (downs) compared to previous ones.
- Downtrend: A downtrend is identified by its pattern of constant falling. The pattern has lower peaks and troughs over time.
- Horizontal/Sideways Trend: This trend type is recognised by its stability over time, representing horizontal price movement.
You can read more on market trends here.
What Are the Tools for Trend Analysis?
Let's have a look at the top tools you can use for trend analysis.
Chart Patterns and Trendlines
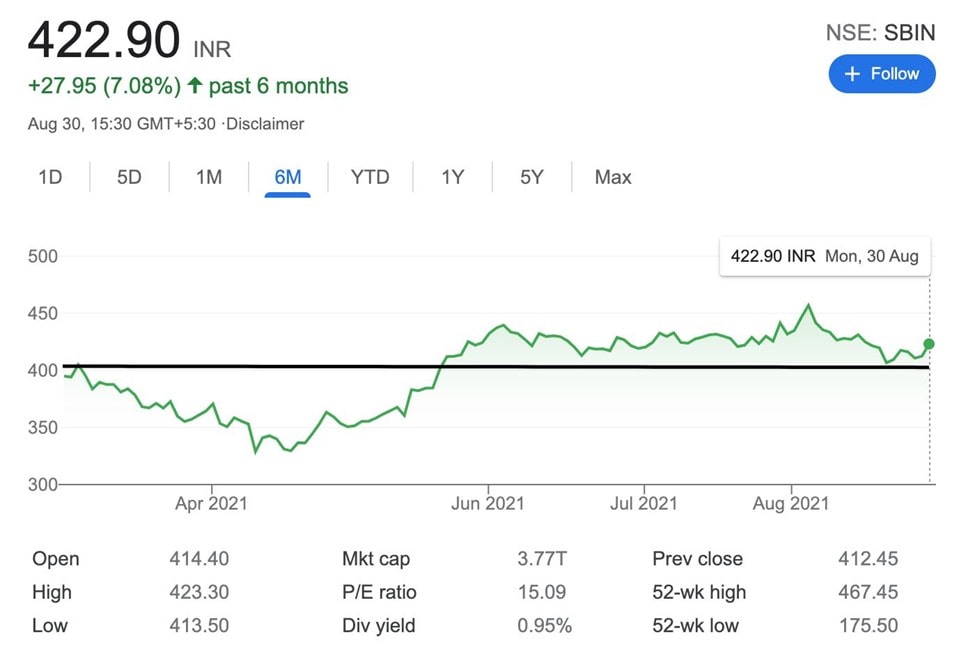
While studying chart patterns, traders can find help in trendlines to recognise the support and resistance levels on the price chart.
- A support level may occur when the demand concentration leads to pausing the downtrend.
- A resistance level may occur when the supply can cause the downtrend to pause.
The image below of the State Bank of India (SBIN) shows a support level that stops the price from falling.
Momentum Indicators
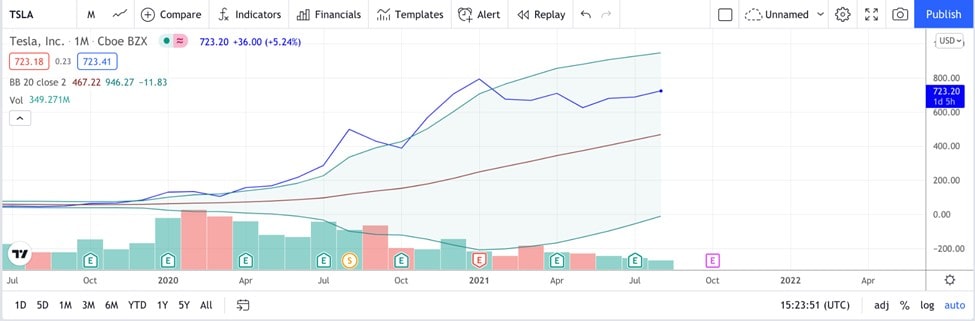
Long positions can be entered by traders when there's strong up or down momentum in a stock. Once momentum is lost, the long positions can be closed.
In the image below, a monthly chart for Tesla Motors, we see an uptrend (on the right) as the momentum increases.
Moving Averages
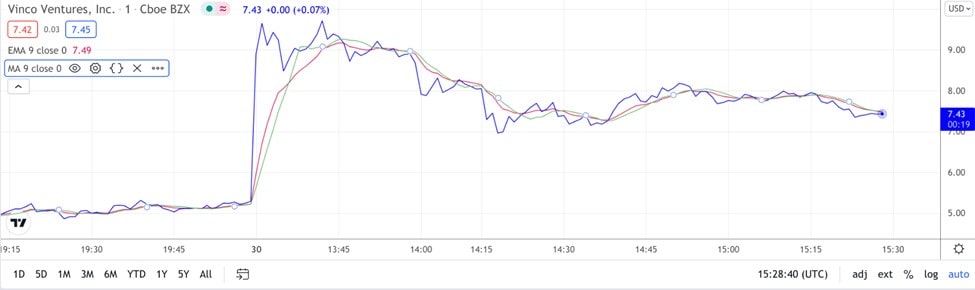
Moving averages measure the average change on a price chart over time. The purpose of generating a stock's moving average is to smooth out price data over a set period of time. This is done by establishing an average price that's continually updated.
The image below is of a daily chart of Vinco Ventures. The coloured lines represent moving averages, where the red line represents the Exponential Moving Average (EMA), and the green line stands for the Moving Average (MA), as indicated in the upper left corner.
VWAP
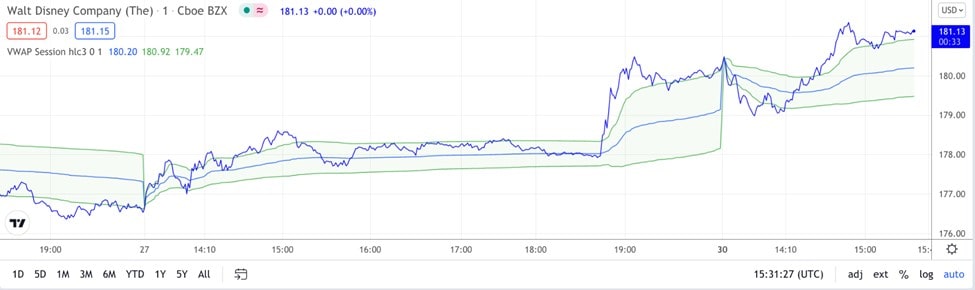
The Volume Weighted Average Price indicator provides the price average of a stock based on the volume. Intraday trends are determined using this indicator.
The image below is of a one-day period of Disney stock on a one-minute chart. The green-coloured lines represent the VWAP indicator, as written in the upper-left corner.
How to Predict Stock Market Trends in 2021
Stock market trend prediction methods fall into two main categories: technical and fundamental analysis.
Technical Analysis
Technical analysis includes analysing historical data to predict future prices. It's based on the premise that the market price represents all relevant information influencing a market.
There are mainly two tools of technical analyses: chart patterns and technical indicators. Within these types, numerous techniques can be applied to predict stock market trends.
Chart Patterns
Below, we discuss the main chart patterns used by traders for stock trend analysis.
Head and Shoulders: In the head and shoulders chart pattern, two shoulders (smaller peaks) and a head (higher peak) are formed. Another component is the neckline, which lies below the head and the two shoulders. When the pattern is inverted, it's called an Inverse Head and Shoulders Pattern. This method is used for predicting a bull-to-bear reversal.
The steps for this type of stock trend analysis are:
- Wait for the pattern to form and the neckline to be crossed.
- Measure the distance between the top of the highest peak (the head) to the neckline.
- In the opposite vertical direction, subtract the distance measured.
For instance, the first measured distance is $15. If a bull-to-bear reversal occurs, the price may decline by $15.
Double Top: Using the double top chart pattern, traders can predict the reversal of an existing trend in the short or long term. It contains two peaks of similar highs and one valley or neckline in between, i.e., the minimum price. The pattern is common around a bull market's end.
The steps for predicting this pattern are:
- At the beginning, wait until the pattern reaches the first peak. This indicates that demand is crossing over the supply.
- The trend begins to reverse, and supply overtakes demand.
- Prices fall, and the neckline forms.
- The prices begin to rise, and a bearish trend forms.
- This will result in the second peak.
Cup and Handle: The cup and handle chart pattern shows a bearish trend followed by a bullish trend. It looks similar to a half-circle (the cup) and a handle.
The steps for predicting this pattern are:
- Place a stop buy order towards the upper trend line of the handle portion.
- Measure the distance between the cup's lowest point and the handle breakout level.
- This determines the profit target.
Indicators
Indicators are extra settings on the chart that give details using price and volume calculations. There are a few types of indicators:
- Trend Indicators: As the name suggests, trend indicators show how the market is moving. Common trend indicators include Moving Averages, Parabolic SAR, the Bottom Line and Moving Average Convergence Divergence (MACD). Below, we'll discuss predicting a trend using Moving Averages.
The MACD indicator gives the MACD line, which compares two EMAs (Exponential Moving Average): over a 12-day period and a 26-day period. MACD indicates whether the price is strengthening or weakening.
The formula for the indicator is:
MACD = 12-Day EMA – 26-Day EMA
- Momentum Indicators: These indicators suggest the trend's strength and pick price tops and bottoms. The examples include the Relative Strength Index, Ichimoku Kinko Hyo, Stochastic Oscillator, etc.
Here, we'll discuss the Stochastic Oscillator in a bit more detail. The indicator uses the previous closing price compared to the range for a specific timeframe to predict a reversal.
The formula is as follows:
%K = 100 * ((Recent Close – Lowest Low) / (Highest High – Lowest Low))
%D = 3-day SMA of %K
Fundamental Analysis
Fundamental analysis looks at the company whose stock we're trying to predict a trend for. It focuses on the financial aspects of the stock market. There are four key steps to follow for predicting stock market trends.
Step 1: Calculate Financial Ratios
Begin with shortlisting companies that are performing well in the market. Screen their stocks using financial ratios like Price-to-Book Value, Dividend Yield, Current Ratio, Price-to-Earnings Ratio, etc. You can include and exclude the financial ratios based on your criteria.
Step 2: Research the Company
This step involves understanding and researching your chosen companies. Doing so is vital because it indicates the company's health and working status, such as:
- Is the company's performance impressive or poor?
- Is it working and making effective decisions towards long-term goals?
- Are competitors performing better than it is?
- Should you hold or sell its stock?
Collect the companies' annual reports and go through them. You can also visit their official websites for information on vision and mission statements, directors, services, customer reviews, etc.
Step 3: Check the Company's Financials
In this step, you should thoroughly go through the companies' financial documents. These include balance sheets, income statements, cash flow statements and profit and loss statements.
Generally speaking, growing revenue/sales, net profit and margin during the past 3-5 years are considered a positive sign for the firm. Once you're done, examine other financials, such as operating costs, spending, assets, liabilities, etc.
Step 4: Analyse the Stock Price Trend
This is the last and determining step. Check the company's stock signals based on financial news. In general terms, you should focus on how the company's stock behaves after news is released.
Also, take note of the kind of news:
- Is it related to the company? Is it favourable for or critical of the company?
- Is it global financial news? Is it financially positive or negative?
- Are competitors mentioned? If so, in what regard?
Finally, conduct sentiment analysis using machine learning models to determine the stock's trends.
Stock Trend Analysis of Popular Stocks
Below, we'll show you how to do trend analysis for a few of the most popular stocks.
-
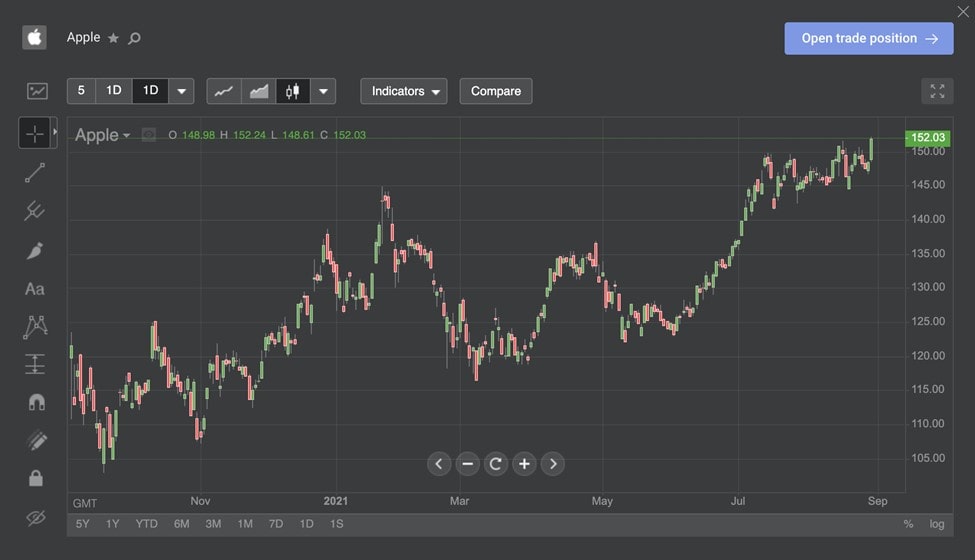
Apple Stock Price (NASDAQ: AAPL)
In October 2020, Apple released their iPhone 12 series and lost 2.7% on the same day as a response. By January 2021, AAPL had sunk again by 1.3% after launching iMacs and iPads. In early June, Apple showed its new personal data protection and saw an uptrend as a result. AAPL stock depends on the company's services and products. All eyes are on iPhone 13 now!
-
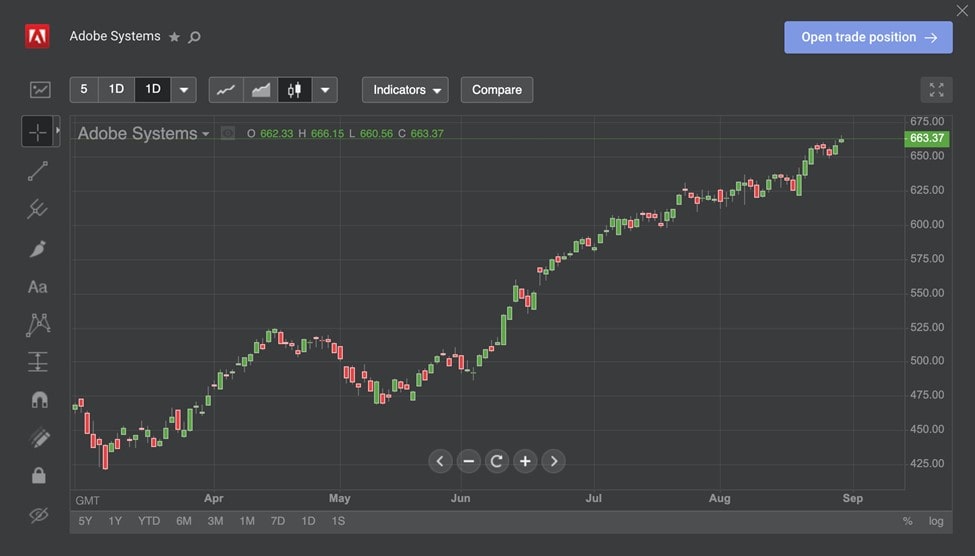
Adobe Systems Incorporated (NASDAQ: ADBE)
Adobe has performed consistently over the years. However, the constant uptrend seen in the image below was in response to Adobe announcing a partnership with Walmart in June 2021. The stock is looking at a continued uptrend with a strong user base and good 3D AR/VR digital products.
-
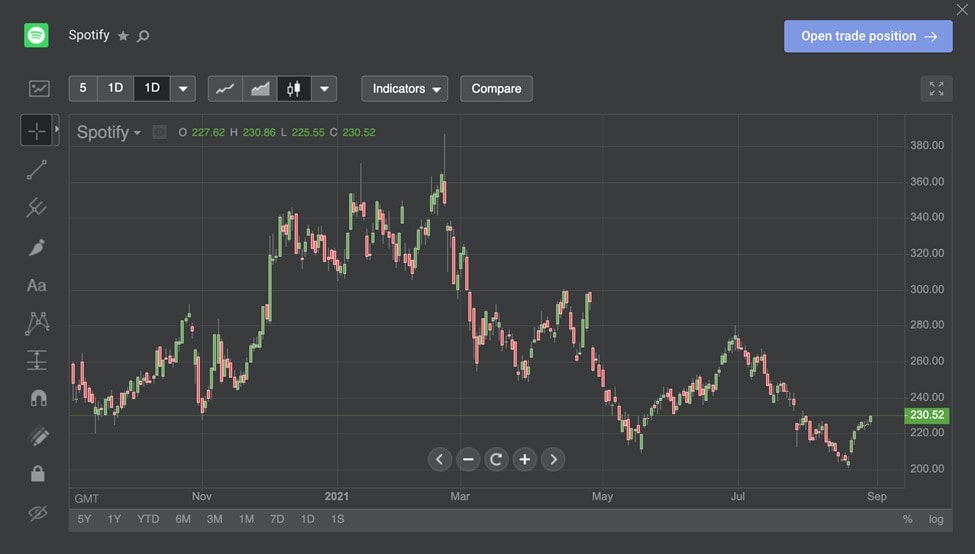
Spotify Technology SA (NYSE: SPOT)
This stock rose by 165% at the beginning of 2021, hitting a high of $387. After that, it declined by 40%, followed by a slight uptrend and then a bigger downtrend. The stock gained momentum again in August 2021 after Spotify's announcement that it would repurchase $1 billion of its shares.
What Mistakes to Avoid in Trend Analysis
Here are some common blunders you should avoid during trend analysis and how you can approach them.
Expecting Results Like the 'Example'
Don't expect winning results similar to an example you saw somewhere. Too often, books and periodicals focus only on an outstanding winner, ignoring other losing signs. The reality is that the stock market is extremely volatile, and there are both winning and losing trades. To avoid falling into the trap of trusting everything, backtest any theory before actually applying it.
Depending on a Single Indicator
Beginners can feel overwhelmed with all the activities, zig-zag patterns and lines on the screen. So, after using a single indicator, the smoothed-out screen may seem to solve their analysis. However, that's far from the case. All indicators apply mathematical calculations to the price. To avoid this mistake, use another indicator and then confirm the signals.
Using Excessive Indicators
While one indicator is insufficient in stock trend analysis, eight would be too many. A lot of inexperienced traders add an indication every time they lose on a trade, resulting in information overload. Make your charts as simple as possible. You should be able to present your strategies in such a way that anyone can comprehend them.
Expert-Level Tips to Use in Stock Trend Analysis
Concentrate on High-Potential Sectors
Capitalising on industry momentum is critical when you have a small account for stock trend analysis. High-potential markets are a challenging task for experienced traders. The hype-up sector leads to stocks in the hot sector rising well.
Hot sectors usually follow an uptrend. When the hot sectors are in an uptrend while others aren't, the uptrend may continue.
Focus on the Chart
Chart patterns and their movements are critical to stock trend analysis. Knowing how to read charts accurately can assist in risk management. For instance, knowing when to add support and resistance levels.
Notice the Volume
Volume represents the people participating in a particular stock and their sentiment about it. As such, more volume represents a strong, sustainable stock.
How to Read Trends
Apart from the tips, there are some expert strategies that you can apply to carry out an accurate stock trend analysis.
Review the Previous Trend
Read the chart patterns and price actions of the previous trends. Take note of days that have uptrends, downtrends, volume, etc. Notice any changes dependent on outside factors and what is the pattern of this behavioural change. Understanding the drivers of past trends will help in stock trend analysis.
Check the Current Trend
Focus on the current trend. Is it an uptrend? Has volume increased or decreased, and what factors may be attributable to this fluctuation? Once at least three indicators confirm the trend for both daily and intraday charts, you can proceed with it.
Check the Volume and Uptrend
Traders usually buy a high-volume stock entering an uptrend and sell it later if there's a reversal trend. However, buying a high-volume stock that has been green for many days may bring in losses.
Look Out for Reversals
In stock trend analysis, a bull-to-bear reversal trend indicates the uptrend's break-up and can include a weakening green day, a breaking trendline, etc.
Conclusion
By using stock trend analysis, traders determine whether stocks have a competitive advantage and are suitable for their methods. That said, technical trading isn't as straightforward as it appears. Since it'll be a learning curve, you'll make mistakes and have to learn from them. To learn and practice stock trend analysis without fear, open a Libertex demo account at no charge.
FAQ
What Is Trend Analysis?
Trend analysis tries to forecast future trends in the market by analysing historical data. It collects data from several periods, studies the past price action and trading volume to find trend patterns in the data.
How to Do Stock Trend Analysis
Stock trend analysis is carried out through two major techniques: technical and fundamental analysis. Technical analysis involves predicting the trend through charts and indicators. Fundamental analysis looks at the company whose stock we're trying to predict a trend for.
What Is the Best Stock Trend Indicator for Trend Analysis?
There's no best indicator for trend analysis because every indicator serves specific purposes. However, some indicators are more commonly used than others, such as Moving Averages, MACD, Stochastic Oscillator, etc.
Disclaimer: The information in this article is not intended to be and does not constitute investment advice or any other form of advice or recommendation of any sort offered or endorsed by Libertex. Past performance does not guarantee future results.
Why trade with Libertex?
- Get access to a free demo account free of charge.
- Enjoy technical support from an operator 5 days a week, from 9 a.m. to 9 p.m. (Central European Standard Time).
- Use a multiplier of up to 1:30 (for retail clients).
- Operate on a platform for any device: Libertex and MetaTrader.