
Market Trends: Make a Trend Your Friend
Prepared by the Libertex team
Content reviewed internally in accordance with regulatory standards.
If you've read any educational materials on trading, you've definitely heard about trends. Trends are a crucial part of forex trading and help traders enter and exit the market and build robust strategies. Since they're such essential elements of trading, we'll tell you how to use them.
What Is a Market Trend?
A trend is the direction that an asset's price follows for a certain period of time. You can find a trend for any security, including stocks, currencies and commodities. They exist on any timeframe and differ by length and direction. The direction is the most crucial point you should consider when trading.
Let's clarify what path a trend can follow.
Types of Market Trends

There are two classifications of trends: direction and period.
Direction and period are the main classifications of trends.
Trend Direction
There are only three types of trend directions, which are easily identified on the price chart:
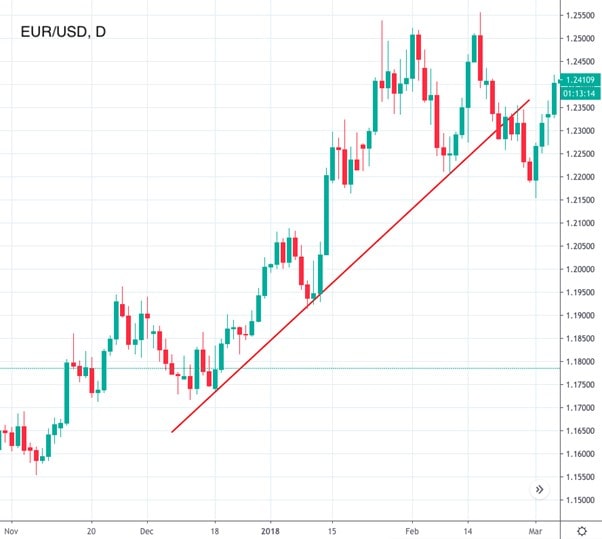
⇑ Uptrend or bullish trend. When you see the price moving up for an extended period, it's a bullish trend. In this direction, the price forms higher highs and higher lows. To confirm an upward trend, draw a support line that connects at least two minimums. If the price breaks below this level, it's a sign of the end of the trend.
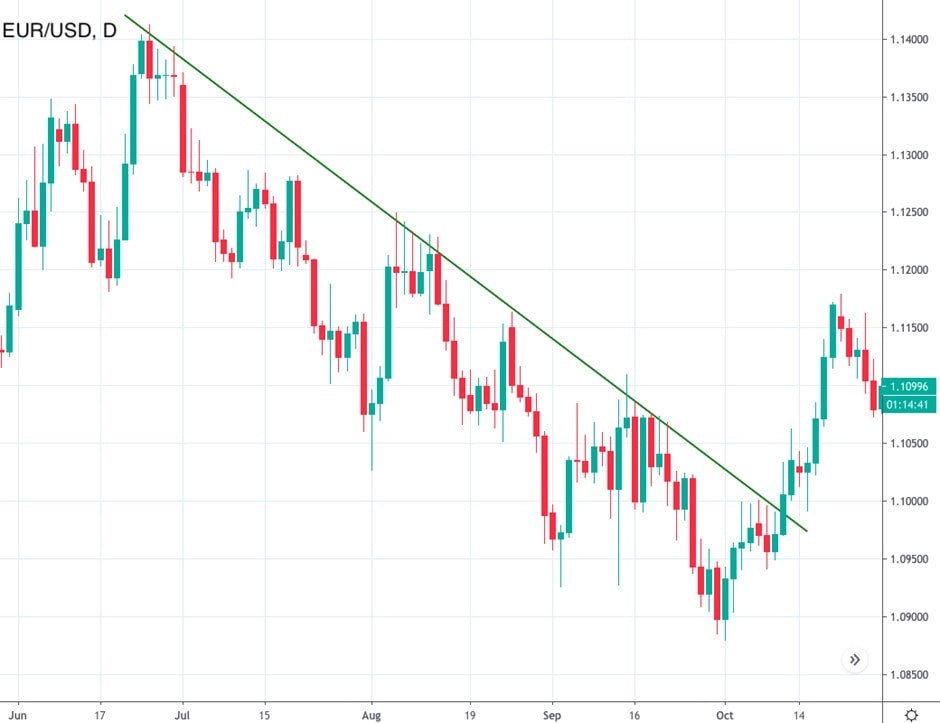
⇓ Downtrend or bearish trend. If the price moves down for a certain period, it's a bearish trend. This trend direction features lower highs and lower lows. To be sure it's a downtrend, draw a resistance line through at least two points. If the price breaks above it, it's a sign of the trend's weakness.
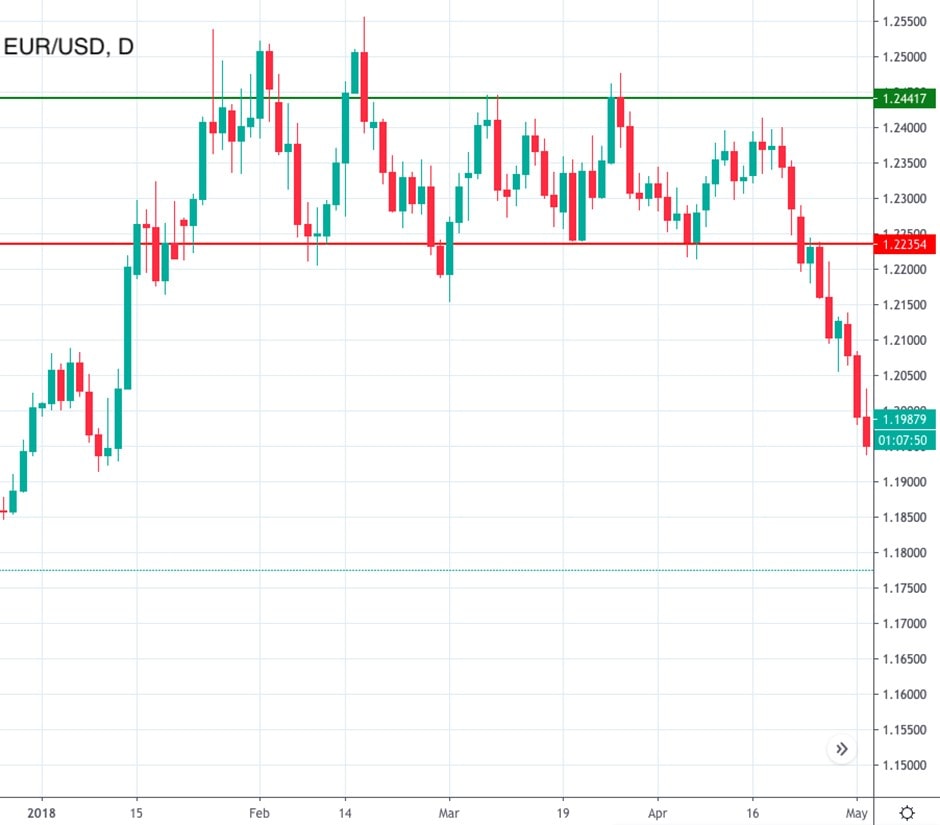
⇒A sideways trend, also known as flat or horizontal. During a sideways trend, the price consolidates, moving neither up nor down.
Trend Length
Another crucial point you should consider when trading based on the trend is its period, which also has three types:
- A long-term trend is a trend that lasts for at least six months. As you can understand, this type of trend appears on both weekly and monthly timeframes.
- A medium-term trend usually lasts from one week to several months. It's easily identified on daily and charts.
- A short-term trend exists for less than a week. To identify it, use H1 and minute timeframes.
Trends exist in any timeframe, but we wouldn't recommend identifying them on timeframes that are less than M15. Small timeframes are not used for trend trading.
Trendline
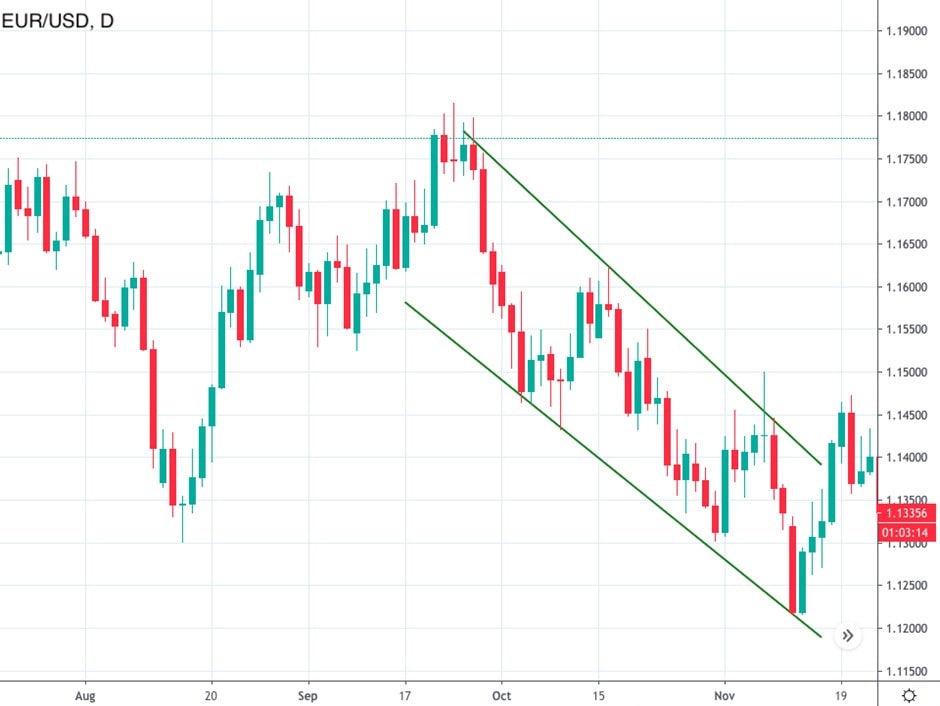
We have mentioned you should draw support and resistance lines through at least two points. But, perhaps more accurately, they're not called support and resistance lines, but rather trendlines. Trendlines go through at least two points and build a so-called channel, which makes the trend clearer.
A trendline serves as a support/resistance level as well as the upper and lower boundaries of the trend channel.
Although the trendline is drawn via two points, it's possible to prolong it and create an obstacle for future price movement. This obstacle will become either a support or a resistance for the price and an indicator of either the trend's continuation or its end.
See the image below.
You can draw many lines on one timeframe. However, we don't recommend doing this because it can easily become confusing. Instead, look for clear trends. If you find a robust trend that's easily visible, odds are that other traders will also see it, and your trade will be more successful.
Find the major trend for each timeframe.
The more often the trendline is touched by the price, the stronger the trend is supposed to be. A signal of a strong trend is the distance between the two points through which you draw the trendline. If there are 20-30 candlesticks between them, the trend is considered reliable.
What Affects Market Trends
Why do trends change their direction? The reason is that market sentiment changes frequently. The change in the market's mood depends on economic events and data. Bear in mind fundamental analysis when thinking about market sentiment.
Fundamental factors drive the market trend.
Every market has its own fundamental factors that will determine its direction. For instance, the direction of stocks will be determined by industry conditions and the company's earnings. If we're talking about the currency market, it's worth checking the economic calendar that includes all of the essential economic reports that affect the currency's strength.
If you know the current market conditions, you know what trend is supposed to prevail.
How to Identify Trends in the Market
Before you identify a trend, you should understand that each one consists of price movements within a particular direction as well as counter-trends and corrections. The trend lasts until the price moves in the opposite direction and starts forming a new trend.
- Draw trendlines. If you see that the price is moving in the same direction for a certain period, you can try to draw trendlines. If you see a channel, it's a trend.
- Use technical indicators. There are a vast number of technical indicators that determine the trend and its strength. The most effective indicators include Moving Average, ADX and Parabolic SAR.
- Reversal Chart Patterns. There are patterns that predict a market trend reversal and signal an upcoming trend. The most famous ones are Head and Shoulders, Inverse Head and Shoulders and Double Top/Bottom.
- Continuation chart patterns. At the same time, there are patterns that signal a continuation of the trend. You should look for patterns, such as triangles, flags, and wedges.
Trends and Patterns: Where the Difference Lies
The trend is a specific price direction that lasts for a certain period of time. Patterns are mostly used to identify either a trend or its reversal. They consist of precise price movements but don't show a particular price direction.
Trade Against the Trend
This isn't the safest trading method, especially for a newbie investor. Usually, traders close positions that move against the current trend.
Don't go against the trend unless you're sure a market reversal is coming.
However, if you're skilled enough, you can try trading against the current trend. Still, it's possible to do it only when the trend's strength weakens. You'll never win if the trend is strong. When you see an indication that it will return soon, you can open a position.
How can you determine when there's a chance the trend will turn around? It's crucial to combine technical and fundamental analysis. If technical indicators signal a market reversal, and fundamental factors say that market sentiment will turn around soon, feel free to open a position against the trend.
Trade With the Trend
The main rule of trend trading is to trade with the prevailing direction. The idea is simple: buy during an uptrend; sell during a downtrend. The trend reflects the opinion of a majority of traders.
Buy during an uptrend; sell during a downtrend.
However, it's essential that you enter the market at the perfect point. If you're trading in a bullish trend, enter the market when the price rebounds from the bottom trendline (support). If you're trading in a bearish trend, open a position when the price pulls back from the upper boundary of the trend channel (resistance).
How to Do Trend Trading
In the previous part, we explained what trend trading is. Now, let's determine several rules for how to do it:
- Step 1. The main step is to identify the trend. You can do it either with a trendline or trend indicators and chart patterns.
- Step 2. Find an entry point. Buy during a bullish trend on the rebound from the support. Sell during a bearish trend on the pullback from the resistance.
- Step 3. Always remember the stop-loss level. If you're trading during an uptrend, locate the stop-loss level below the previous low. If you're trading in a downtrend, place the stop-loss level above the previous high.
- Step 4. Place a take-profit level. You can calculate it by multiplying the stop-loss, keeping in mind the risk/reward ratio. In other words, your take-profit should exceed the stop-loss by at least two times, or you can place the take-profit at the level of the opposite boundary of the trend channel.
Trend Reversal
It's exciting to trade with the trend. However, the trend doesn't last forever, and it's crucial to determine when market conditions change. If the price of the security breaks below the resistance/support level, it's a sign of a possible market reversal. Still, additional confirmation is necessary.
Trends don't last forever.
Check the following points:
- The asset's price should close 1% below/above the broken level of the trend channel.
- Check the volume if available. It should be higher than average.
- Wait for confirmation from candlesticks. At least two candlesticks should close above/below the broken trendline.
- The next confirmation of the buy/sell signal can appear if the price tries to return to the broken level on the intraday chart. The sign is reliable if the volume is below the average.
- Use the ATR indicator. If the size of the break is more significant than the average ATR, the trend has reversed. In general, ATR gauges how volatile the exact number of the last candlesticks were.
Reversal and Correction
As mentioned above, any trend is built on constant price movement in a particular direction and small corrections. It's essential to know how to distinguish corrections from reversals.
Before we start, let's clarify that a reversal is a change for the entire trend, while a correction is a temporary change in price movements.
|
Correction |
Reversal |
|
|
What happens before |
A strong price movement |
Anything |
|
Reason |
No specific reasons |
Fundamental factors |
|
Type of traders |
Retail traders |
Large speculators |
|
Timeframe |
Short-term reversal (no longer than 1-2 weeks) |
Long-term reversal (more than 2 weeks) |
|
Chart patterns |
Candlestick patterns |
Reversal patterns |
Tips for Traders: Avoid Mistakes in Trend Building
Although there's nothing challenging about identifying the trend, traders make mistakes that you can easily avoid if you know about them.
- Trendlines. Although the trend is visible without drawn lines, we recommend outlining the channel. Doing so will help predict where the price may rebound.
- Only two lines. A trend consists of two lines. You may find lots of trends in the timeframe, but you should look for the primary one.
- At least two points. Any trendline can be drawn through at least two points. The more points you find, the more robust the trend is.
- Don't go against the trend. If you're a professional trader, you can try to determine the current trend's upcoming weakness. However, if you're a newbie, don't risk it. Follow the market sentiment.
- Check overbought/oversold conditions. Usually, the market reverses when it's overbought or oversold. Check it via technical indicators.
- Combine. It's better to draw trends on three subsequent timeframes and compare them.
- Don't be afraid of entering late. The main aim of any trader is to buy at lows and sell at highs. However, patience is the key to success.
- Check additional patterns. Because confirming signals using several indicators is crucial, it's important to find patterns that will establish market conditions.
- Keep your take-profit level. It's not recommended to change this order.
- Trail the stop-loss. However, you can trail the stop-loss if you're sure the market will move in your favour.
Conclusion
To sum up, a trend is the basis of forex trading. If you know how to identify a trend, you're more likely to build a successful trade. Trends provide perfect entry and exit points and show current market conditions.
To know how to draw the correct trend, you need to practice a lot. But please note that trading CFDs with leverage can be risky and may lead to losing all of your invested capital. It's better to start by trading in a demo account. Libertex provides a free demo account with the full range of trend indicators. You can use it to improve your skills trading your favourite securities with zero risk of losing money.
The answers to these questions will help you summarise the information you've learned here.
FAQ
What Are Market Trends?
A trend is a price direction for a certain period of time.
What Are the Different Types of Trends?
There are two main types of trends: an uptrend (bullish), a downtrend (bearish) and a third one: a sideways (flat, horizontal) trend.
How Do You Identify Market Trends?
To identify a trend, you can draw trendlines, use technical indicators and chart patterns. It's also crucial to look for confirmation and combine methods.
What Is the Best Trend Indicator?
There is no 'best' indicator. Still, we can recommend several to you: the Moving Average, ADX and Parabolic SAR.
Disclaimer: The information in this article is not intended to be and does not constitute investment advice or any other form of advice or recommendation of any sort offered or endorsed by Libertex. Past performance does not guarantee future results.
Why trade with Libertex?
- Get access to a free demo account free of charge.
- Enjoy technical support from an operator 5 days a week, from 9 a.m. to 9 p.m. (Central European Standard Time).
- Use a multiplier of up to 1:30 (for retail clients).
- Operate on a platform for any device: Libertex and MetaTrader.