
The Alligator Indicator by Bill Williams: Use Your Imagination
Prepared by the Libertex team
Content reviewed internally in accordance with regulatory standards.
The Alligator indicator is one of the basic trend indicators. Its idea is straightforward, to determine the trend. Bill Williams believed that market players collect most of their profits during strong trends. When Williams was working on the indicator, he followed the presupposition that the financial markets move within the trend just 15% to 30% of the time and in sideways ranges the other 70% to 85%.
What Williams Alligator Stands For
The Alligator indicator is a trend indicator that consists of three lines: smoothed moving averages. Bill Williams called these moving averages balance lines. Each of them depicts a part of the Alligator's mouth:
Caption:
- Alligator's Jaw (blue line) is the slowest moving average. It's a 13-period moving average, which is moved 8 bars forward.
- Alligator's Teeth (red line) is the intermediate 8-period moving average, which is moved 5 bars into the future.
- Alligator's Lips (green line) is the fastest moving average among the three. It's the 5-period moving average, which is shifted 3 bars ahead.
Why the Alligator Indicator Matters
Alligator isn't the only indicator created by Bill Williams. Nonetheless, it's famous among forex traders all around the world. The popularity is based on simplicity and accessibility. You'll find the indicator on any trading platform.
Also, you don't need to change any settings. If you're familiar with other indicators, you know that most of them require changing the settings regarding the timeframe you trade. It's not the case with the Alligator indicator. Moreover, it's easy to remember the signals it provides. Just associate the indicator with an actual alligator and imagine its life stages.
How the Alligator Pattern Works
Let's see how the indicator works and what signals it gives.
Basic Calculations
Even though you don't need to calculate the indicator yourself, it's worth knowing what the rules of the lines' building are. As we said above, the indicator has three smoothed moving averages of 5-, 8- and 13-periods.
The formula is simple:
- Median price = (HIGH + LOW) / 2
- Alligator's jaw = SMMA (Median price, 13, 8)
- Alligator's teeth = SMMA (Median price, 8, 5)
- Alligator's lips = SMMA (Median price, 5, 3)
Where:
- HIGH is the highest price of the bar
- LOW is the lowest price of the bar
- SMMA (1, 2, 3) is a smoothed moving average. A is the median price, B is the moving average period and C is the move to the future.
Let's Read the Alligator Indicator Signals
The Alligator is always implemented into any trading platform because of its simplicity. It's one of a few indicators that even a beginner can use.
Bill William created the analogy with the Alligator to describe the behaviour of the market according to the phases of the Alligator's daily routine. For example, the time of the trend absence or sideways moves relates to the Alligator's sleeping. Afterwards, the Alligator wakes up and looks for its prey. It's a trend period. The trend strength depends on the length of the sideways trading as the Alligator's hunger depends on when it was sleeping.
Traders use this indicator to determine the lack of a trend, the period of the trend formation and its direction.
Lack of the Trend
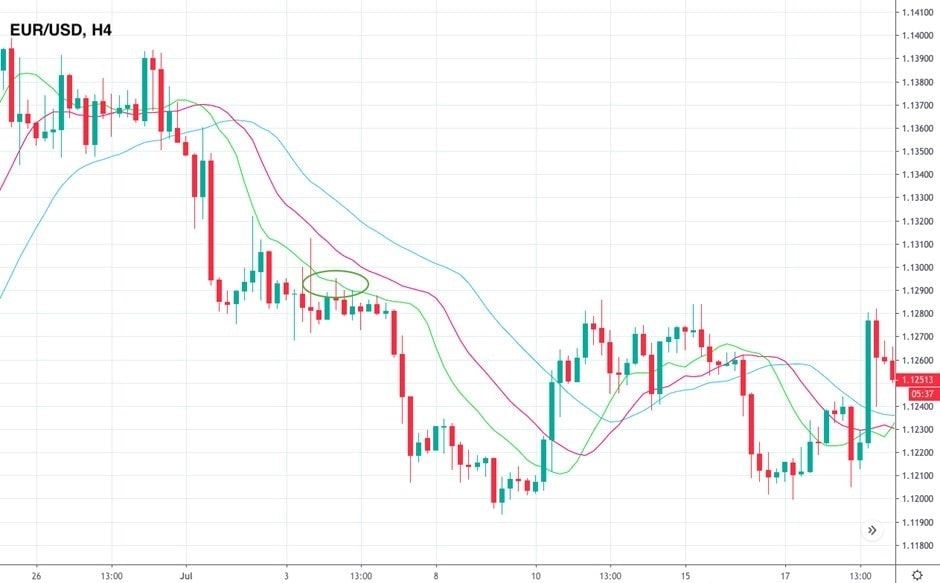
It's the time when our Alligator is sleeping, so its jaw, teeth and lips are serried. As a result, all of Bill Williams's 3 lines are either too close to each other or intertwined. Look at the chart below. As you can see, the pair had been trading sideways, and the indicator's lines were crossing each other. Williams recommended staying out of the market in times of consolidation.
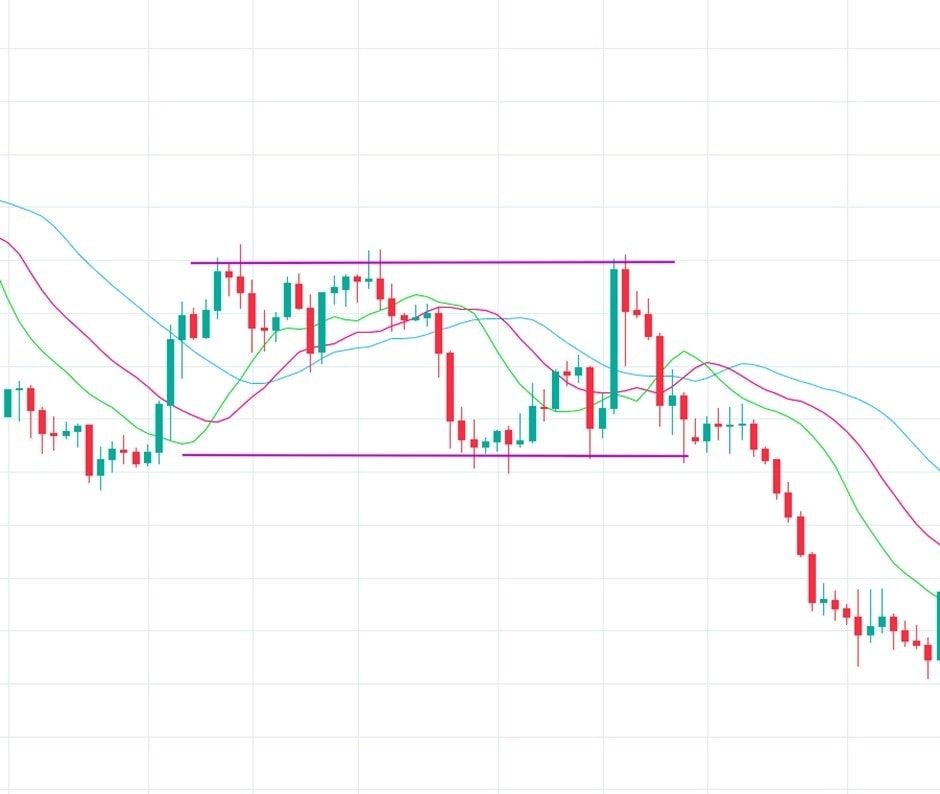
Caption: Times of consolidation
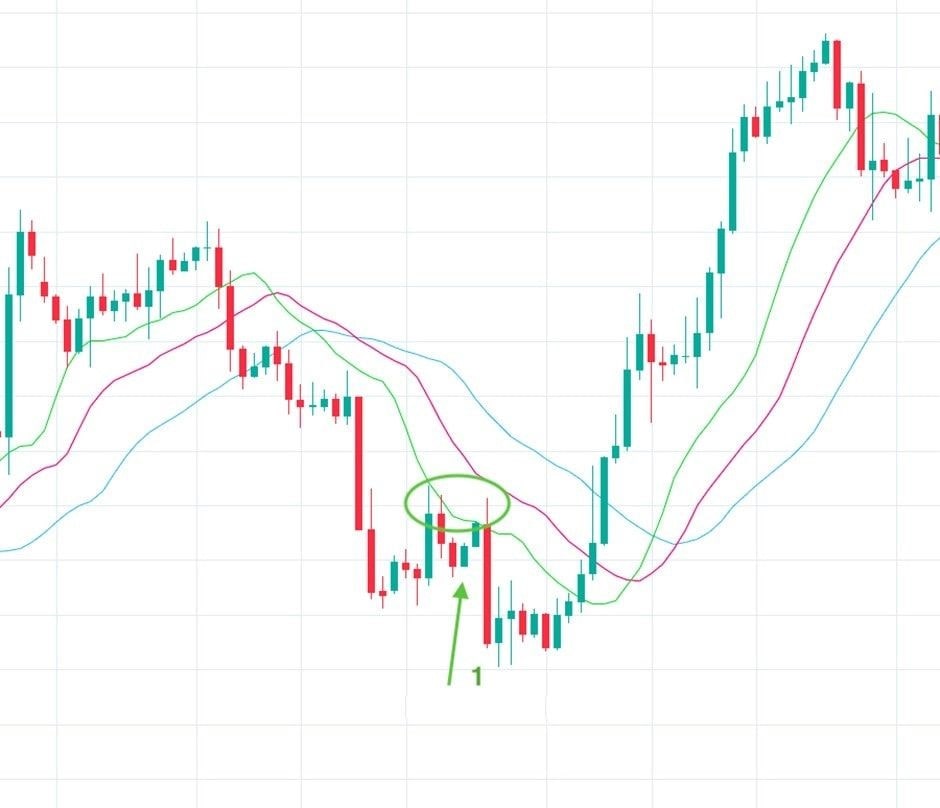
Trend Formation
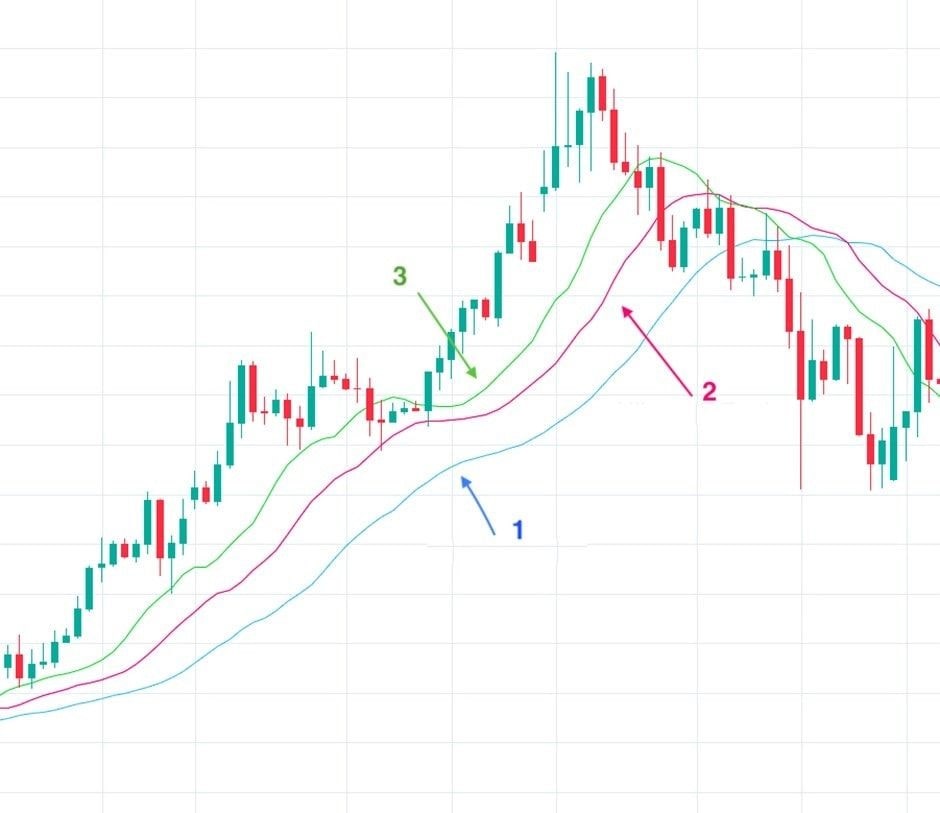
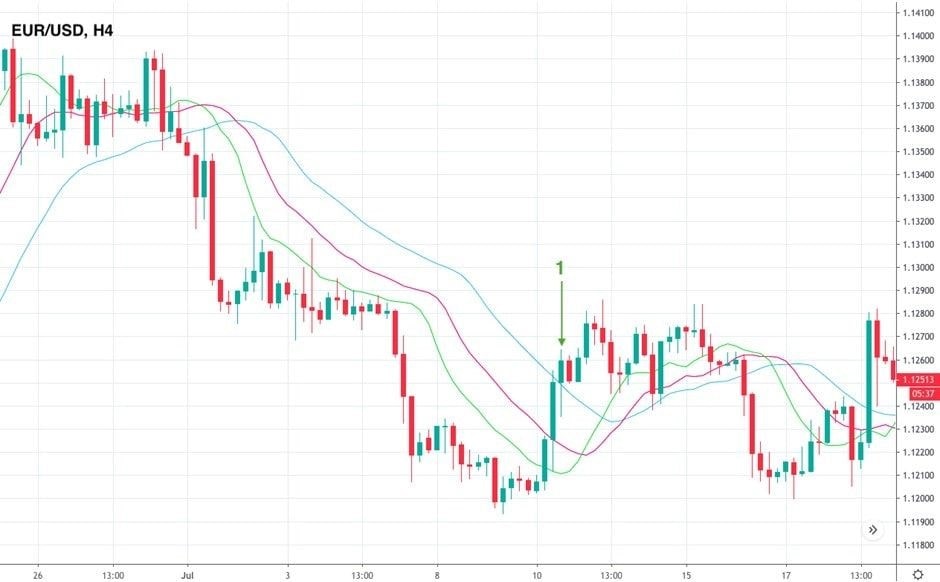
We can notice the formation of a trend when the fastest moving average (green line) crosses the other two lines. They all should move in one direction. The strength of the trend will reflect the length of the sideways movement. The bigger the distance between the lines, the stronger the trend is.
Trend Direction
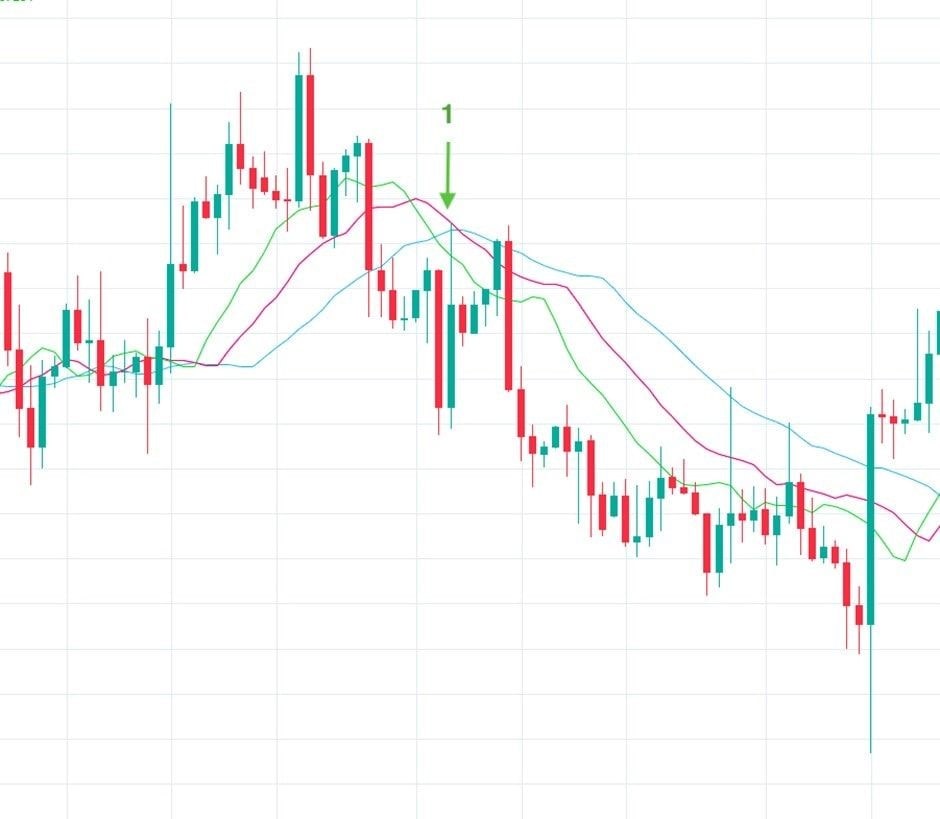
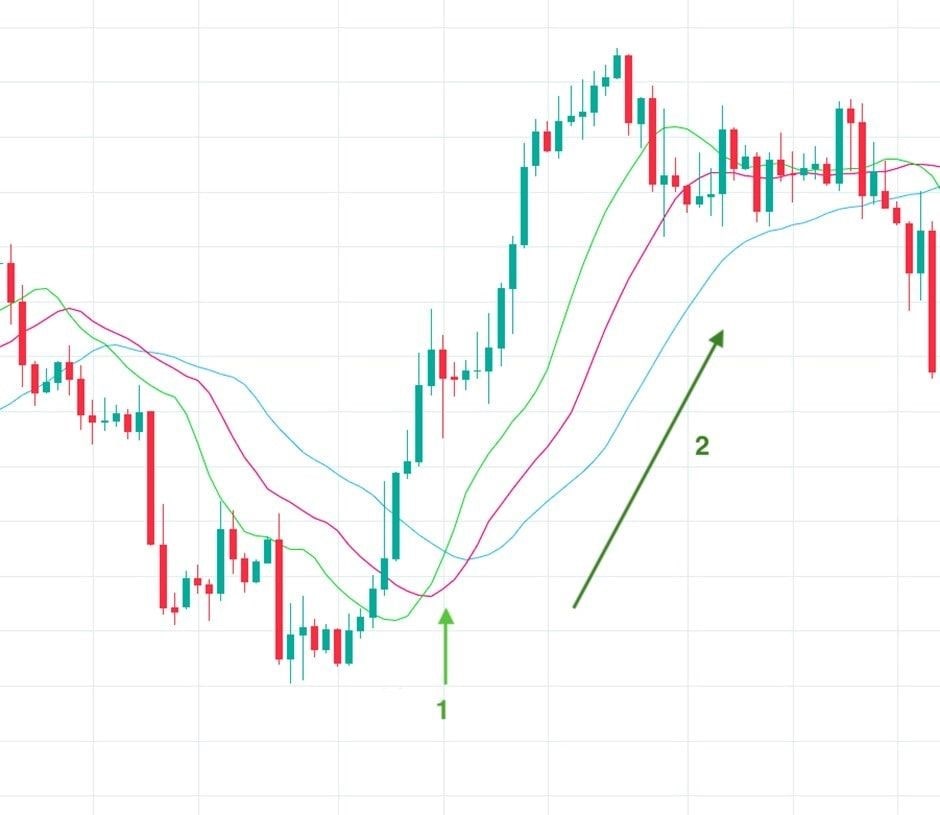
The course of the moving averages simply identifies the trend direction. If they move down and widen even more, it's a strong downtrend signal. If they move up and diverge from each other, it's a sign of a strong uptrend. Note that all three lines are under the price in the uptrend and above the price during the downtrend.
Nevertheless, it's more important for a trader to determine the direction in the initial stages. You can learn the trend direction following the fastest (green) moving average. If it crosses other lines from top to bottom, it's a signal to sell. When it breaks above both moving averages, it's a signal to buy.
Trend Strength
You can detect the power of the indicator not only by the spread between the moving averages but the price interaction. If the price goes beyond the green line for short periods, it's a signal that the trend will soon end. The more times the price breaks the green line, the weaker the trend.
How to Apply the Alligator Indicator on the Chart
There's no difference in which trading platform you use. The Williams Alligator is the standard indicator that is always on the list. You don't need to change any Alligator indicator settings. The standard ones work the best. It's even not recommended to change line colours because there's a risk you will get confused while looking for signals.
Mistakes While Using the Alligator Pattern
The William Alligator is one of the simplest indicators. Nevertheless, some traders, especially beginners, make mistakes using it.
Fake Cross
Although the Alligator indicator is one of the most reliable ones, it may also provide fake signals. If the green line crosses the red line opposite to the existing trend and then gets back, it's a fake cross. One of the indicator's drawbacks is the time lag, which is a common pitfall of all the indicators. You'll likely see the fake cross much later than the price continues moving within the current trend.
Missed Signals
One of the most important parts of trading is to find the perfect entry. If you don't have much experience in trading with the Alligator indicator, you may have some difficulties. When the Alligator is sleeping (so the lines are either close to each other or entwined), there are frequent crossovers that look like a signal.
However, it's crucial not to get fooled and enter the market without confirmation. Remember, the indicator signals a trend as soon as balance lines move away from each other. Here, it's essential not to procrastinate but to catch the perfect entry point.
Remember that other indicators may give a confirmation too. We'll talk more about it in the "How to Combine the Alligator Indicator" section.
Missed Profit
Earlier, we stated that the indicator signals the trend strength. Let us remind you that the more frequently the price touches the fastest moving average (green line), the sooner the trend will end. However, it doesn't mean the trend ends immediately. As a result, the most common mistake is that traders close the position earlier than they should. In such a situation, you need to be ready to close the trade soon – but only after a more reliable confirmation either from another indicator or when the distance between the Alligator's lines becomes narrow.
How to Combine the Indicator
No matter how good the indicator is, you always need to get confirmation of a signal. Let's take a look at the indicators you can use together with the Alligator. As the Alligator stands for the trend indicator, it's worth combining it with another trend indicator but the one that uses a different methodology. For example, Parabolic SAR. It'll help you avoid fake signals that often appear in times of the sideways market.
Another good indicator is the Ichimoku Kinko Hyo. Yes, this indicator is based on the moving averages as well. However, it's one of the most reliable indicators in the forex market.
As for non-trend indicators, you can combine the Alligator with the RSI indicator. The RSI gives strong reversal signals based on the divergence. You can find either a bullish or bearish divergence that the indicator forms with the price chart. As soon as you notice a divergence, it's a signal that the price will move in another direction soon. If you see the price touches the green line frequently or the spread between the lines contracts, it's time to close the position.
Trustworthy Alligator Strategy
You know how to implement the indicator on the chart and read its signals, but it's worth noting one strategy that will bring you potential profit.
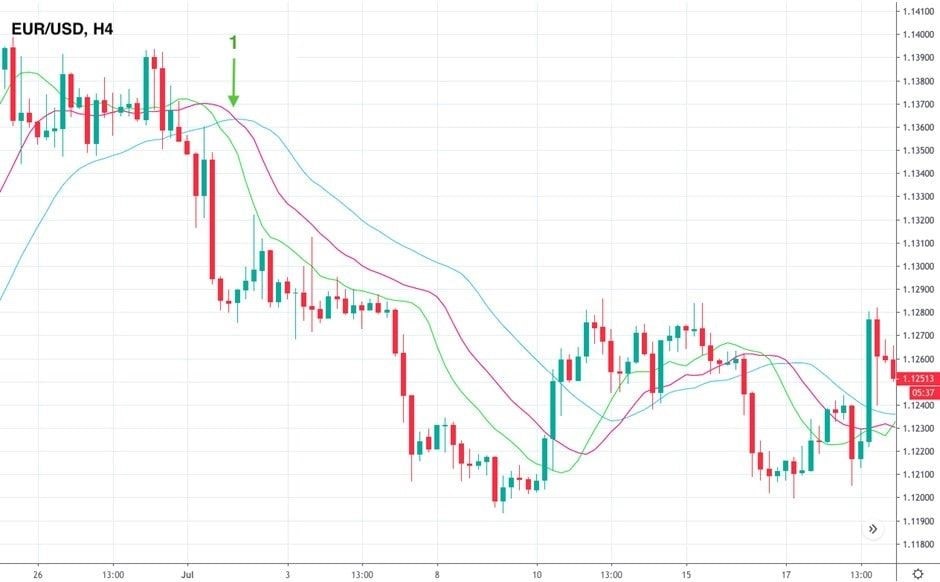
Step 1. Open any timeframe you want to trade on and implement the Alligator indicator.

Step 2. Wait for the fastest line (green line) to cross the other lines upside down.
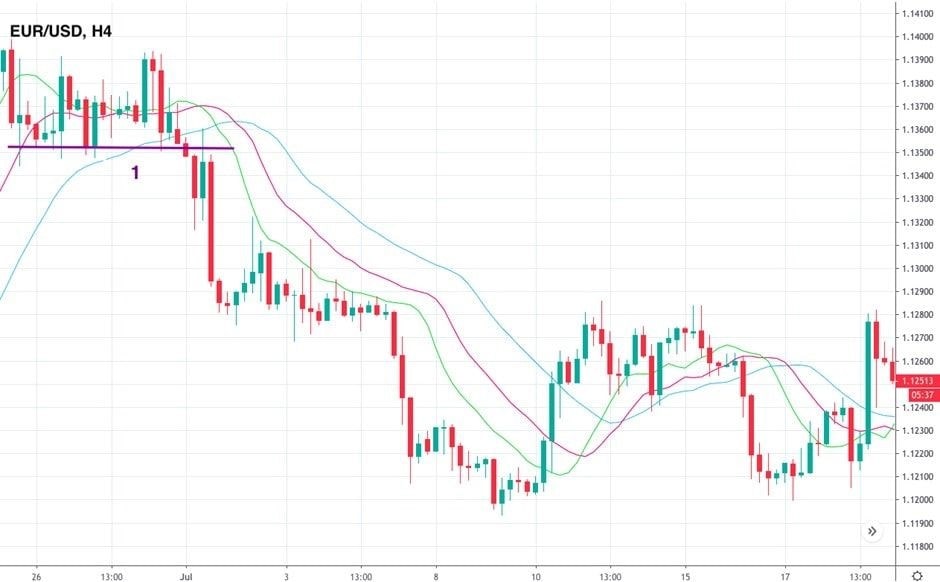
Step 3. Place the support level regarding the previous lows.
Step 4. Wait for the candlestick to close below the support level. Open the sell position.
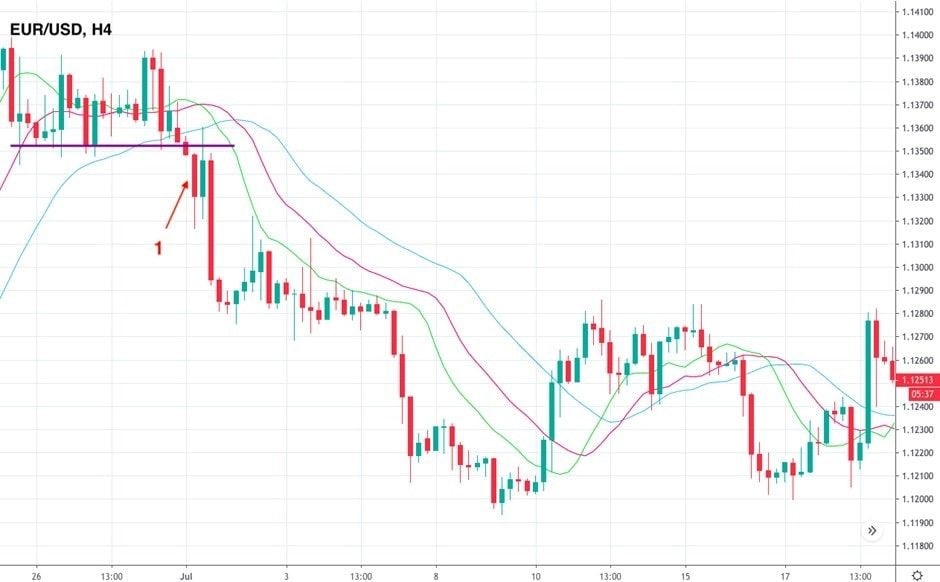
Step 5. Be careful if the price touches the green line. It's a signal of the trend's weakness.
Step 6. Close the position as soon as the price crosses all three lines.
Conclusion
Overall, the Williams Alligator indicator is one of the leading indicators all around the world. It became popular because of its accuracy and simplicity.
Bill Williams used pure imagination to explain the indicator. He once said that even a blind chicken will find its corn if it's always fed at the same time, and it took them years to produce an indicator that lets us always keep our powder dry until we reach the blind chicken's market. It's enough of a fast glance at the indicator to understand what is happening in the market.
Check out available trading tools on a Libertex free demo account. Try out the wide range of the most useful indicators and learn to trade effectively!
Bill Williams invented several indicators. Let's consider two of them.
FAQ
What Is a Fractal Indicator?
The fractal indicator is one of the Bill Williams indicators. It's used to identify trend potential and reversal points of the market.
A fractal consists of five complete candlesticks. The Williams fractal indicator puts an arrow above the middle or third candlestick that has two candlesticks on the right and two candlesticks on the left.
There are two types of fractals: A bullish fractal (down fractal) and a bearish fractal (up fractal). A bearish fractal has the middle candlestick with the highest high, among others. Although this fractal is up and the arrow is above the candlestick, it signals a downward movement.
A bullish fractal has a middle candlestick with the lowest low, among other candlesticks. The arrow is placed below the candlestick. Nevertheless, fractal gives a signal to buy.
How Do You Use an Awesome Oscillator Indicator?
The Awesome Oscillator is another indicator developed by Mr Williams. Traders use the indicator to measure the dynamics of momentum. The indicator is based on Moving Averages.
It compares momentum for the last five candlesticks with the momentum of the last thirty-four candlesticks of a bigger timeframe. The calculation is made by subtracting moving averages over these timeframes. The Simple Moving Averages are formed not at a closing price but midpoints of each candlestick.
The indicator gives several signals.
- Zero level. If the indicator rises above the zero level, it's a bullish signal. If it falls below the level, it's a bearish signal.
- Two picks. When the indicator forms two highs above the zero level and the trough between them doesn't plunge below 0, the signal is bearish. The second high must be lower than the first one and be followed by a bearish bar. On the contrary, if the indicator formed two minimums below the zero level, and the trough between them didn't rise above 0, it's a bullish signal. The second low should be higher than the first one, which should be followed by a bullish bar.
Disclaimer: The information in this article is not intended to be and does not constitute investment advice or any other form of advice or recommendation of any sort offered or endorsed by Libertex. Past performance does not guarantee future results.
Why trade with Libertex?
- Get access to a free demo account free of charge.
- Enjoy technical support from an operator 5 days a week, from 9 a.m. to 9 p.m. (Central European Standard Time).
- Use a multiplier of up to 1:30 (for retail clients).
- Operate on a platform for any device: Libertex and MetaTrader.