
Ichimoku Kinko Hyo: Hard But Effective
Prepared by the Libertex team
Content reviewed internally in accordance with regulatory standards.
A newbie trader might be intimidated just by this indicator's name. They're not likely to change their mind if they look at it on the chart. Ichimoku Kinko Hyo sounds and looks complicated, which is why many traders avoid using it. Nevertheless, it's one of the most common and useful indicators for forex traders. We'll do our best to explain it as simply as possible.
Ichimoku Kinko Hyo: What Does It Mean?
Ichimoku Kinko Hyo, or Ichimoku, is a technical analysis indicator consisting of five lines: the tenkan-sen, kijun-sen, senkou span A, senkou span B and chikou span. It was created by the Japanese journalist Goichi Hosoda in the late 1960s.
This indicator is used to gauge momentum, determine the trend and place support and resistance levels. This wide range of applications makes it a match for most of your trading needs.
How to Interpret and Calculate the Ichimoku Kinko Hyo
As we said above, the indicator consists of five lines. Let's take a closer look at them:
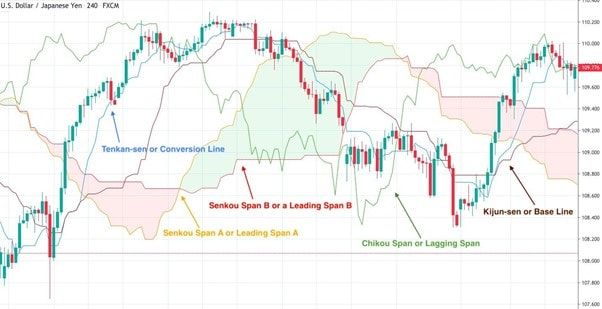
- Tenkan-sen (the blue line) is a conversion line. To calculate it, add the highest high and the highest low over the past nine periods and divide the result by two. This line is commonly used to determine support and resistance levels and a trend reversal.
- Kijun-sen (the brown line) is the baseline. To calculate it, add the highest high and the lowest low over the past 26 periods and divide it by two. This line functions similar to the tenkan-sen and can be implemented as a trailing stop-loss point.
- Senkou Span A, or Leading Span A (the orange line), can be found by adding the tenkan-sen and kijun-sen and dividing the result by two. You'll plot the result 26 periods ahead. This line is one of the cloud's edges and is used to determine future support and resistance levels.
- Senkou Span B, or Leading Span B (the red line), can be found by adding the highest high and the lowest low over the past 52 periods, dividing the result by two and plotting it 26 periods ahead. This line works with the Senkou Span A and forms another edge of the cloud, determining future support and resistance areas.
- Chikou Span, or the Lagging Span (the green line), is the line that represents the current period's closing price plotted 26 periods back. It functions similar to the others, i.e., to find possible support and resistance levels.
This brief explanation should make it easier. Take a look at the picture below to find all the mentioned lines on the real-life chart.
Catch the Ichimoku Signals
Here's how to catch Ichimoku Kinko Hyo signals.
Senkou Span. We've previously mentioned two lines: A and B. Now, we'll talk about the cloud they form. The cloud is the key point of the indicator, which gives many signals.
- If the price is above the cloud, the first line or leading span A will serve as a first support level; the second line is the second support level.
- Alternatively, if the price is below the cloud, the bottom line or leading span B will become the first resistance. The leading span A will be the second resistance.
- If the leading span B is above the leading span A, it signals a bearish trend.
- If the leading span A is above the leading span B, it signals a bullish trend.
- If the price is inside the cloud, it's a signal that traders aren't sure about the asset's future direction.
- If the cloud is thin, it's a sign of low volatility.
- If the cloud is wide, volatility is high.
Kijun-sen, or a baseline, will determine the future price movement. If the price is above it, the rise is more likely to be prolonged. If the price is below the baseline, a trader can expect a prolonged decline.
Tenkan-sen, or a conversion line, determines the short-term trend. If it moves up, it's an uptrend. If it moves down, it's a downtrend. If it moves sideways, the price is consolidating. Moreover, if the price is above the line, it's a short-term buy signal. If the price is below the line, it's a short-term sell signal.
Chikou Span will give you buy/sell signals. If the line crosses the price downwards, it's a buy signal. If it breaks the price upwards, it's a sell signal.
Why Does Ichimoku Matter?
Although this indicator consists of many lines that can create noise on the chart, you need just two minutes to catch its signal. You'll get something no matter what signal it is: a trend reversal, momentum or a buy/sell signal. Plenty of lines help the indicator cover different aspects of the market situation. That's why Ichimoku provides so many signals.
Moreover, the indicator is pretty accurate. Of course, it may occasionally provide fake signals from time to time, but that happens very rarely.
Benefits and Pitfalls of the Ichimoku Indicator
If a trader wants to decide whether to use the indicator, they inevitably look for advantages and disadvantages. We've compiled a table to help you.
| Pros | Cons |
| Multifunctionality. You can use it to place support and resistance levels. Every trader knows that these levels are some of the essential tools for trading. You can also find a trend, catch momentum and get a buy/sell signal. |
Too complicated. This phrase is commonly used by traders who see the indicator for the first time. The significant number of lines and clouds makes the chart look very busy. You can get lost among all these lines, especially if you add another indicator. If you want to make the chart clearer, you can hide unimportant lines. It's up to you to decide after you practice using and decide to implement this indicator in your trading strategy. |
| Varied uses. This indicator will help you with trading in forex and other markets dealing with stocks, futures and options. | Historical data. The indicator's use of past data to predict future prices is a drawback it shares with other indicators. That's why some signals can be false or delayed. |
| Fast results. The indicator looks complicated and creates market noise. Nevertheless, you don't need a lot of time to get the signal. It'll show you the trend, momentum or support/resistance levels. | |
| Easily combined. Although Ichimoku provides many signals, any signal should be confirmed by either a candlestick or another indicator. The Ichimoku cloud is easily combined with such indicators as the RSI or MACD. Feel free to mix them to get the most reliable signal. |
Common Ichimoku Mistakes
It might be difficult to understand the meaning of each line, which is why the most common mistake among traders is misinterpreting lines. It's not easy to remember their names and functions, so traders get the wrong signals. All you need to do is select which colours you want to use and set a colour for each line.
The second mistake you can face is market noise. Don't apply too many indicators. We recommended combining Ichimoku with other indicators for more reliable signals, but that doesn't mean you should implement too many. Use only one additional indicator, and it's better if it's placed below the chart. Oscillators are always located in the window below the chart, so you'll definitely see signals.
The next mistake you can make while using the indicator is getting a false confirmation. Ichimoku Kinko Hyo has many functions: it can confirm a trend, determine momentum, help place support and resistance levels and give buy/sell signals. To confirm a signal, you need to find a proper additional indicator. Sometimes, traders don't know other indicators' functions. As such, they either don't get a confirmation or get a false one.
The Best Ichimoku Trading Strategy
To make your first step with the Ichimoku Kinko Hyo indicator easier, here's a trading strategy you can use. By following these steps, you'll find a good point to possibly increase your income. Later, you can add the indicator to your trading strategy and find other entry and exit points.
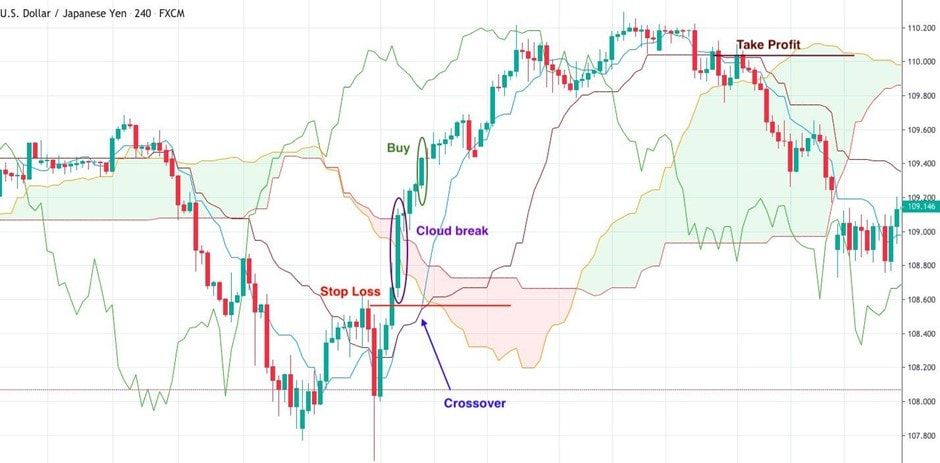
- First, wait for the price to close above the cloud. If it does, it's more likely that you'll see an uptrend.
- After that, the conversion line (tenkan-sen) needs to break above the baseline (kijun-sen). If both conditions are fulfilled, you can start looking for a good entry point to open a long position.
- You can open a trade at the opening of the candlestick that followed the crossover.
- Remember about the stop-loss level. Place the stop-loss 5-10 pips below the candlestick that broke above the cloud. You can trail the stop-loss based on the market situation.
- It's time to use a take-profit order. Close the position as soon as the conversion line breaks below the baseline.
This strategy can be applied to a sell position, as well. Just use all the steps in reverse.
Conclusion
To sum up, the Ichimoku Kinko Hyo indicator sounds and looks complicated. Many traders don't use it for that reason, but that's a big mistake. You need to find proper colours for each line and learn what signals the lines provide. In the beginning, you can simply save the part of our article where we talk about each line's function and use it while trading. To put your knowledge into practice, you can open a Libertex demo account. It's a free and easy way to build your new trading strategy with the new indicator.
Even after learning the indicator's basics, traders may still have questions, and we're here to answer them all.
The Most Frequently Asked Questions About Ichimoku
What Is the Best Timeframe for Ichimoku?
There's no best timeframe for the Ichimoku indicator. No matter what timeframe you apply it to, the lines will be calculated based on the timeframe. As such, you'll get proper signals on any timeframe, from one minute to one month.
What Is the Best Indicator to Use with Ichimoku?
Ichimoku can be applied to many situations and provide many signals. To find the perfect match, you need to understand what signal you're looking for. If you want to catch the momentum, use indicators such as the RSI or Momentum. If you want to confirm a trend, place something like Parabolic SAR or MACD. If you're looking for a buy/sell signal, you can also use the RSI, MACD or Awesome Oscillator.
What Is the Ichimoku Cloud Strategy?
The cloud is the central part of the indicator. It's formed by two lines and provides a vast number of signals. To sum them up, here are three crucial rules.
- Open a position when the price breaks the cloud. The position's direction will be determined by the breakout's direction. Keep the position open until the price breaks the kijun-sen or baseline in the opposite direction.
- Open a position when the price breaks the cloud. Again, you'll either buy or sell, depending on the breakout's direction. Close the position as soon as the chikou span breaks the tenkan-sen in the opposite direction.
- Open a position when the price breaks the cloud. Choose the direction based on the breakout's direction. Close the position as soon as the price breaks the cloud in the opposite direction.
Disclaimer: The information in this article is not intended to be and does not constitute investment advice or any other form of advice or recommendation of any sort offered or endorsed by Libertex. Past performance does not guarantee future results.
Why trade with Libertex?
- Get access to a free demo account free of charge.
- Enjoy technical support from an operator 5 days a week, from 9 a.m. to 9 p.m. (Central European Standard Time).
- Use a multiplier of up to 1:30 (for retail clients).
- Operate on a platform for any device: Libertex and MetaTrader.