

Bullish vs. Bearish: What Every Investor Needs to Know
Prepared by the Libertex team
Content reviewed internally in accordance with regulatory standards.
Sharp swings in stock prices leave investors and traders asking one question first: is the market bullish or bearish? A bullish market points to rising prices and optimism. A bearish market points to falling prices and caution. Reading these two forces of market sentiment shapes every sound investment decision.
Key Takeaways
- Bullish means investors expect prices to rise; a bull market is a gain of 20% or more from a recent low.
- Bearish means investors expect prices to fall; a bear market is a decline of 20% or more from a recent high.
- Bull markets have run a median of 42 months with a median 87% gain; bear markets a median of 19 months with a median 33% drop.
- Missing the S&P 500's 10 strongest days over 30 years cut returns roughly in half.
- Market direction matters less than a disciplined, goal-based strategy applied through every cycle.
- Risk Warning: CFDs are complex instruments and come with a high risk of losing money rapidly due to leverage. You should consider whether you understand how CFDs work and whether you can afford to take the high risk of losing your money.
What Does "Bullish" Mean in Investing?
Bullish describes an investor who expects prices to rise. A bull market is a sustained advance of 20% or more from a recent low, over at least two months, an upward market trend that can run for months or years. Analysts and traders track the trend using benchmarks such as the S&P 500, a stock market index of 500 large U.S. companies, and the Dow Jones Industrial Average.
One of the longest modern bull markets ran from 9 March 2009 to its 19 February 2020 peak, about 132 months. Over that run it lifted the S&P 500 roughly 400%. Optimism fuels demand, and FOMO (fear of missing out) often accelerates it late in a rally.
What Does "Bearish" Mean in Investing?
Bearish describes an investor who expects prices to fall. A bear market is a decline of 20% or more from a recent high, over at least two months, a sustained downward market trend. A brief correction of 10% to 20% does not meet that bar.
During the 2007 to 2009 bear market, the S&P 500 fell about 57%. The index dropped from a 1,565.15 peak on 9 October 2007 to a 676.53 low on 9 March 2009. Pessimism, panic selling, and loss aversion drive the decline.
Where These Terms Came From: A Brief History
The word bear came first, from an 18th-century proverb: do not sell the bear's skin before catching the bear. That saying produced the term "bearskin jobber" for a speculator selling stock short.
Bull originally meant a speculative purchase made in expectation of rising prices, and later the buyer making it. The popular image of a bull thrusting its horns upward is memorable but unconfirmed.

How Bull and Bear Markets Work: Supply, Demand, and the Economic Backdrop
Bull and bear markets run on supply and demand. In a bull market, demand for securities outpaces supply as confidence spreads, and prices climb alongside economic expansion. In a bear market, supply overwhelms demand as pessimism takes hold, often ahead of an economic slowdown.
Picture an auction: more bidders than lots push prices up, while empty seats let them fall. Bull markets often coincide with favourable economic conditions or a recovery from a downturn.
Bullish vs. Bearish: Key Differences at a Glance
Bullish and bearish markets differ across six practical dimensions. The table below sets them side by side as a quick reference. Each row isolates one axis, from price direction to the emotions that drive it.
| Dimension | Bullish market | Bearish market |
| Meaning | Prices rising 20% or more from a recent low | Prices falling 20% or more from a recent high |
| Outlook | Optimistic | Pessimistic |
| Market direction | Upward | Downward |
| Investor behaviour | Accumulating positions, higher risk appetite | Selling, capital preservation |
| Emotional driver | Optimism and FOMO | Fear and loss aversion |
| Typical strategy | Buy-and-hold, index investing | Defensive rotation, hedging |
Source: Fidelity
How to Spot a Bull or Bear Market: Signs and Indicators
Investors and traders can read a shift in the market trend before it becomes obvious to everyone. Two toolkits make that possible. The first reads the crowd's mood. The second, technical and economic indicators such as the Cboe Volatility Index and moving averages, measures momentum and the wider economy.
Market Sentiment Indicators
Four sentiment indicators give investors a near real-time read on the market's mood:
- The Cboe Volatility Index (VIX), the fear index, measures the S&P 500's expected 30-day volatility. Readings above 30 flag rising anxiety.
- The put/call ratio compares bearish put options with bullish call options for a directional read.
- Trading-volume spikes confirm the conviction behind a move, whether up or down.
- News sentiment acts as a qualitative, forward-looking gauge of the crowd's mood.
Technical and Economic Indicators
A golden cross forms when the 50-day moving average rises above the 200-day moving average, a bullish indicator. A death cross, the reverse, is bearish. Wider context comes from macro data such as gross domestic product and the unemployment rate.
Trading platforms such as MetaTrader 4 and MetaTrader 5, available on the Libertex platform, plot moving averages natively. Macroeconomic releases sit outside the charts and come from official statistics agencies.
Investor Psychology: Why Markets Move the Way They Do
Emotion moves markets as much as fundamentals do. Greed, fear, and herd behaviour push prices away from a security's underlying value, sometimes sharply. The emotional cycle tends to run from greed to euphoria near a market peak, then to fear and capitulation near a bottom.
Recognising that cycle in yourself is the first defence against acting on it. Behavioural finance studies these patterns systematically.

Common Psychological Traps: FOMO, Panic Selling, and Overconfidence
Three biases repeatedly hurt investment outcomes:
- FOMO (fear of missing out) pushes investors to pile into rallies at their peak, as many did chasing technology stocks in late 2021 before the 2022 downturn.
- Panic selling locks in the deepest losses by dumping holdings at or near the bottom, exactly when recoveries tend to begin.
- Overconfidence convinces investors a bull run will last indefinitely, which pushes them into over-concentrated, higher-risk portfolios.
Loss aversion, the tendency to feel losses more intensely than equivalent gains, sits underneath all three.
Why Trying to Time the Market Rarely Works
The math punishes market timing. Hartford Funds found that missing the S&P 500's 10 strongest days over 30 years cut returns roughly in half, while missing the best 30 days cut them by 84%. Some 76% of those best days fell during a bear market or a bull market's first two months.
Wells Fargo Investment Institute measured a fully invested portfolio at 8.4% a year from July 1995 to June 2025, against 2.1% for one that missed the 30 strongest days, below the 2.5% average inflation rate. Past performance is no guarantee of future results.
Loss aversion drives the mistake. Because investors feel losses more intensely than equal gains, they tend to sell after declines and re-enter after rallies, capturing the downside and missing the rebound.
Strategies for Navigating Bull and Bear Markets
Knowing the market's direction pays off only alongside a disciplined strategy. The four approaches below adapt to bull markets, bear markets, an investor's timeline, and the emotional pressure that undermines good decisions. Each is a starting framework, never a personal recommendation.
Bull Market Strategies
Bull market strategies aim to capture sustained upside without overreaching. Buy-and-hold keeps quality positions through short-term noise. Regular investing into index funds and ETFs (exchange-traded funds) that track benchmarks such as the S&P 500 spreads entry points over time.
Momentum approaches follow an established upward direction. Discipline matters most in a bull run's late stages, when speculative hype inflates valuations.
Investors and traders can gain exposure to rising markets through CFDs or by investing in real stocks on the Libertex platform. Returns are never guaranteed.
Bear Market Strategies
Bear market strategies focus on protecting capital while staying engaged. Defensive rotation shifts weight toward less volatile sectors. Dollar-cost averaging buys at set intervals through a decline to lower the average entry price.
Some traders short-sell falling assets through CFDs on the Libertex platform, with leverage up to 30:1. Leverage magnifies both gains and losses, so a short position can move against the trader quickly.
Aligning Strategy With Investment Timeline and Risk Tolerance
Asset allocation should follow personal goals and time horizon, not the market's current direction. Rules of thumb subtract your age from 100, 110, or 120 to set an equity weighting. They offer a starting point rather than a prescription.
A longer horizon can support a higher equity share, while a shorter one leans toward bonds and cash. Periodic rebalancing keeps the mix on target. For decisions tied to your own circumstances, consult a qualified financial adviser.
A Structured Framework for Staying Objective
A simple, repeatable checklist keeps decisions objective whether the market is bullish or bearish:
- Confirm the reading with a second indicator before acting.
- Size the position so a loss stays within your risk tolerance.
- Check that the trade fits your stated investment horizon.
- Run an emotional check: is FOMO or fear driving this, or a rational read?
- Decide whether the portfolio needs rebalancing.
Applied consistently, the checklist separates evidence from emotion. It works the same in a bull or bear market.
Bull and Bear Markets in History: Real-World Examples
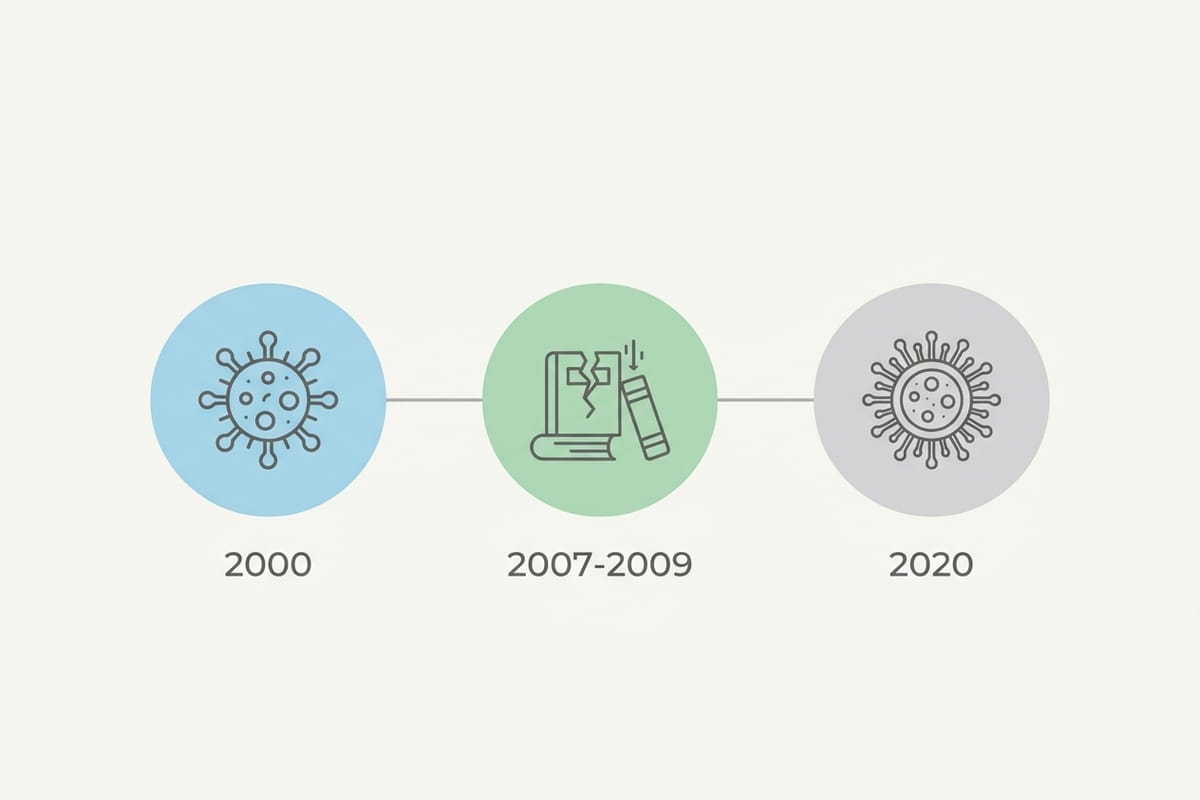
Three episodes carry lessons that outlast any cycle.
The dot-com bubble peaked when the Nasdaq Composite closed at 5,048.62 on 10 March 2000. It then fell about 77% by October 2002 as unprofitable internet firms collapsed. The lesson: valuation eventually matters.
The 2008 crisis drove the S&P 500 down about 57%, from a 1,565.15 peak on 9 October 2007 to a 676.53 low on 9 March 2009, with the Lehman Brothers bankruptcy of 15 September 2008 at its centre. The lesson: systemic risk spreads fast.
The COVID-19 crash cut the S&P 500 about 34% between its 19 February 2020 peak and a 23 March 2020 low. The index recovered above that peak by 18 August 2020. The lesson: a fast policy response can reshape a downturn.

By the Numbers: Bull and Bear Market Duration and Returns
Historically, bull markets have lasted longer and delivered more than bear markets have taken away. The S&P 500 has recorded 26 bull and 26 bear markets since 1872. Bull markets ran a median of 42 months with a median gain of 87%. Bear markets ran a median of 19 months with a median drop of 33%.
Read this as historical context, not a forecast. Past performance is no guarantee of future results.
| Market type | Median duration | Median return |
| Bull market | 42 months | +87% |
| Bear market | 19 months | -33% |
Source: Fidelity
Bear Market vs. Recession: Understanding the Distinction
A bear market and a recession often move together but differ. The first is a 20% or greater fall in securities prices. The second is a broad contraction in economic activity.
The National Bureau of Economic Research (NBER) defines a recession as a significant decline spread across the economy and lasting more than a few months. It weighs depth, diffusion, and duration over the informal two-quarters-of-falling-GDP rule. The 2020 recession lasted just two months, an exception the committee allowed for its exceptional depth and breadth. As of 2026, the NBER had not dated a new U.S. recession since the February to April 2020 downturn.
How Market Sentiment Affects the Broader Economy
Market sentiment and the real economy feed into each other. Optimism supports hiring, consumer spending, and output. Prolonged pessimism can freeze hiring and lift unemployment.
The 2020 shock shows the link: U.S. real GDP contracted at an annualised 31.4% rate in the second quarter of 2020. Unemployment peaked at 14.7% in April 2020. Treat this as correlation, not proof of direct causation.
Market Dip, Correction, Bear Market, or Crash: Decoding the Severity Scale
Not every decline is a bear market, and the labels are not interchangeable. They sit on a severity scale that runs from a dip, through a 10% to 20% correction, to a bear market's 20% or greater fall, and finally a crash. A crash is a sharp, severe drop over a short period, with no fixed percentage threshold. The COVID-19 sell-off was a crash: the S&P 500 lost about 34% in roughly a month in early 2020.
| Term | Decline range | Typical duration | Recent example |
| Dip | No standard threshold | Days | Brief single-digit pullback |
| Correction | 10% to 20% | Weeks to months | S&P 500, down 18.9% (Feb to Apr 2025) |
| Bear market | 20% or more | Months | S&P 500, down 25.4% (Jan to Oct 2022) |
| Crash | Sharp, no fixed threshold | Days to weeks | S&P 500, down about 34% (Feb to March 2020) |
Source: Yardeni Research
Conclusion: Building a Strategy That Performs in Any Market
The direction of the market matters less than the consistency of the investor's approach. The sharp swings that unsettle those new to the market become manageable with clear definitions, evidence over emotion, and allocation tied to personal goals. Bull and bear markets both pass, and a disciplined plan carries through each. Investors and traders comparing exposure across rising and falling markets can review stock indices and educational material on the Libertex platform.
Frequently Asked Questions
How Can Investors Remember the Difference Between Bullish and Bearish?
A bull market rises, mirroring a charging bull's upward horns, while a bear market falls, echoing a bear's downward swipe. The formal markers are a 20% gain from a recent low for a bull market and a 20% decline from a recent high for a bear market.
What Are the Key Differences Between Bullish and Bearish Markets?
A bullish market shows rising prices, optimism, and rising demand, typically alongside economic expansion. A bearish market shows falling prices, pessimism, and selling, often before a slowdown. Historically, a median 87% gain in bull markets contrasts with a median 33% drop in bear markets.
What Does It Mean to Be Bullish on a Stock or Market?
Being bullish means an investor expects prices to rise and positions for gains. A bull market is confirmed by a 20% advance from a recent low, using benchmarks such as the S&P 500. The 2009 to 2020 bull market lifted the index about 400%.
What Does It Mean to Be Bearish on a Stock or Market?
Being bearish means an investor expects prices to fall and positions defensively. A bear market is confirmed by a 20% decline from a recent high. In the 2007 to 2009 bear market, the S&P 500 fell about 57% before it recovered.
How Can an Investor Determine Whether the Current Market Is Bullish or Bearish?
An investor gauges direction using the 20% rule against a recent high or low, plus indicators such as the Cboe Volatility Index, the put/call ratio, and moving-average crossovers like the golden cross. No single indicator is decisive on its own.
Is It Better to Invest During a Bullish or Bearish Market?
Neither is inherently better, and each suits different approaches. Historically, missing the S&P 500's 10 strongest days over 30 years cut returns roughly in half, which is why staying invested across cycles, rather than timing entries, is a common long-term approach. Past performance is no guarantee of future results.
Disclaimer: This article is provided for educational and informational purposes only. It does not constitute financial or investment advice, independent investment research or a recommendation by Libertex. Any examples, scenarios or forecasts are for illustrative purposes only and should not be relied upon as indicators of future performance. Past performance is not a reliable indicator of future results.
Why trade with Libertex?
- Get access to a free demo account free of charge.
- Enjoy technical support from an operator 5 days a week, from 9 a.m. to 9 p.m. (Central European Standard Time).
- Use a multiplier of up to 1:30 (for retail clients).
- Operate on a platform for any device: Libertex and MetaTrader.