
Fundamental Analysis: A Perfect Tool for Every Market
Prepared by the Libertex team
Content reviewed internally in accordance with regulatory standards.
There are two main types of market analysis: fundamental and technical. Although fundamental analysis is not so complicated a method to predict market moves, there are features you should learn about. An essential feature of fundamental analysis is that it differs in every market. Let's find out what fundamental analysis is.
Fundamental Analysis: Definition
Fundamental analysis evaluates the intrinsic value of an asset by considering macroeconomic and microeconomic factors that impact the price. The main idea of fundamental analysis is to define whether an asset is undervalued or overvalued. This form of analysis is widely used for stocks and currencies.
Fundamental analysis is mostly used for stocks and forex. However, it can be applied to any
This analysis method includes such tools as news, economic events, financial statements, industry trends and more, depending on the market you're analysing. Let's discuss the differences in more detail.
Fundamental Analysis and Stocks
We'll start with the stock analysis. It doesn't matter if you buy real shares or trade CFD; the fundamental factors that affect the stock price are the same.
Quantitative and Qualitative Factors
The stock fundamental analysis covers a wide range of tools: From a balance sheet and a company's revenue to something more specific, such as market sentiment or the quality of a company's management.
That's why all of the tools were separated into two groups: Quantitative and qualitative:
- Quantitative analysis is the type of analysis based on complex mathematical and statistical modelling. Examples: Revenue and profit.
- Qualitative analysis is the type of analysis based on the quality of something. It's something that doesn't relate to numbers. Examples: Quality of a company's management, brand-name recognition.
Stock Analysis: Tools
Financial statements are a core of quantitative analysis as the company discloses information on business performance. There are three relevant financial statements you can evaluate before you invest in the company:
- Balance sheet. It's a record of a company's assets, liabilities and shares at a certain point in time.
- Income state. It evaluates a company's performance over a specific period of time.
- Statement of cash flows. The report shows the inflows and outflows of cash for a specified period.
Qualitative tools include intangible factors that can't be calculated with numbers but are still significant to understanding a company's state.
- Management. If you want to consider this factor, you can go to the company's website and check the names and backgrounds of the top management. When you know the names of the senior management, you can freely find news about them on the Internet.
- Business model. Before you invest in the company, you should analyse what business it's involved in, whether it's direct sales or perhaps just franchise fees.
- Competitive advantage. The company's advantage over other companies determines a company's success. If the company can offer something unique, its value will grow for decades.
- Industry. It's not enough to view the company separately from its industry. The company's market share, the development of the sector, problems, or improvements in the industry will affect the company's well-being.
There's an opinion that management is the most important qualitative factor of fundamental analysis. It can be true because leaders determine how the company will develop. If one of the leaders is involved in a scandal, fired or has a severe disease, the company's stocks will depreciate immediately.
Fundamental Analysis and CFD
The concept may sound complicated at first. However, when trading CFD, you don't have to analyse all of these complicated financial statements. Check the list of the essential tools that will determine the CFD stock direction.
Earnings
It's clear that the company's value (its shares) directly depends on the amount the company earns. The company's profit reflects its financial health.
Where to follow: In the US, publicly traded companies are obligated by law to report quarterly earnings.
How to trade: Before the company delivers earnings data, research companies gather analysts' forecasts. All you need to do is check the consensus estimates and follow the actual figures. If the actual data outperform the forecast, the price will go up. In the case of a weak earnings release, it'll fall.
Internal Factors
Above, we mentioned the management factor and its effect on the stock's value. Changes in the CEO, problems and uncertainties of the company, speeches and comments of the company's members and potential mergers and acquisitions create high volatility in the market.
Example: Elon Musk is well-known for his tweets. Once, he tweeted his willingness to take Tesla private at $420. What happened next?Tesla stocks surged, and Nasdaq had to halt them due to the enormous volatility.
Supply and demand can be considered part of this tool. If a company claims its intention to offer more stocks, the price will decline. If the company signals it'll repurchase shares, it'll encourage its price.
Where to follow: It's not that easy to check this metric. However, if you choose the company and learn more about its CEO and social networks, you'll find the necessary information.
How to trade: The crucial thing is to catch the news as soon as possible because its effect usually lasts from 30 minutes to two hours. When you find news, wait for a market reaction, estimate market sentiment and follow the market.
Industry News
Where to follow: Find the news related to the sector of the company you've chosen.
How to trade: First, estimate whether the news is necessary or not and evaluate the impact it may have on the company. Open positions following the market sentiment.
Analyst Ratings
If you fear all these analyses, factors and tools, rely on analysts. Analysts provide recommendations to buy, sell or hold stocks.
Where to follow: You need to find reliable sources of recommendations and check what the analysts say.
How to use: Analysts may provide not only signals but also an in-depth explanation of the forecast, mentioning significant factors that impact the price. Use this information to make your own predictions.
The investment research mostly applies to real stocks.
However, they can also help trade CFD on the price difference, as you can catch the market sentiment. Don't blindly rely on analysts' forecasts. Remember, we all make mistakes. Use the estimates to confirm your projections.
Fundamental Analysis and Cryptocurrencies
Although the cryptocurrency market resembles the forex market, its fundamental tools differ. It's not easy to define fundamental tools that help estimate a cryptocurrency's value:
- Cryptocurrency news. If you've chosen a cryptocurrency you want to trade, you can easily follow the news about it. Cryptocurrency-bank cooperation and cryptocurrency development can be the factors that will increase the value of the asset.
- Industry news. Every time a government restricts a cryptocurrency, its value decreases. If the legislation relates to core cryptocurrencies such as Bitcoin, Ethereum, Litecoin and Dash, the effect may spread to the whole crypto industry.
Cryptocurrencies have existed for several years, but the legislation is still unclear. Many countries continue banning cryptocurrency usage. However, some countries implement crypto into the state financial system.
Where to follow: Find reliable resources that post information about the crypto world.
How to trade: Read the news and evaluate its effect on the asset. Follow market sentiment.
Fundamental Analysis and Forex
Forex fundamental analysis might be easier than the stock one as forex trading. Forex fundamental analysis doesn't require checking financial statements or learning about the CEO.
Forex fundamental analysis might be easier than the stock one, as forex trading.
Economic Indicators:
There are many economic releases you can follow to predict the currency value. The importance of the indicator depends on the country whose currency you're trading. For example, trade balance data highly affects the value of the Canadian dollar but doesn't have a strong impact on the British pound. We grouped the economic indicators and mentioned only the most important ones.
|
Indicator |
Economic release |
|
Output |
GDP, retail sales |
|
Sentiment |
Business and consumer sentiment |
|
Labour market |
Unemployment rate, payrolls, employment change, unemployment claims |
|
Inflation |
CPI, PPI, WPI, RPI |
|
Trade balance |
Trade balance |
Where to follow: Each economic indicator is published in the economic calendars, which are freely accessible on the Internet.
How to use: There are always three figures: previous data, forecast and actual data. If you plan to trade before the data is published, check the previous data and forecast. If the estimate is better than the previous data, it's more likely the currency will appreciate before the data is out. If you plan to trade on the economic release, check the forecast and the actual data. If the actual figure outperforms the estimates, the currency will rise. If it's worse than the forecast, the currency will decline.
The effect of the economic release (specifically how long it stays in effect) depends on many factors, such as whole market sentiment, the strength of the paired currency, and the difference between the forecast and previous/actual data. If you trade before the release, the asset starts appreciating within two hours before the release. If you trade after the event, the event's effect lasts from 30 minutes to two hours.
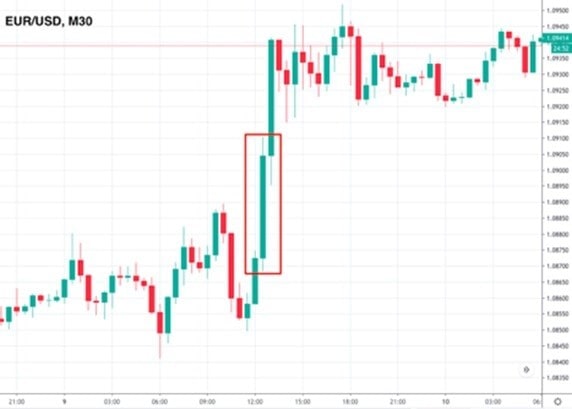
On 9 April 2020, the US released the number of initial jobless claims. Analysts predicted a smaller number of claims compared to the previous release. However, the actual data was worse than the estimation. As a result, the EUR/USD pair rose significantly at the time of the release (12:30 UTC) and continued rising within the next hour.
Central Bank Monetary Policy
The central bank's monetary policy is a vast topic. However, you only need to know a few things about it.
Where to follow: Central bank meetings are placed in the economic calendar.
How to use: The central bank can either change the interest rate or keep it on hold but give comments regarding the decision. If the bank cuts the interest rate, the currency depreciates. If the bank raises the rate, the currency appreciates. If there's no change to the rate, the bank's comments determine the asset's direction. If the bank sounds optimistic (hawkish), the currency rises. If the bank's mood is negative (dovish), the currency depreciates. Apply the same rules of previous/actual data and forecast the interest rate data.
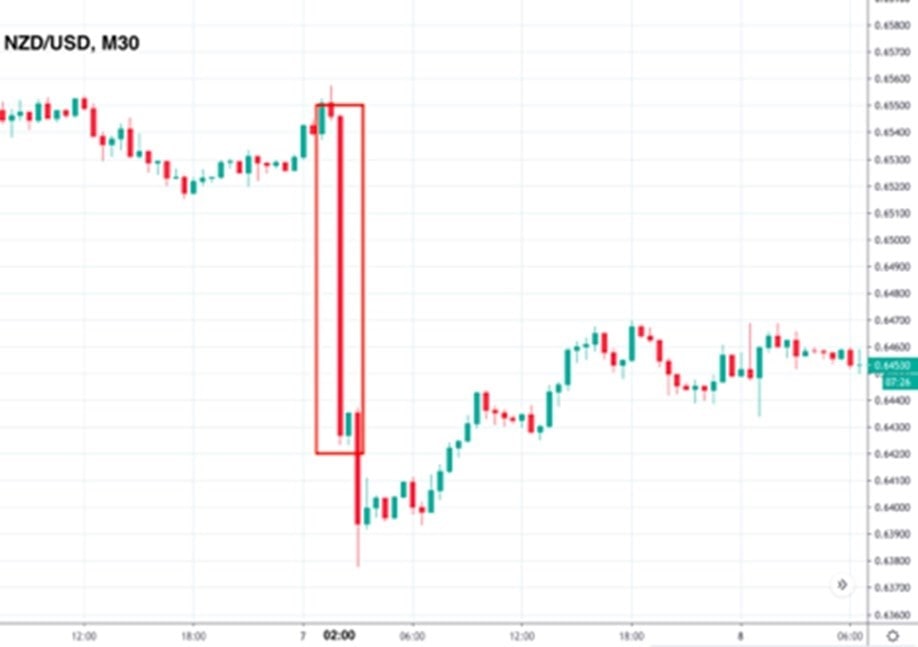
On 7 August 2019, the Reserve Bank of New Zealand cut the interest rate by 50bp against the 25bp expected. As a result, the NZD/USD pair plunged within the first 30 minutes after the release by more than 120 pips.
News
It's the most challenging tool to use for market predictions. All you can do is be ready when news happens and creates high volatility. News can be predictable and unpredictable. Predictable news is international body meetings, referendums and elections. Unpredictable news is tweets of Mr Trump, unscheduled meetings and announcements.
Where to follow: The only option is to read the news and stay up-to-date.
How to use: It's better to avoid trading on news as it's the most unpredictable thing in the market. If you know a meeting or announcement with an unpredictable outcome is scheduled, close all of your trading related to the asset that can be affected. In terms of unpredictable news, there's no opportunity to prepare.
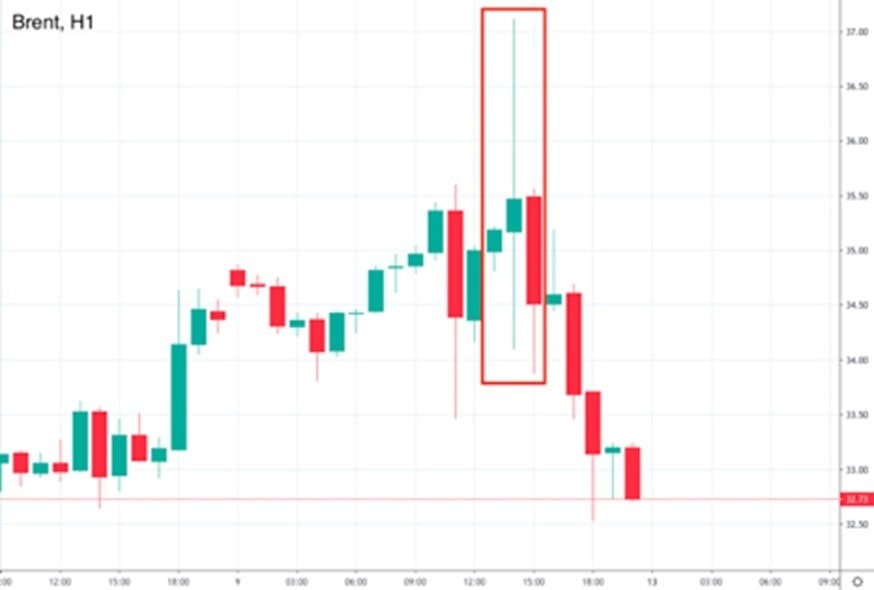
On 9 April 2020, OPEC and invited countries, including Russia, discussed the oil output cuts. Within the first hour of the meeting, Reuters announced Russia and Saudi Arabia were ready to cut the oil production by 20 mb/d. It was a higher cut than expected. Thus, Brent surged. However, the information wasn't confirmed. Later, countries agreed on a 10 mb/d shortage. Brent price formed a candlestick with long upper and lower shadows, signalling enormous volatility.
Market Sentiment
Market sentiment isn't a tool of fundamental analysis. However, it's a big part of it. The market sentiment reflects traders' attitudes towards an asset. An asset's direction is formed by the willingness of traders to buy or sell. Market sentiment combines both fundamental and technical analysis.
When we say to follow market sentiment, it means you should understand what the most significant part of the market thinks about the security and trade in the direction this part has chosen.
Fundamental vs Technical analysis
It's a never-ending debate, and you won't find a perfect answer. There are two main groups of traders, fundamentalists and technicians, and we recommend not separating these types but combining them. Check the table to compare.
To boost your potential profit, combine fundamental and technical analysis.
|
Technical analysis |
Fundamental analysis |
|
|
Concept |
Uses technical indicators and chart patterns to analyse previous market movements and predict the future direction. |
Uses macro- and microeconomic factors to determine whether the asset is over-/undervalued. |
|
How to follow |
Price chart with patterns and technical indicators |
Economic data, news |
|
Signals |
Technical indicators and patterns provide entry and exit signals. |
Buy when the asset is undervalued; sell when the asset is overvalued. |
|
Period |
Small timeframes from one minute to one day |
Big timeframes from daily to monthly |
|
Trader type |
Short-term traders (usually intraday trading) |
Long-term traders |
Fundamental analysis also requires practice. Use a demo account at Libertex and apply your knowledge. A wide range of assets available on the demo account will give you a chance to implement fundamental tools for every market we mentioned today.
Disclaimer: The information in this article is not intended to be and does not constitute investment advice or any other form of advice or recommendation of any sort offered or endorsed by Libertex. Past performance does not guarantee future results.
Why trade with Libertex?
- Get access to a free demo account free of charge.
- Enjoy technical support from an operator 5 days a week, from 9 a.m. to 9 p.m. (Central European Standard Time).
- Use a multiplier of up to 1:30 (for retail clients).
- Operate on a platform for any device: Libertex and MetaTrader.