

Chainlink Price Prediction 2026: Is LINK on Track for a Bull Rally?
Prepared by the Libertex team
Content reviewed internally in accordance with regulatory standards.
Chainlink (LINK) is trading at approximately $8.83 as of June 2026 – well below its all-time high of $52.88 reached in May 2021, yet supported by accelerating institutional adoption of its Cross-Chain Interoperability Protocol (CCIP) and growing demand for decentralised oracle infrastructure. Short-term technicals remain bearish, with LINK trading below both the 50-day and 200-day simple moving averages, while long-term fundamentals continue to strengthen through integrations with DTCC, JPMorgan, and UBS.
In this article, you will find the Chainlink price prediction for the near term – 2026 and 2027 – as well as what a LINK price forecast for the longer horizon through 2030 might look like. To avoid focusing on historical price data alone, we will examine the fundamental factors and key drivers that influence LINK's value. Traders looking to gain exposure to Chainlink without holding the underlying asset can do so through CFDs on the user-friendly, award-winning Libertex platform, a Stock and CFD Broker operating since 2012 and accepting clients from the EEA and Switzerland.
Key Takeaways
- According to DigitalCoinPrice, LINK is forecast to trade between $6.67 and $7.34 through the remainder of 2026, closing the year at approximately $7.13 – a potential change of –19.3% from current levels.
- DigitalCoinPrice projects LINK to range from $5.11 to $7.10 across 2027, with an average price of approximately $5.61.
- CoinPriceForecast estimates LINK at $11.35 mid-2030 and $12.37 by end-2030, representing a potential gain of approximately 40% from current price levels.
- Coinpreis projects LINK to reach $8.88 at mid-2030 and $9.68 by end-2030, with a total change of approximately +10% relative to today's price.
- LINK's all-time high stands at $52.88 (May 2021). A return to that level from current prices would represent approximately a 6x move, underscoring the potential upside implied by long-term institutional adoption scenarios.
- Short-term technicals are bearish – LINK trades below both the 50-day and 200-day SMAs – while long-term fundamentals remain constructive, anchored by CCIP institutional integrations with DTCC, JPMorgan Kinexys, and the Bitwise CLNK ETF listing on NYSE Arca in January 2026.
Recent Updates
- LINK trades at approximately $8.83 as of 25 June 2026; 30-day change: approximately –19% over the past 30 days; 24-hr trading volume: $245 million; market capitalisation: $5.6 billion; ranked #17 on CoinMarketCap.
- The Depository Trust and Clearing Corporation (DTCC) announced integration of Chainlink's Runtime Environment and data standards into its Collateral AppChain platform, targeting production launch in Q4 2026. The integration supports near real-time pricing and collateral settlement across traditional and blockchain markets.
- Chainlink deployed CCIP on Creditcoin, Neo X, and Tempo, and launched Data Streams on the Robinhood Chain testnet, expanding cross-chain interoperability coverage across new blockchain ecosystems.
- The Bitwise Chainlink ETF (ticker: CLNK) was listed on NYSE Arca in January 2026, enabling exposure to LINK through 401(k) and IRA accounts, a structural change in the investor base available to the asset.
Chainlink Price Prediction 2026
According to DigitalCoinPrice, LINK is forecast to trade in the range of $6.67–$7.34 through the remainder of 2026, with a projected year-end close near $7.13, implying a potential change of –19.3% from current price levels. The forecast reflects continued consolidation amid bearish short-term momentum, with a modest recovery trajectory into Q4 2026.
| Month | Min Price, USD | Average Price, USD | Max Price, USD | Change, % |
| June 2026 | 7.3424 | 7.3424 | 7.3424 | -0.76 |
| July 2026 | 6.6716 | 6.8974 | 7.1232 | -6.78 |
| August 2026 | 7.0591 | 7.0591 | 7.0591 | -4.59 |
| September 2026 | 6.7546 | 6.7995 | 6.8443 | -8.1 |
| October 2026 | 7.1648 | 7.2498 | 7.3348 | -2.01 |
| November 2026 | 6.8728 | 6.8728 | 6.8728 | -7.11 |
| December 2026 | 7.0847 | 7.1293 | 7.1739 | -3.64 |
Source: DigitalCoinPrice (25.06.2026)
Chainlink Price Prediction 2027
According to DigitalCoinPrice, the LINK price forecast for 2027 shows the following monthly development.
| Month | Min Price, USD | Average Price, USD | Max Price, USD | Change, % |
| January 2027 | 7.0397 | 7.0677 | 7.0958 | -4.47 |
| February 2027 | 6.5658 | 6.5658 | 6.5658 | -11.26 |
| March 2027 | 6.7449 | 6.8051 | 6.8652 | -8.02 |
| April 2027 | 5.5604 | 6.1753 | 6.7901 | -16.54 |
| May 2027 | 5.8527 | 5.8527 | 5.8527 | -20.9 |
| June 2027 | 5.458 | 5.6559 | 5.8538 | -23.56 |
| July 2027 | 5.1855 | 5.3388 | 5.492 | -27.84 |
| August 2027 | 5.2134 | 5.2867 | 5.36 | -28.55 |
| September 2027 | 5.836 | 5.836 | 5.836 | -21.12 |
| October 2027 | 5.2925 | 5.455 | 5.6174 | -26.27 |
| November 2027 | 5.1114 | 5.4838 | 5.8563 | -25.88 |
| December 2027 | 5.6061 | 5.6061 | 5.6061 | -24.23 |
Source: DigitalCoinPrice (25.06.2026)
Chainlink Price Forecast 2026–2030
According to CoinPriceForecast, the long-term LINK price projection through 2030 shows the following development, with prices expected to reach $11.35 at mid-2030 and $12.37 by year-end 2030, a potential gain of approximately 40% from current levels.
| Year | Mid-Year, USD | Year-End, USD | Change, % |
| 2026 | 7.92 | 8.25 | 12 |
| 2027 | 8.85 | 9.44 | 28 |
| 2028 | 10.11 | 11.63 | 58 |
| 2029 | 10.92 | 10.65 | 44 |
| 2030 | 11.35 | 12.37 | 68 |
Source: CoinPriceForecast (25.06.2026)
Chainlink Price Forecast 2026–2030 – Coinpreis
According to Coinpreis, the long-term LINK price forecast through 2030 shows the following development, projecting a price of $8.88 at mid-2030 and $9.68 by year-end, representing a potential change of approximately +10% from today's level.
| Year | Mid-Year, USD | Year-End, USD | Change, % |
| 2026 | 6.98 | 7.32 | 10 |
| 2027 | 7.86 | 8.41 | 27 |
| 2028 | 8.99 | 10.34 | 56 |
| 2029 | 9.33 | 8.33 | 26 |
| 2030 | 8.88 | 9.68 | 46 |
Source: Coinpreis (25.06.2026)
Chainlink (LINK) Technical Analysis
The current technical picture for LINK/USD is broadly bearish on all major timeframes. LINK trades below both the 50-day and 200-day simple moving averages, while the RSI sits in bearish-neutral territory at 40.31, well above the oversold threshold of 30. The combined oscillator reading leans bearish, though extreme fear readings in the broader market have historically preceded recoveries in quality infrastructure tokens.
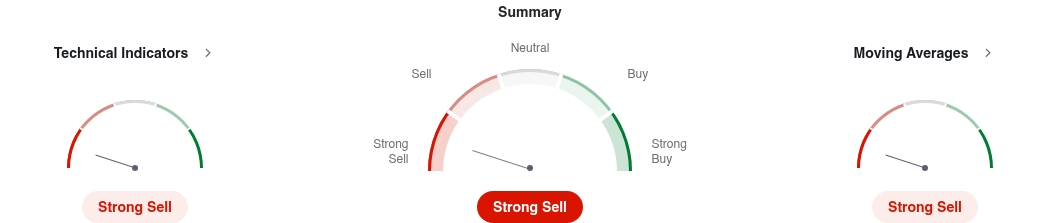
Technical Indicators
| Indicator | Value | Signal |
| RSI(14) | 40.31 | Sell |
| STOCH(9,6) | 9.414 | Oversold |
| STOCHRSI(14) | 0 | Oversold |
| MACD(12,26) | -1.06 | Sell |
| ADX(14) | 25.16 | Sell |
| Williams %R | -97.47 | Oversold |
| CCI(14) | -105.56 | Sell |
| ATR(14) | 5.3768 | Less Volatility |
| Highs/Lows(14) | -3.3899 | Sell |
| Ultimate Oscillator | 33.66 | Sell |
| ROC | -47.34 | Sell |
| Bull/Bear Power(13) | -6.9925 | Sell |
Source: Investing (25.06.2026)
Moving Averages
| MA | Simple Value | Signal | Exponential Value | Signal |
| MA5 | 8.68 | Sell | 9.18 | Sell |
| MA10 | 11.71 | Sell | 10.87 | Sell |
| MA20 | 14.57 | Sell | 12.39 | Sell |
| MA50 | 11.98 | Sell | 12.44 | Sell |
| MA100 | 10.87 | Sell | 10.83 | Sell |
| MA200 | 5.44 | Buy | 7.71 | Sell |
Source: Investing (25.06.2026)
Pivot Points
| S3 | S2 | S1 | Pivot | R1 | R2 | R3 | |
| Classic | 6.28 | 7.54 | 8.35 | 9.61 | 10.42 | 11.68 | 12.49 |
| Fibonacci | 7.54 | 8.33 | 8.82 | 9.61 | 10.4 | 10.89 | 11.68 |
| Camarilla | 8.58 | 8.77 | 8.96 | 9.61 | 9.34 | 9.53 | 9.72 |
| Woodie | 6.04 | 7.42 | 8.11 | 9.49 | 10.18 | 11.56 | 12.25 |
| DeMark | - | - | 8.98 | 9.92 | 11.04 | - | - |
Source: Investing (25.06.2026)
What Is Chainlink (LINK)?
Chainlink is the leading decentralised oracle network, built on Ethereum, that connects off-chain data sources – including APIs, real-world data feeds, and payment systems – to on-chain smart contracts. Its Cross-Chain Interoperability Protocol (CCIP) additionally enables secure messaging and token transfers across different blockchain networks, making Chainlink a core piece of infrastructure for both decentralised finance and institutional blockchain applications.
The Chainlink network launched in 2017, with its first version going live in June and the white paper by Steve Ellis and Sergey Nazarov published in September of that year. The LINK token serves two primary functions: compensating node operators who provide oracle services, and enabling staking to incentivise reliable data reporting.
How Does Chainlink Work?
The following process facilitates communication between blockchain-based smart contracts and external data sources:
- Oracle Selection: A user defines parameters that form a Service Level Agreement (SLA). After submitting the SLA and depositing LINK in an Order-Matching contract, oracles are selected based on the requirements.
- Data Reporting: The selected off-chain oracles connect with external data sources to execute the agreement and report results on-chain via the Chainlink service.
- Result Aggregation: Oracles validate the data, return results to the main contract, and an aggregation contract calculates the weighted answer before delivering it to the requesting smart contract.
LINK Token Supply
- Maximum supply: 1,000,000,000 LINK (fixed)
- Circulating supply: approximately 727,100,000 LINK (verify at time of writing)
- Staking lock-ups reduce liquid supply, creating structural demand pressure as oracle service adoption grows
What Drives Chainlink's Price?
Beyond broader cryptocurrency market conditions, several Chainlink-specific factors have a direct and measurable influence on LINK's price trajectory.
Oracle Services and Smart Contract Adoption
Smart contracts are only as reliable as the data fed into them. Chainlink solves the oracle problem – the gap between blockchains and real-world data – making it foundational infrastructure for DeFi, tokenised assets, and institutional blockchain applications. The network currently supports over $28 trillion in total value secured across DeFi, derivatives, gaming, and institutional finance, with CCIP processing approximately $18 billion in cross-chain transaction volume monthly. Each new integration increases oracle service demand, which feeds directly into LINK token utility.
Institutional Adoption and Tokenised Finance
The Depository Trust and Clearing Corporation (DTCC) announced integration of Chainlink's Runtime Environment into its Collateral AppChain platform, targeting production in Q4 2026, enabling near real-time collateral pricing and settlement across traditional and blockchain markets. JPMorgan's Kinexys division has connected with Ondo Finance via Chainlink's CCIP Runtime Environment for atomic settlements. UBS has conducted pilots using Chainlink oracle infrastructure for tokenised asset workflows. The Bitwise Chainlink ETF (CLNK), listed on NYSE Arca in January 2026, broadened LINK's investor base to include 401(k) and IRA accounts – a structural shift in the type of capital that can now access the asset.
Bitcoin Halving Cycle and Altcoin Market Dynamics
Bitcoin's April 2024 halving reduced new BTC supply, historically triggering a price appreciation cycle followed by capital rotation into quality altcoins approximately 12–18 months later. In the 2020–2021 cycle following the May 2020 halving, LINK surged from under $5 to over $52 – a move driven by both the post-halving altcoin rotation and the DeFi ecosystem boom. As of mid-2026, the market sits within the window that historically corresponds to accelerating altcoin momentum, though this is historical context, not a prediction.
Chainlink Price History
LINK's price has followed a distinct cycle-driven pattern since its 2017 launch. Key milestones include the 2019 breakout driven by Google's Cloud partnership announcement, the 2020 DeFi boom that carried LINK from below $2 to $19.09 in August, and the all-time high of $52.88 reached in May 2021. The subsequent bear market brought LINK back to approximately $7 by mid-2022, where it consolidated through 2023 before recovering to $13–14 in early 2026 and correcting to the current approximately $8.83 range.
| Year | Event | Price Level, $ | Key Driver |
| 2017 | ICO launch | $0.09–$0.11 | Token sale (114,285 ETH raised) |
| 2018 | First ATH, then correction | $1.51 → $0.16 | Broader bear market |
| 2019 | Google Cloud partnership; Coinbase listing | $1 → $4.30 | Ecosystem credibility, exchange access |
| 2020 | DeFi boom; August ATH | $2 → $19.09 | DeFi protocol integrations; post-halving rotation |
| 2021 | All-time high | $52.88 (May) | Crypto bull cycle peak; DeFi + NFT momentum |
| 2022–2023 | Bear market consolidation | $7–$13 | Macro tightening; crypto sector deleveraging |
| Jan 2026 | Post-halving recovery | $13–$14 | BTC halving cycle, ETF flows |
| Jun 2026 | Current price | $8.83 | Short-term correction; institutional adoption continues |
Source: CoinMarketCap (25.06.2026)
Is Chainlink a Good Investment?
Chainlink is generally considered a strong long-term infrastructure play due to its dominant position in the oracle sector and accelerating institutional adoption. However, short-term technicals present a challenging entry environment, with LINK trading below both key moving averages.
The assessment varies significantly depending on investment horizon and risk tolerance:
- Short-term perspective: The technical structure is currently bearish – LINK trades below the 50-day and 200-day SMAs, with oscillator readings skewed negative. The RSI reads 40.31 – bearish-neutral but not yet in oversold territory. A confirmed recovery would require a sustained close above the 50-day SMA, supported by volume. Traders can explore LINK price action risk-free using a Libertex demo account before committing capital.
- Long-term perspective: The fundamental case for LINK remains structurally intact, anchored by growing institutional oracle demand, CCIP adoption across major financial institutions, and positioning as infrastructure for the tokenised asset market. CoinPriceForecast and Coinpreis project meaningful appreciation through 2030, though forecasts carry inherent uncertainty.
Trading CFDs on Chainlink with leverage can be risky and can lead to losing all of your invested capital. It is important to conduct thorough research and consult a licensed financial adviser before making any investment decisions.
Expert Opinions on Chainlink's Future Price
Institutional analysts and research firms have provided a range of outlooks on LINK, reflecting divergent views on the pace of DeFi adoption and oracle infrastructure monetisation.
MN Trading
Michael van de Poppe, CEO of MN Trading, has expressed a constructive view on LINK, citing the token's tendency to show strength during periods of Bitcoin underperformance as evidence of growing idiosyncratic demand. His analysis focuses on LINK's positioning in the DeFi infrastructure layer and anticipates meaningful appreciation as CCIP adoption scales: "Recently, we've actually seen strength in the DeFi section, and multiple DeFi protocols have been breaking out, showing strength, through which continuation seems very likely. If DeFi is going to wake up nicely, Chainlink is most likely going to follow through."
Gartner Research
Avivah Litan, VP Analyst at Gartner Research, has maintained a bullish long-term view on LINK, projecting the token to reach approximately $48 by 2030. Her analysis is grounded in Chainlink's positioning as the dominant oracle network at the intersection of traditional finance and blockchain infrastructure – a market she expects to expand materially as asset tokenisation reaches institutional scale.
FAQ
What is the Chainlink (LINK) price prediction for 2026?
According to DigitalCoinPrice, LINK is projected to trade in a range of approximately $6.67 to $7.34 through the remainder of 2026, with a potential year-end close near $7.13. Short-term momentum remains bearish, with price action constrained below key moving average resistance levels.
Will Chainlink reach $100?
Based on current long-term forecasts from CoinPriceForecast and Coinpreis, LINK is not projected to reach $100 within the 2026–2030 window. CoinPriceForecast estimates a year-end 2030 price of $12.37, while Coinpreis projects $9.68. A move to $100 would require LINK's market capitalisation to exceed approximately $73 billion, possible long-term but not the base case for the current forecast cycle.
Is Chainlink a good investment in 2026?
Chainlink's long-term fundamentals remain intact: dominant oracle market share, accelerating institutional CCIP adoption, and positioning in the tokenised asset infrastructure layer. Short-term technicals are challenging, with LINK below both the 50-day and 200-day SMAs. Investors with a longer horizon may view the current correction as an accumulation window. Short-term traders face an unfavourable risk/reward until key technical levels are recovered. All investment decisions should be made after independent research and consultation with a licensed financial adviser.
What is Chainlink's all-time high?
Chainlink's all-time high is $52.88, reached in May 2021 during the peak of the crypto bull cycle. From the current price of approximately $8.83, a return to the ATH would represent a move of approximately 6x.
What factors most influence LINK's price?
The five primary factors influencing LINK's price are: (1) oracle service demand growth driven by DeFi and tokenised asset adoption; (2) institutional CCIP integrations (DTCC, JPMorgan, UBS); (3) Bitcoin halving cycle dynamics and capital rotation into quality altcoins; (4) broader crypto market sentiment and BTC price direction; (5) staking lock-up mechanics reducing liquid supply as node operator participation grows.
What is the Chainlink price prediction for 2030?
CoinPriceForecast projects LINK at $11.35 at mid-2030 and $12.37 by year-end 2030, representing a potential gain of approximately 40% from current levels. Coinpreis estimates $8.88 at mid-2030 and $9.68 at year-end. Both forecasts are based on historical data and adoption assumptions and should not be treated as guaranteed outcomes.
Is now a good time to buy Chainlink?
The current technical picture is bearish. LINK is trading below both the 50-day and 200-day SMAs, and oscillator signals lean strongly negative. Historically, extreme fear market conditions (Fear & Greed Index readings below 25) have preceded significant recoveries in quality infrastructure tokens, but timing the market is inherently uncertain. Any decision to buy should be based on personal research and risk tolerance, not price forecasts alone.
Disclaimer: The information in this article is not intended to be and does not constitute investment advice or any other form of advice or recommendation of any sort offered or endorsed by Libertex. Past performance does not guarantee future results.
Why trade with Libertex?
- Get access to a free demo account free of charge.
- Enjoy technical support from an operator 5 days a week, from 9 a.m. to 9 p.m. (Central European Standard Time).
- Use a multiplier of up to 1:30 (for retail clients).
- Operate on a platform for any device: Libertex and MetaTrader.