What Is a Bull Trap in Trading and How to Deal with It?
Prepared by the Libertex team
Content reviewed internally in accordance with regulatory standards.
Traders face various challenges, including high volatility, unexpected events, wrong signals, risky assets and more. Another one is the bull trap.
The bull trap is a market condition that may cost you a fortune. This article contains a comprehensive explanation of this trading condition, real examples of it and tips on how to avoid it.
What Is a Bull Trap in Trading?
There are many definitions of a bull trap. Here's the easiest one. Every trader, even a beginner, knows that the price turns down near resistance and moves up near support. When the price breaks any of the levels, it's a sign of a strong trend to prevail on the market.
Imagine that the price rises to break above the resistance. What's the first thing you have in mind as an investor? Buying, since the trend looks like it's bullish. However, the price bounces and moves down. Congratulations! You're in a bull trap.
There's an opposite situation when the price rises after breaking past the support line. In this case, you're in a bear trap.
Why Do Traps Occur?
There are several reasons why a bull trap can happen:
- Unexpected market events. Trading is subject to high volatility caused by unexpected events like political events or natural disasters that may lead to rearrangements of market forces.
- Weak bulls. The bull trap on trading appears when bulls lose their force and can't push the price further up. Bulls can be weak due to several reasons. The most common ones are the lack of positive events and a continued uptrend.
- Strong downtrend. If there's a strong downtrend and the price rises within it, the risks of a bull trap increase significantly.
So, the main reason for a bull trap in trading is bulls' weakness that can't push the price further up.
Bull Trap in Trading: Real Examples
Let's take a look at real examples of bull traps.
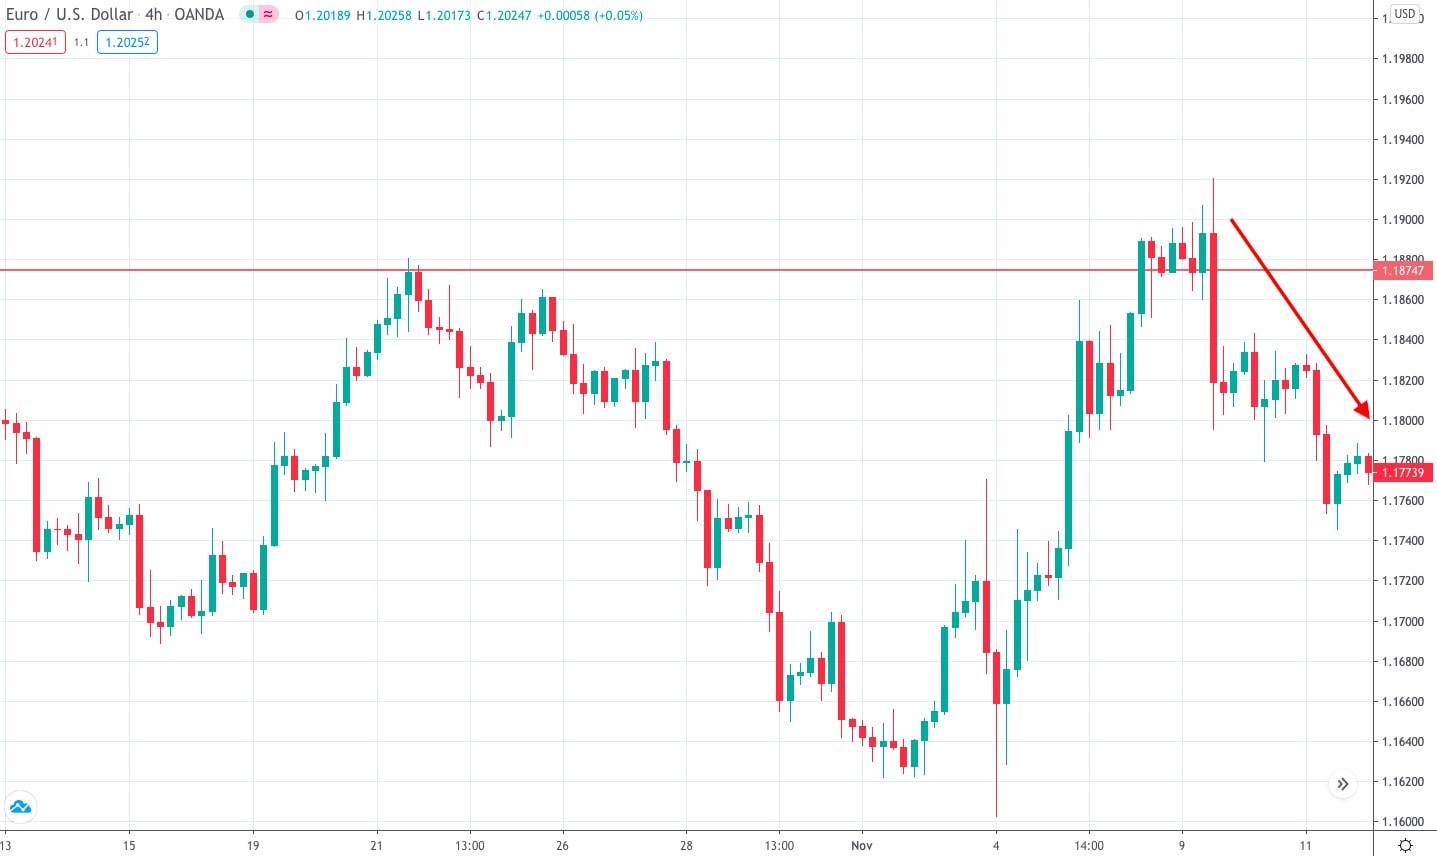
The H4 chart of EUR/USD shows that the price broke above the previous resistance within a strong bullish trend. However, it couldn't stick above it. We can see several retests of the previous resistance level that became a support for the price. After it fell below the support, a new downtrend started forming.
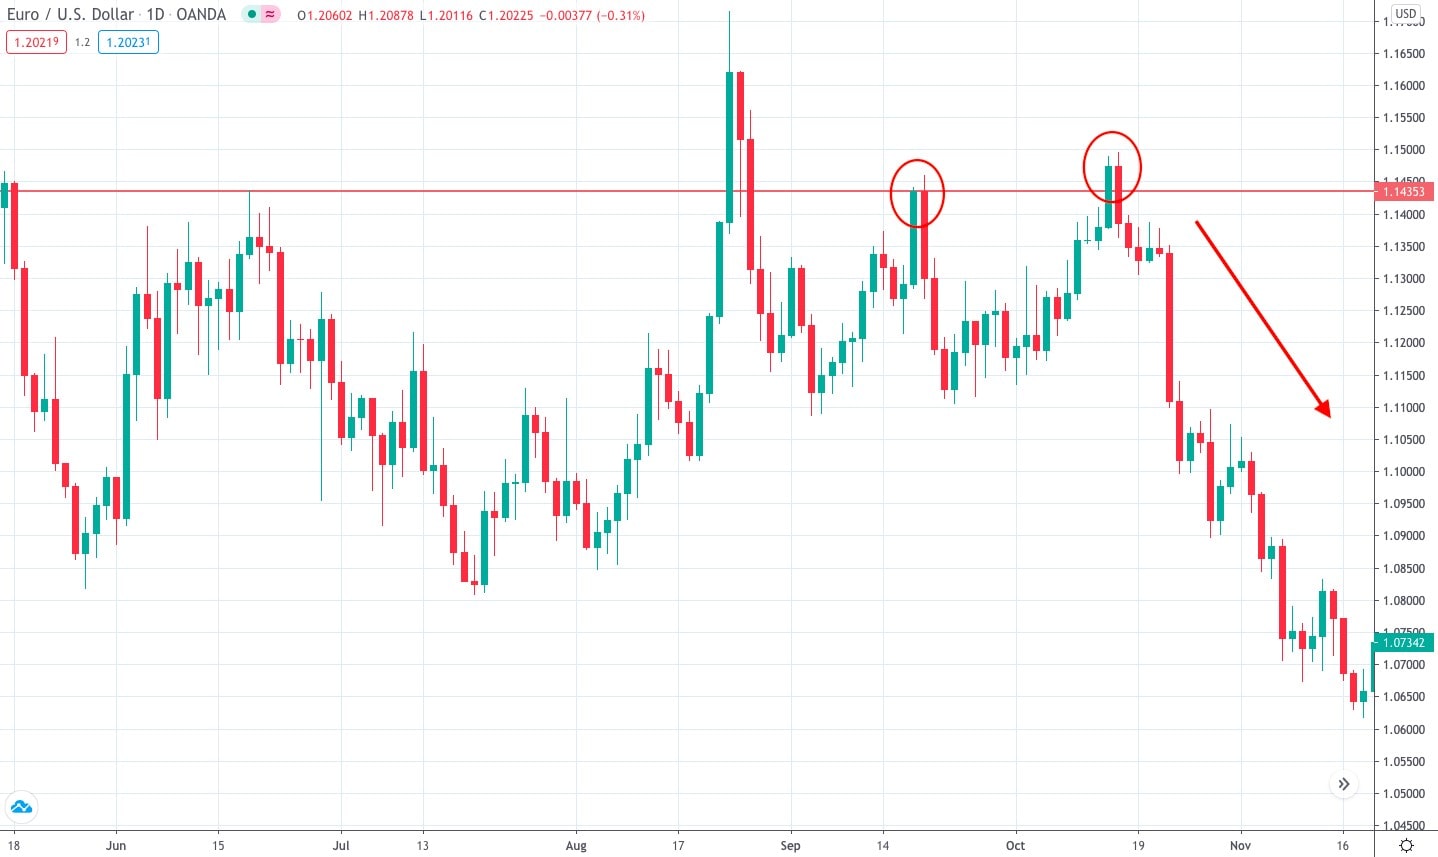
Another example of a bull trap was found on the daily chart of the EUR/USD pair. The price formed a double top pattern and dropped, creating a solid bearish trend. We'll cover the double top pattern later in the article.
A Bull Trap: How to Identify It
So, the bull trap is the pattern that can cause significant losses. Here are our tips to prevent getting into one.
- Check the candlesticks' size. Usually, the price forms a candlestick bigger than the previous one at the final trap step. There's no 100% guarantee that it's a trap since an enormous candlestick can be a signal of bulls' force. Still, be careful and wait for confirmation from patterns or indicators to provide signals of the trend reversal.
- Notice resistance tests. If the price tests the resistance several times in a strong upward trend, it might indicate a price reversal happening soon.
- Define sideways movement. If the price moves horizontally within an uptrend, the uptrend will end soon. When the price breaks higher than the horizontal channel's upper line, stay away from the market to avoid a bull trap.
Bull Trap Chart Patterns
In this part of the article, you'll find additional options to determine the bull trap on the chart, noting specific patterns.
Bearish Engulfing Pattern
It's formed after a bull trap. So, when you see that the price breaks above the resistance and the bearish engulfing pattern appears, it's a downtrend. The signal will be stronger if the bearish engulfing pattern follows the Doji candlestick that signals buyers' uncertainty.
Resistance Retest
If the price rises above the resistance and falls, it's not a 100% signal of the bull trap. It can be just a short-term correction. In this case, wait until the price breaks below the previous resistance (which has become support for the price). If a breakout occurs, the trend is expected to turn bearish. If the price just tests the support (previous resistance) and keeps growing, it's not a classic bull trap.
Double Top Pattern
One of the easiest patterns, a double top pattern, is formed before a bearish trend. The price touches the resistance twice, forming two tops, then declines.
The price should break above the resistance at the second top and then turn around in the event of a bull trap. In both a bull trap and a classic double top pattern, the price is supposed to decline.
How to Avoid Bull Traps
You should avoid bull traps because you risk losing money. We've gathered the most efficient methods to help you deal with this situation.
Method #1. Measure Volume
If you've never heard about the Volumes indicator, it's high time to learn about it. It may rarely provide trading signals, but this instrument is widely used by traders.
Apply the indicator on the price chart and see if the volume is high on the resistance breakout. If it's significant, it's a sign of a strong uptrend. If the volume is low, there are risks of the trend reversal.
Method #2. Follow Candlesticks
There's a well-known candlestick that indicates market uncertainties, a Doji candlestick. If a Doji candlestick follows the breakout, the odds are a downward movement will take place since market participants are uncertain about the upcoming price direction.
Method #3. Be Careful with Pending Orders
The idea of the Buy Stop pending order is to open a trade when the price breaks above a certain level and keeps growing. It's usually put at the resistance level. Place the Buy Stop above the resistance level to be sure the price will increase.
Method #4. Learn How to Identify Traps Ahead of Time
If you missed the part about identifying bull traps, get back to it and practice on a Libertex demo account.
Method #5. Don't Enter Late
A bull trap indicates the end of an uptrend. Don't open a long position if you see that the price has been trading up for an extended period. The period depends on the timeframe you trade on. Remember that a trend isn't constant.
How to Trade Bull Traps: Top Strategies
Traders should take time and wait until the patterns confirm upward movement above the resistance level. The only disadvantage in avoiding trades is that you could miss the perfect entry point if the situation turns out to be a sustained bullish trend rather than a bull trap.
That's why we want to share some ideas on how to trade bull traps if you don't want to stay away from the market when the price breaks above the resistance.
Strategy #1. Short
The best feature of trading is that you can both buy and sell, whether you own the asset or not. When the bull trap occurs, it's time to open a short position. Wait until the market confirms the downtrend and sell.
When doing this, it's vital to be sure a bearish trend is forming. To do that, follow these steps:
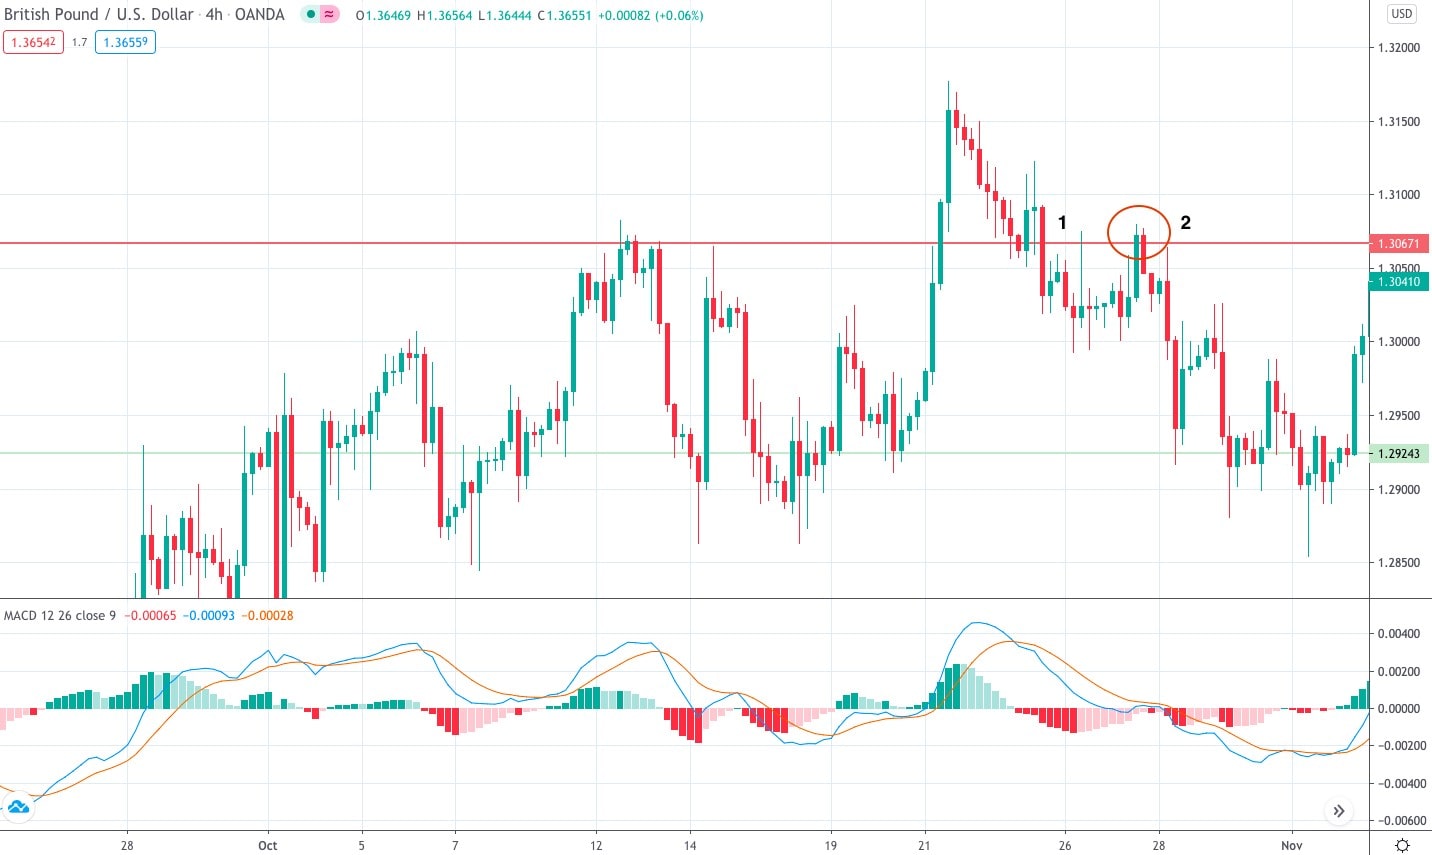
- If the price breaks below the previous resistance level, it's an excellent point to consider a short trade (1).
- Wait until the price tests the previous resistance after the trap. If the resistance isn't broken, it's the first sign of a strong downtrend (2).
- Another confirmation is candlestick patterns, for instance, bearish engulfing, Awesome Oscillator or MACD indicators. RSI is also useful if you trade on big timeframes. For small timeframes, this indicator could provide false signals.
- This strategy works for a strong downtrend. That's why a Take-Profit order can be placed far from the entry point. To do this, use Trailing Take-Profit orders.
- A Stop-Loss order should be placed slightly above the previous support level.
Strategy #2. When Resistance Turns Into Support
This strategy partially relates to bull traps since it's not formed on a strong downtrend but a temporary price decline.
Another strategy is to buy when the price tests the support level that used to be the resistance. Imagine the price breaking above the resistance but declining. It doesn't slide below the previous resistance that has already become the support, which means the trend is still strong, so you can easily buy.
Strategy steps:
- Wait until the price breaks above the resistance and moves downward (1).
- The price should not fall significantly below the previous resistance. Even if it breaks below, it's vital it turns around fast (2).
- It's better if the price retests the support (previous resistance) at least two times. If it does, it means an uptrend is in force.
- You can go long after the second retest and the formation of a strong bullish candlestick.
- A Take-Profit order should be placed at the previous top. If the price breaks above this level, you can keep the position open using a Trailing Take-Profit until the next previous top.
- A Stop-Loss order should be placed slightly below the support (previous resistance).

Conclusion
A bull trap is a harmful pattern for traders, but you can use it in your favour. To do so, identify it ahead of time and avoid entering the market if there's any sign of its formation.
It's not easy to identify bull traps on a price chart. A mistake could either lead to you losing money or a missed opportunity to enter the market at a reasonable price. That's why you should practice daily.
The best option is to open a demo account. A Libertex demo account allows traders to open positions on various CFDs instruments at real-market conditions but with zero chance of losing their own funds. With a demo account, you'll gain the skills you need to help you on your future trading journey.
It's time to summarise what we've covered here.
FAQ
What Does A Bull Trap Mean in Trading?
A bull trap is a situation when the price breaks above the resistance, seeming to signal a strong uptrend but then reverses and declines.
Is the Market in a Bull Trap?
It depends on the market. There are plenty of assets, and there are many markets. Conditions differ in each of them.
How Do Trapped Traders Succeed?
Although a bull trap is an unpleasant situation for traders, there's still an opportunity to succeed. Go back to the "How to Trade Bull Traps: Top Strategies" section to learn the best strategies to turn a bull trap in your favour.
What Is a Bull Trap in Crypto?
Bull and bear traps are common market conditions for any asset.
Disclaimer: The information in this article is not intended to be and does not constitute investment advice or any other form of advice or recommendation of any sort offered or endorsed by Libertex. Past performance does not guarantee future results.
Why trade with Libertex?
- Get access to a free demo account free of charge.
- Enjoy technical support from an operator 5 days a week, from 9 a.m. to 9 p.m. (Central European Standard Time).
- Use a multiplier of up to 1:30 (for retail clients).
- Operate on a platform for any device: Libertex and MetaTrader.