Bear Flag Pattern: Trap or Help?
Prepared by the Libertex team
Content reviewed internally in accordance with regulatory standards.
There's a wide range of instruments to determine the market's direction. Chart patterns are the tools that help investors identify the price direction. In this article, we'll discuss a bear flag chart pattern.
A bear flag is a tool with features that can create additional challenges for traders. Here, we'll talk about the bear flag pattern that signals a downside movement with real examples and tips on how to use them to make your trades successful.
Start with the Basics: What Is a Flag?
Chart patterns are divided into two major groups: continuations and reversals. Reversal patterns signal a trend reversal. Continuation patterns occur within a certain price movement and alert traders that the trend will continue.
The flag is a short-term continuation pattern. We call it so because it doesn't last for long. The period of the flag depends on the timeframe you trade. Still, any period will be much shorter than the overall trend.
The flag is a short-term continuation pattern that has two types: bear and bull. The pattern is widely used by traders as it precedes and confirms the continuation of the current trend.
Among plenty of patterns, it's considered to be one of the most reliable ones. Traders like this tool because it can be found in different timeframes and for all trading instruments.
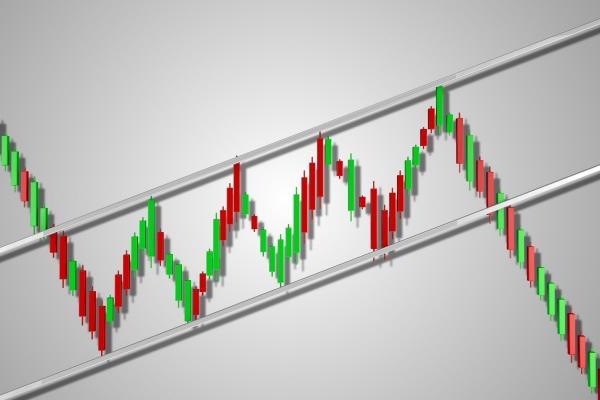
The flag pattern occurs in times of a sharp price movement and is performed by short-term consolidation. This pattern has two types: bull and bear. Look at the picture below.
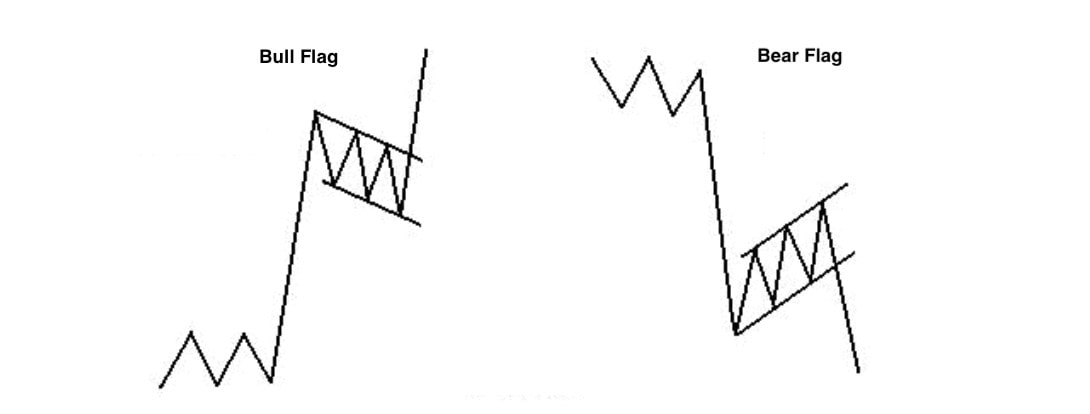
The flag has two parallel trendlines, which work as support and resistance levels. They frame the consolidation. The breakout of these lines confirms the pattern and serves as an entry point for the future position. Sell after the bear flag; if the bull flag appears on the chart, it signals a buying position.
The flag pattern's trading rule is to trade in the direction of the previous trend. Place an order below the support line in the downward trend and above the resistance in the upward trend.
The main rule that applies to both types of flag patterns is to trade in the previous trend direction. Place an order below the support line in a downward trend and above the resistance in an uptrend.
What Is the Bear Flag, and How Does It Work?
Now you know what the flag pattern looks like. Let's talk in-depth about the bear flag pattern.
The bear flag can be drawn in strong downward movement or sell-off circumstances. Imagine the price drops, the consolidation starts, and the candlesticks move within a narrow range. More often, the market starts trading upwards. The trader has doubts whether it's a reversal up or just a short-term consolidation.
In this case, if you identify a bear pattern, you can be sure that it's just a short-term consolidation, and the trend will continue.
If you can draw two parallel lines on the tops and bottoms of candlesticks in consolidation and the figure resembles the flag, it's a bear flag pattern.
The bear flag is a type of flag pattern that occurs within the downtrend. The pattern alerts traders that the market will keep moving in the same direction it followed before the consolidation.
The pattern tells you that the price will keep moving down. Thus, you can open a short position as soon as the price breaks below the flag's bottom line.
Bear Flag Chart Pattern: A Real Example on Forex
Let's consider real examples. The pattern can be easily found on different timeframes and for any trading instrument.
On the daily chart of the USD/JPY pair, we can see a clear bear flag pattern.

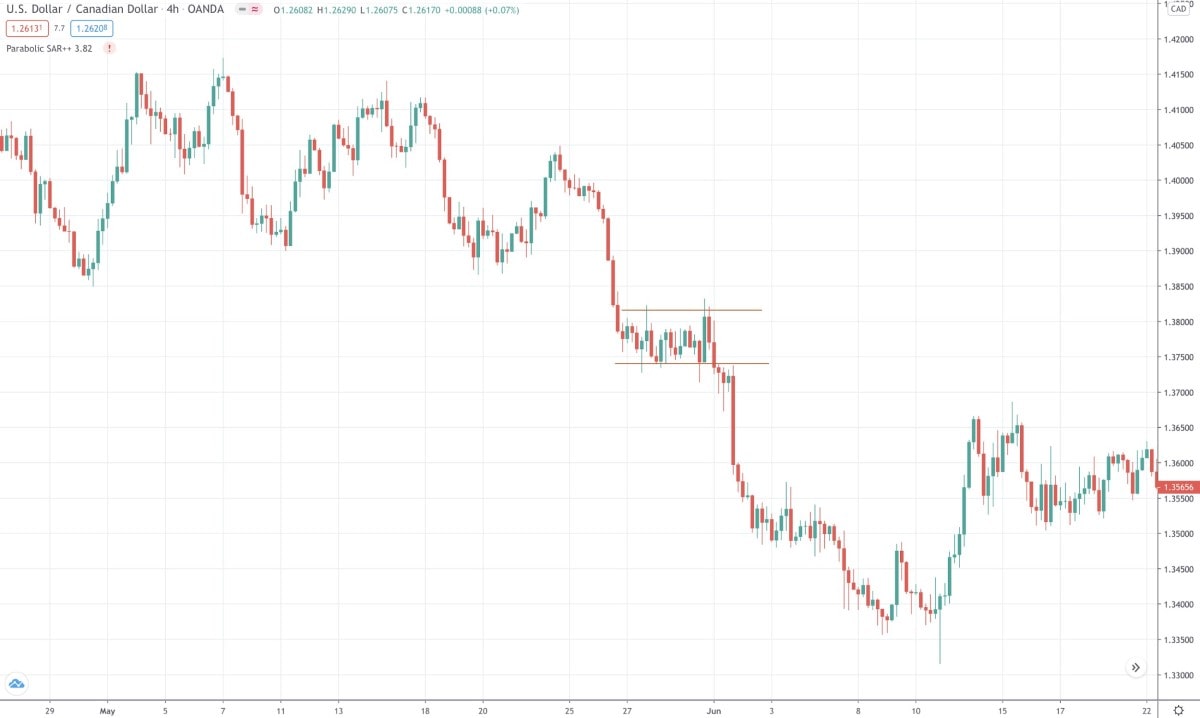
Another example is the USD/CAD pair and its 4-hour timeframe. Here, we can see the horizontal pattern.
Pros and Cons of the Bear Flag Pattern
Like any other instrument, the bear flag has advantages and disadvantages.
Traders use the bear flag pattern to define not only the market's direction and entry and stop levels. It works for any trading asset and at almost any timeframe.
|
Advantages |
Disadvantages |
|
Useful during any timeframe |
Can be difficult for beginners |
|
Provides entry and stop levels |
Rare |
|
Works for any trading instrument |
Not all the bear flags work |
|
Ensures traders the downtrend will continue |
In general, the flag pattern has many benefits for traders. However, it doesn't appear on the price chart often. Also, if you're a newbie, it may be challenging to identify it on the chart.
How to Identify the Bear Flag Pattern
Although the pattern seems simple, the key to a successful trade is to identify it correctly.
- Step 1. The bear flag occurs only in a downtrend. If the price moves sharply down, it's a sign of a possible flag pattern.
- Step 2. The flag is a correction. Wait until the price starts consolidating (in most cases, it'll move up).
- Step 3. Draw parallel lines on the tops and bottoms of the candlesticks that consolidate.
- Step 4. If the figure resembles the flag, it's more likely the bear flag.
- Step 5. The bear flag is fully formed if the price breaks below the support (the bottom line of the pattern).
You can also apply indicators that will provide additional confirmation.
Will Volumes Help?
Volumes are the best indicator to confirm the flag pattern.
It depicts how strong the trend is. A high-volume market in a downtrend means the bears are strong enough to pull the price down. During a consolidation or bear flag pattern, the volumes are supposed to be diminished, meaning the market can't reverse the price. So, expect the price to fall.
Please remember that the bear flag pattern is considered to have formed only after it breaks through its bottom line. You can enter the market by opening a trade in the main trend direction only after that.
The Bear Flag and 50-Period Moving Average
Although the flag pattern can occur, it doesn't mean you should always trade it. So, how do you identify the right bear pattern?
First, to check it, you should wait until the price forms the pattern. Then, it would be best if you implement the Moving Average indicator. The period of the MA will depend on the timeframe you trade. If the distance between the pattern and the Moving Average is big, it's better to avoid trading the pattern. Although the price will move down, it's difficult to define the Take-Profit level as the upward reversal will occur soon.
How to Use a Bear Flag in Trading. The Best Strategies
The flag pattern is a part of various trading strategies. We've gathered the most effective ones.
Strategy #1: The Major One
We'll start with the most common and clear trading strategy.
- Step 1. Look for a strong fall and wait until the decline slows, forming a channel (more likely, an upward channel).
- Step 2. Count the difference between the start and end points of the downward movement (preceding the consolidation). It's your possible Take-Profit target.
- Step 3. Wait until the flag pattern is formed; the price should break below its bottom line.
- Step 4. Open a sell position on the breakout. Place a Stop-Loss above the bottom line (we recommend a distance of 3-10 pips, depending on the timeframe).
- Step 5. Your Take-Profit level should be equal to the difference you counted at the second step. Start counting pips from the entry point.
Remember that the market is subject to high volatility. Many factors affect its direction. Due to different market events, the price may reverse before your Take-Profit is triggered. That's why you can try using a Trailing Take-Profit.
Strategy #2: The Bear Flag Pattern and Fibonacci Retracements
We previously talked about the volumes indicator used to confirm the flag pattern. Our second trading strategy includes another famous tool: Fibonacci retracements.
The Fibonacci retracements help identify the levels where the pullback is anticipated, so the price is anticipated to retrace.
- Step 1. Look for a downtrend.
- Step 2. Wait for a consolidation.
- Step 3. Apply the Fibonacci levels to the chart. They're used to identify reversal points and help determine when the price will continue the downtrend.
- Step 4. Wait until the price reaches the Fibonacci level. It'll signal a possible price reversal and continuation of the fall.
- Step 5. As soon as the price turns around and breaks the bottom line of the flag pattern, you can expect the continuation of the downward movement and enter the market.
Strategy #3: The Bear Flag and Support Breakout
Another trading strategy that traders can use is a support breakout. Here, we'll talk about the previous support rather than the pattern's support.
- Step 1. Check the downtrend. The price should break below the support based on the previous low.
- Step 2. Wait until the price forms the flag pattern.
- Step 3. Apply the Moving Average. The period of the MA should correlate with the timeframe. If you trade on high timeframes, you should apply Moving Averages with the period of 50, 100 or 200. If you prefer lower timeframes, the periods should be smaller, for instance, 9, 12 or 20. If the pattern is close to the MA, you can trade the bear flag.
- Step 4. Wait until the price breaks below the pattern's bottom line. Remember that the flag pattern is confirmed only after the breakout.
- Step 5. Count the distance between the downtrend beginning and the start of the consolidation. Place this amount from the breakout.
- Step 6. A Stop-Loss can be placed above the pattern's bottom line.
Tips for Traders
The pattern may look simple, but you should still be cautious when trading it. Here are some tips for you.
- Tip 1. Wait until the price breaks below the bottom line of the bear flag pattern. Until then, there's no confirmation of the downward movement continuation.
- Tip 2. Find confirmations. Although the pattern signals the market will keep moving down, it also needs proof. Using volumes is one way to be sure it's a flag pattern.
- Tip 3. There's one mistake some traders make. The bear flag pattern looks like a consolidation. During this kind of pattern, the price can move slightly up, so they feel like a price reversal. It's crucial to wait for confirmation.
Conclusion: The Bear Flag: Trade or Not?
To sum up, the bear flag pattern signals a downtrend's continuation. It's widely used by traders and is one of the most reliable tools.
Although the pattern looks simple and is highly useful, it can be challenging for beginners. That's why we recommend you start trading the pattern on a demo account. Libertex provides a demo account that allows traders to meet real market conditions without any risk of losing money. Moreover, the demo account includes a wide range of CFD underlying assets.
FAQ
What Is a Bear Flag Pattern?
The bear flag pattern is a short-term continuation pattern. It occurs within the strong downtrend and is used to confirm the continuation of the downward movement.
Is a Bear Flag Bullish?
The bear flag is a pattern that signals bearish movement. The bull flag is used to confirm the continuation of the upward trend.
How Do You Trade a Bear Flag?
There are several trading strategies. The main idea is to open a short position as soon as the price breaks below the pattern's bottom line.
How Do You Identify a Flag Pattern?
The key way to determine the flag pattern is to draw two lines on the tops and bottoms of the consolidating candlesticks. The pattern is confirmed as soon as the price breaks above/below the resistance/support lines.
Disclaimer: The information in this article is not intended to be and does not constitute investment advice or any other form of advice or recommendation of any sort offered or endorsed by Libertex. Past performance does not guarantee future results.
Why trade with Libertex?
- Get access to a free demo account free of charge.
- Enjoy technical support from an operator 5 days a week, from 9 a.m. to 9 p.m. (Central European Standard Time).
- Use a multiplier of up to 1:30 (for retail clients).
- Operate on a platform for any device: Libertex and MetaTrader.