
Moving Average: Lots of Signals
Moving Average: How to Determine
The moving average is a trend indicator represented by one line. It's located on the price chart, not in a separate window like many other indicators. The indicator's primary function is to determine the direction of the trend. At the same time, the tool can be used to place support and resistance levels. Although the moving average is a one-line indicator, traders use at least two lines with different periods to get signals.
Moving Averages (MA): Types
There are four types of this indicator that differ depending on what they're used for.
Simple (SMA)
This is the most frequently used type of moving average indicators. Simple moving average reflects the average of the closing prices regarding the period you choose. It means that the prices used for the calculation are equal in value for the indicator's calculation.
For instance, when we implement a 200-day MA, we need to add the values of 200 prices and divide the result by 200 to calculate the Simple MA.
Exponential (EMA) and Linear Weighted
Although these are two separate types of moving averages, we combined them because they're almost identical. These types put weight on the latest prices, adding a higher coefficient in the calculation.
This particular calculation helps the MA to resemble the price movements more accurately. Moreover, the signals appear faster. This is where you should be picky and choose the right signs. Later, we'll explain how to combine the MA indicator with other technical tools to get useful alerts.
Smoothed
The Smoothed MA is the most effective when defining a trend as it smooths the fluctuation of the price the most. This type is based on the Simple Moving Average.
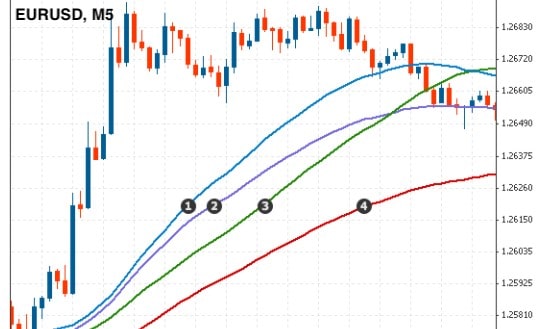
Moving Average Indicator in MetaTrader
As the moving average is one of the leading technical tools, it's a standard indicator used in MetaTrader. To apply it to your chart, click 'Insert', then 'Indicators'. After that, find 'Trend' indicators and choose the necessary instrument.
After you click the indicator, a settings window will appear. This is where you can choose the type of moving average, period, price and shift.
Period
The period refers to the number of candlesticks that will be used to calculate the moving average. The period determines the number of signals you get. A bigger period will smooth market movements, so there will be fewer signals. It can prevent you from choosing the wrong entry and exit points. At the same time, if you trade on a small timeframe, there are risks that you'll miss a good alert.
Conversely, a shorter period increases the number of signals. However, there are risks of fake signals. So, confirmation is necessary.
Usually, investors use 50-, 100- and 200-day periods when trading on larger timeframes and 9-, 12- and 26-day periods on smaller timeframes.
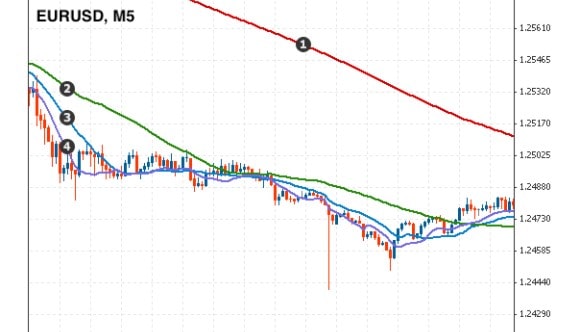
2. 50-period MA
3. 20-period MA
4. 10-period MA
Use a larger period for the moving average on larger timeframes (from H4). Set a smaller period for the moving average on smaller timeframes (up to H1).
Price
As for prices, you can choose from open, close, low, high, median, typical and weighted close. Most traders apply the close price setting.
Shift
Shift allows traders to move the moving average back or forth. This setting can be applied to a specific trading strategy. However, investors usually don't change the shift.
Moving Average: Calculation
Although moving averages are implemented on the chart automatically regardless of the trading platform, you should know how to calculate this tool to understand how it works. There are four types of moving averages, but we'll only consider the calculation of two of them: Simple MA and Exponential MA.
There are different approaches to calculating the MA based on the type.
Simple MA
Simple MA has the easiest formula to calculate compared to other indicators. The name of the indicator provides hints on how to count the tool. We just need to find the average of a certain number of prices.
Let's imagine we have a 9-day MA. We previously explained that the standard setting for the MA price is the close price. That means we should find the value of the last nine daily prices.
After that, we get the sum and divide the result by 9. The new price will be added to the calculation every day, so the last one will change, as well. For instance, imagine the prices are 1, 2, 3, 4, 5, 6, 7, 8, 9. According to the formula, the SMA will be 5. The next day the price is 10. But we won't count the price of 1 anymore, so the SMA will be 6.
The moving average formula is simple:
| SMA= (p1 + p2 + p3+ p4+...) / n |
Where:
p - is the close price of the chosen period.
n - is the number of time periods.
Exponential MA
When talking about the EMA's features, we mentioned that this MA adds weight to the last counted price. That's why we need to add a coefficient or multiplier when calculating it.
First, we need to calculate the multiplier. To do that, we need to add the MA's period and 1. Then, divide the two by the result of the previous action. For instance, the period is 9, then the multiplier is 0.5 as 2 / (9+1) = 0.2.
Now, we're ready to calculate the EMA. We need to multiply the close price by the coefficient, then multiply the EMA from the previous day by the result of subtracting the coefficient from 1. The last step is to get the sum of both results.
| EMA = close price x coefficient + EMA (previous day) x (1-coefficient) |
SMA and EMA
Since we highlighted the calculation of SMA and EMA, we should mark the similarities and differences between them.
|
Similarities |
Differences |
|
Both lines are used to build other indicators like MACD, Bollinger Bands, etc. |
The main difference is that the EMA makes the last prices the most important for the calculation. This means it is more sensitive and has fewer lags. |
|
Whether you use SMA or EMA, the settings you can apply to the lines are similar. |
SMA can be more useful for defining support and resistance levels. |
The best idea is to apply both lines on one chart with the same settings and compare their signals. The one you choose for your trading strategy depends on your aims.
How to Use Moving Averages
The moving average is a trend indicator, which means it provides signals for a trend reversal. When you find them, you can define the perfect entry and exit points. There are two famous terms: the Golden Cross and Dead Cross.
Although the moving average is represented by a single line, to get a signal, you need to combine at least two lines with different periods.
Usually, investors use three moving averages. But they're not random. There are particular sets of periods, such as 9-12-26 or 50-100-200.
Moving averages are mostly used to define the trend direction and support/resistance levels.
Trend
Let's start with the primary function.
- Golden Cross. Here, we need two moving averages with different periods. When the MA with a smaller period crosses the MA with a bigger period from the bottom up, it's a buy signal.
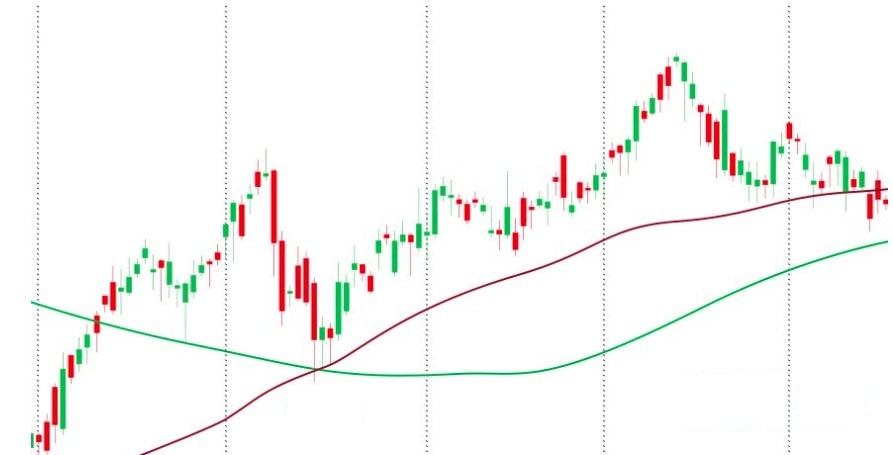
- Dead Cross. Inversely, if the MA with a smaller period breaks below the MA with a bigger period, it's a sell signal.
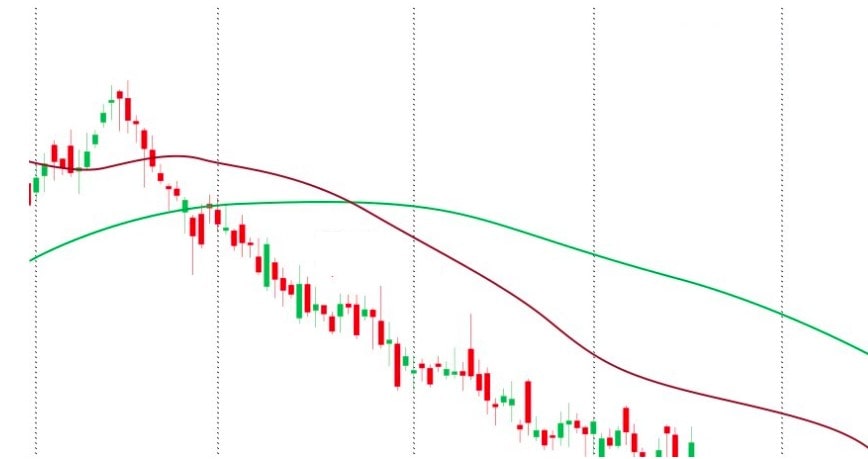
It's also possible to define the direction of the trend following the MA. If the MA moves up, it's a bullish trend. In the case of the bearish trend, the MA declines.
Support and Resistance levels
Moving averages can serve as support and resistance levels. The strength of this signal will depend on the MA's period. The bigger the period is, the more robust support/resistance you have. The timeframe is also crucial. The bigger the timeframe is, the stronger the MA will be.
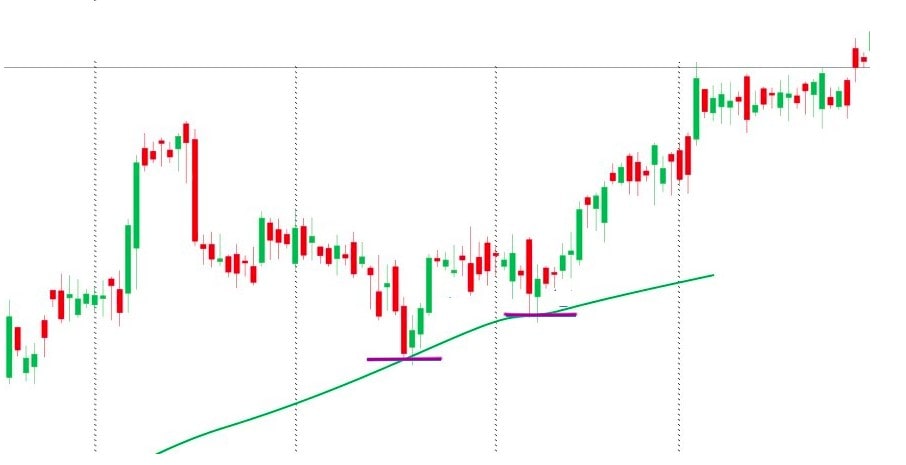
The rule is simple: the price is supposed to reverse near the moving average. If we compare the 100-day moving average and 100-hour moving average, the price will be more likely to consolidate near the 100-day MA.
Why Use the Moving Average
The moving average can be called the simplest indicator. Its signals are clear and frequently appear on the chart, and traders use these trend indicators the most. In addition to that, the trend is one of the essential tools that help investors build a strong strategy.
MA and Other Indicators
At the beginning of the article, we mentioned that the MA is also a part of other indicators. The most famous are MACD (Moving Average Convergence Divergence), Alligator, Ichimoku Kinko Hyo and Bollinger Bands.
Combine signals that the moving average provides with signs of other indicators. But you better not use moving averages with the indicators that contain them.
It's also crucial to combine signals that the moving average provides with signs of other indicators. We wouldn't recommend using a moving average with the indicators that contain it. So, you can place oscillators together with MA. For instance, RSI and Awesome Oscillator give signals of a price reversal. Also, it would be useful to find candlestick patterns that alert a price turn or trend continuation.
Moving Average: Advantages and Disadvantages
Everyone knows that the moving average is a simple, effective indicator, but it still has its limitations.
|
Benefits |
Limitations |
|
Simple. The moving average is an easy indicator. Whether you're a beginner or a professional, you can apply it to the chart. |
False signals. Like any indicator, the MA may provide fake alerts if you use the wrong period. As such, look for confirmation. |
|
Effective. The MA tool provides many signals. It is represented by several types that allow you to find the perfect setting for you. Moreover, it's included in the calculation of many indicators. |
Delayed signals. As the moving average uses previous prices in its calculation, it submits delayed signals. |
|
Any timeframe. This indicator can be applied to any timeframe as it has many settings. You can build the perfect MA for your timeframe. |
Many settings. If you're a newbie, it may seem complicated to remember all the settings you should apply to one indicator. However, there are standard sets that make a traders' life easier. |
|
Any asset. A great feature of the MA tool is that it can predict the price direction of any asset, whether you're trading currencies, stocks, bonds, cryptocurrencies, etc. |
Particular conditions. Although the indicator provides many signals, it works well only in strong trends. When the market consolidates, you will barely find a useful sign. |
Tips for Traders
The MA indicator is an easy technical tool. Still, traders make mistakes when applying it to the chart. Let's consider the most frequent mistakes:
- Don't combine moving average signals with the alerts of the indicators that are built on MA.
- The primary function of the MA is to define the trend. That means you can find the trend direction and entry and exit points on a trend reversal. Combine moving averages with other indicators and chart patterns to get a confirmation.
- Keep in mind that the shorter the moving average's period is, the more often it will generate trading signals, but they will be less reliable. The longer the moving average's period is, the more reliable the signs will be, but they'll lag more and appear less frequently.
MA Effective Strategies
Above, we mentioned several ways to find signals of the moving average tool. Additionally, we would like to share several effective trading strategies to help you if you still don't have your own.
SMA Strategy
We'll start with the strategy based on the Simple Moving Average. Previously, we were told that investors usually use at least two moving averages to predict a price direction. In our strategies, we'll also use two MAs.
- Step 1. Pick the asset you want to trade. We'll use longer-term moving averages. That's why it's important to choose big timeframes. We'll take a daily chart of the EUR/USD pair.
- Step 2. Find a cross. In our example, we have a bullish cross or Golden Cross. A 100-day MA crossed the 200-day SMA to the upside.
- Step 3. Find confirmation. We took the RSI oscillator, which provides a signal of the trend reversal and continuation. Simultaneously, when there was a MA cross, the RSI broke above 70. Although it's a sign of a possible market reversal downward, it's also an alert of the strong uptrend. Open a buy position at the cross.
- Step 4. Place a Stop Loss order to limit the possibility of losses. The Stop Loss can be placed 5-10 pips below the previous support level.
- Step 5. Take profit when the RSI indicator falls below 70. It's a signal of the possible trend turn. It's better if the MAs cross each other as well.
The same strategy can be implemented on a sell trade, but all the steps should be done inversely.
EMA Strategy
Here is the strategy that works well when using an exponential moving average.
- Step 1. Choose an asset you want to trade and place it in the H4 chart. We want to trade the EUR/USD pair.
- Step 2. Place a 20- and 50-period EMA. We will use two lines to find a crossover that will define the perfect entry point.
- Step 3. On the price chart, we have a bullish trend. Thus, we need to wait until the price is traded above both moving averages, and a faster MA crosses the slower one bottom-up.
- Step 4. It seems we can open a buy position as the cross happens. However, you should always be careful. Because we don't know whether the trend is reliable, we should find confirmation.
- Step 5. Open a buy position as soon as the price tests the zone between the lines for the third time.
- Step 6. It's time to limit your risks. Place a Stop Loss order 20 pips below the slower (50-period) EMA.
- Step 7. The most exciting part of the strategy is a Take Profit order. It's time to close the trade as soon as the price falls below the 50-period EMA and closes there.
The confirmation can be received via other indicators or price movements. In this strategy, to be sure the trend is strong, we need to wait for at least two retests of the lines. If the price doesn't break below 20- and 50-period moving averages and stays between the lines, we can be sure the bullish trend is strong.
You can use the same strategy for the sell positions, but all the steps should be applied in the inverse.
Conclusion
To conclude, the moving average is one of the leading technical tools. Even beginner investors use this indicator widely because its signals are clear.
However, like any other instrument, it has pitfalls. The most critical limitation is delayed signals, as the indicator is based on the previous prices. Thus, it's crucial to confirm signals via additional tools and patterns.
CFDs are complex instruments and come with a high risk of losing money.If you don't have enough skills, we recommend using a Libertex demo account. It includes all the indicators you can apply in the real account, but it prevents you from losing money.
If you still have questions, read the answers to the most frequently asked ones.
FAQ
How Do You Calculate the Moving Average?
The calculation differs for a Simple Moving Average and an Exponential Moving Average. For a Simple MA, find the average of the close prices for a certain period. To get the EMA's value, find the coefficient.
Which Moving Average Is the Best?
The type of moving average and its effectiveness depend only on your aims and trading strategy.
Why Is the Moving Average Important?
First of all, it's included in other indicators. Secondly, it's one of the simplest and most effective technical tools that provide many signals.
How Do You Calculate a 7-day Moving Average?
For the Simple Moving Average, summarise the previous seven days' close prices and divide the result by 7.
Disclaimer: The information in this article is not intended to be and does not constitute investment advice or any other form of advice or recommendation of any sort offered or endorsed by Libertex. Past performance does not guarantee future results.
Why trade with Libertex?
- Get access to a free demo account free of charge.
- Enjoy technical support from an operator 5 days a week, from 9 a.m. to 9 p.m. (Central European Standard Time).
- Use a multiplier of up to 1:30 (for retail clients).
- Operate on a platform for any device: Libertex and MetaTrader.