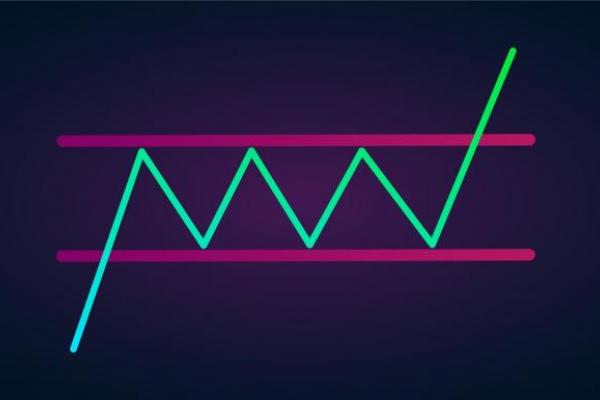

Draw Effective Support and Resistance
Support and resistance levels are an effective tool for any market, including the forex and stock markets. Drawing these lines isn't complicated, but it's crucial to know where to draw them.
Support and Resistance: Theory
In general, support and resistance are levels where the price is supposed to meet an obstacle and turn around.
Support and resistance are levels where the price will either reverse or slow down.
Resistance is the upper level towards which the price increases. Traders expect the price to either bounce back from this level and move down or simply slow down its surge. If the price manages to break above the resistance, the strength of the price's uptrend is confirmed. However, the price continues looking for the next obstacle to bounce off of.
Support is the lower level towards which the price declines. Inversely to how resistance works, the price is anticipated to either reverse and move upwards or slow its fall. If it drops below this level, the downtrend's strength is confirmed, and the price will continue to look for the next obstacle to rebound off of.
Support and Resistance Types
There are many types of support and resistance levels. Here are the most important ones.
Swing Highs and Lows
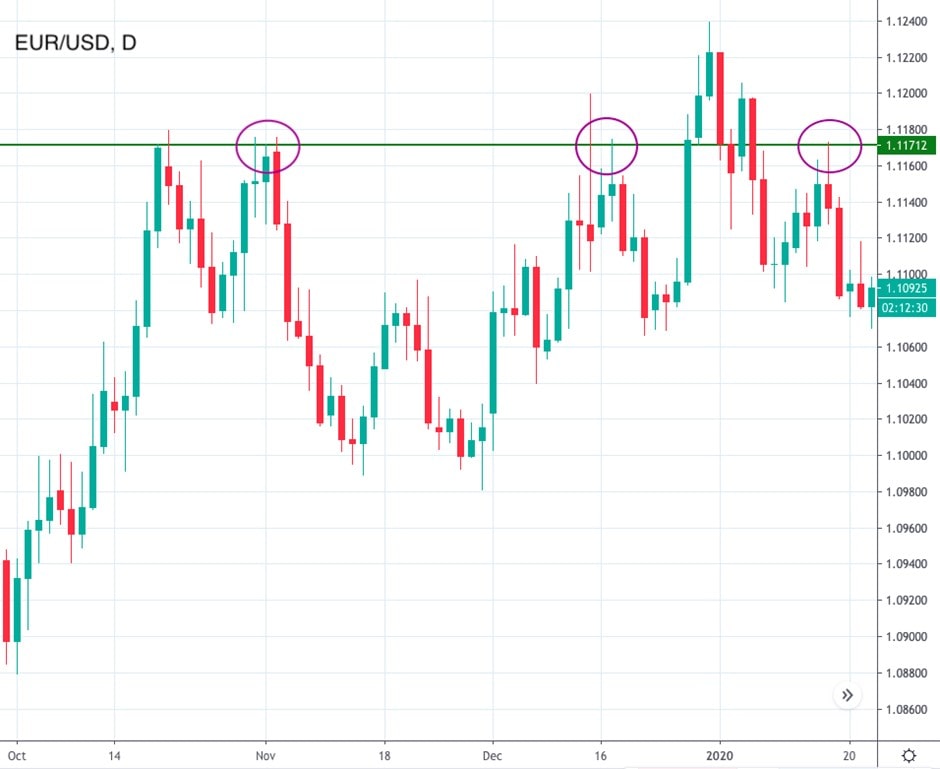
These are a traditional type of support and resistance level. To determine any of them, you just need to pick up the closest point where the price turned around. If you draw a horizontal line through this level, you'll get possible support or resistance levels.
If you see a swing low where the price turned up, that will be the support level. If you find a swing high where the price reversed downward, that will be the resistance level. This type of support and resistance is the most reliable.
Stepping Swing Points
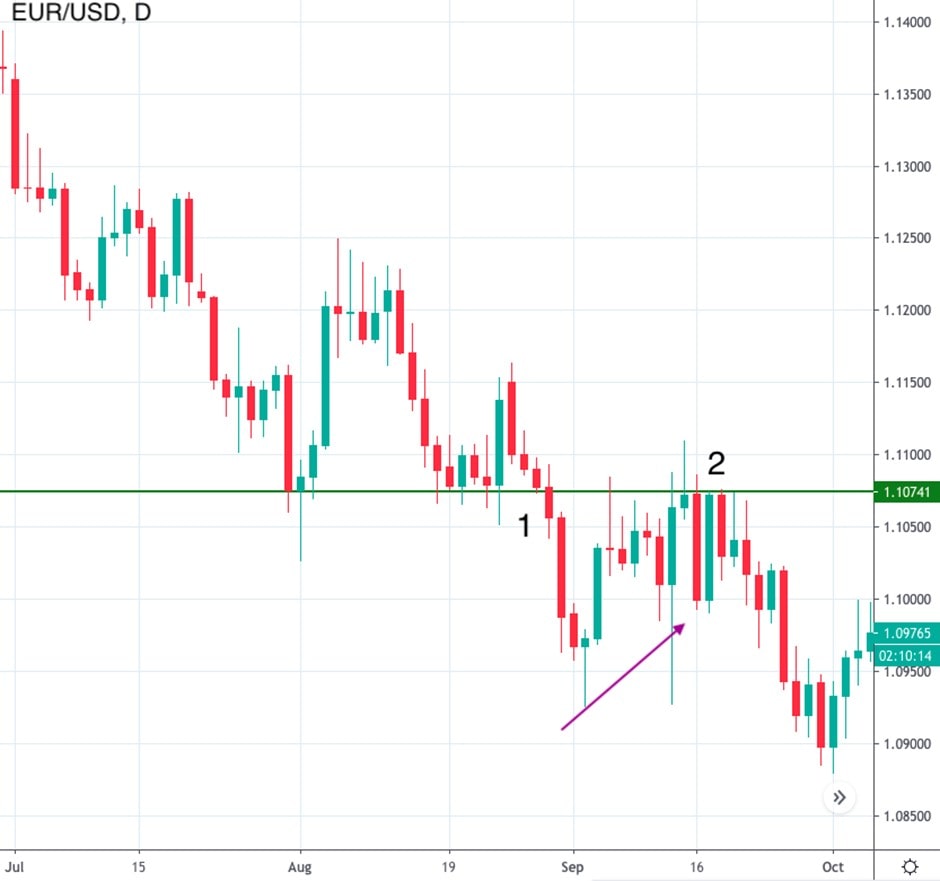
This type of support and resistance occurs in trends. If you see a strong trend, you can expect the price to break support/resistance levels. As soon as the price breaks the obstacle, this level changes its first destination.
For example, imagine you're trading in a downtrend. The price breaks below the first support, resulting in this support becoming a resistance for the price. You can expect the asset to return to this level and a pullback to occur. So, you can either enter a long position targeting the newly formed resistance or trade on the downside reversal from it.
Dynamic Support and Resistance
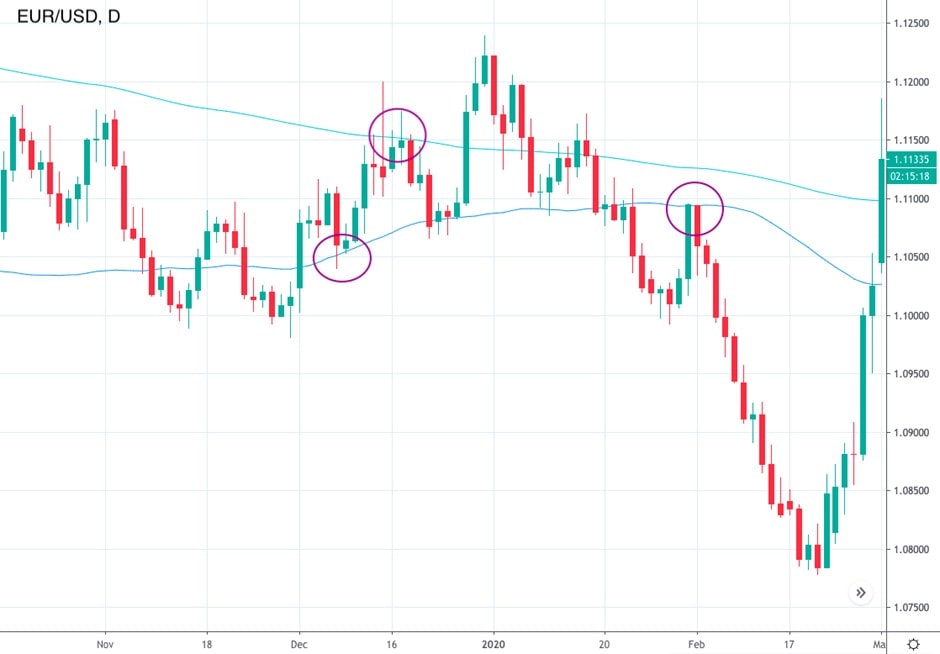
These levels change based on the timeframe. They're not drawn; instead, to get them, you need to implement the moving average indicator. One of the moving average line's functions is to serve as a support or resistance level depending on its location to the price. Because the indicator is always moving, the support/resistance levels change all the time.
Find Support and Resistance on a Chart
Support and resistance levels are easily identifiable on the price chart. The methods for finding them on the chart correlate with the types we explained above.
Horizontal Lines
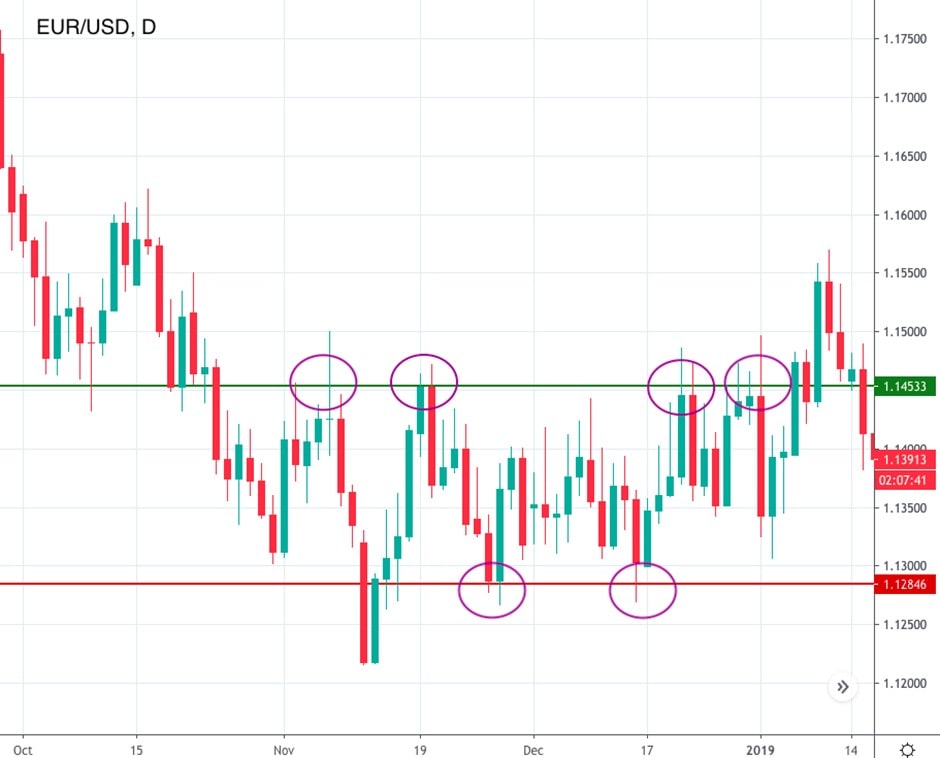
The traditional method of identifying support/resistance levels is to find swing highs and lows. Swing means that the price rebounded from that level and changed its direction.
It's sufficient to find only one maximum or minimum where the price reversed last time, draw a horizontal line through it and wait until the price touches this level again.
Trendlines
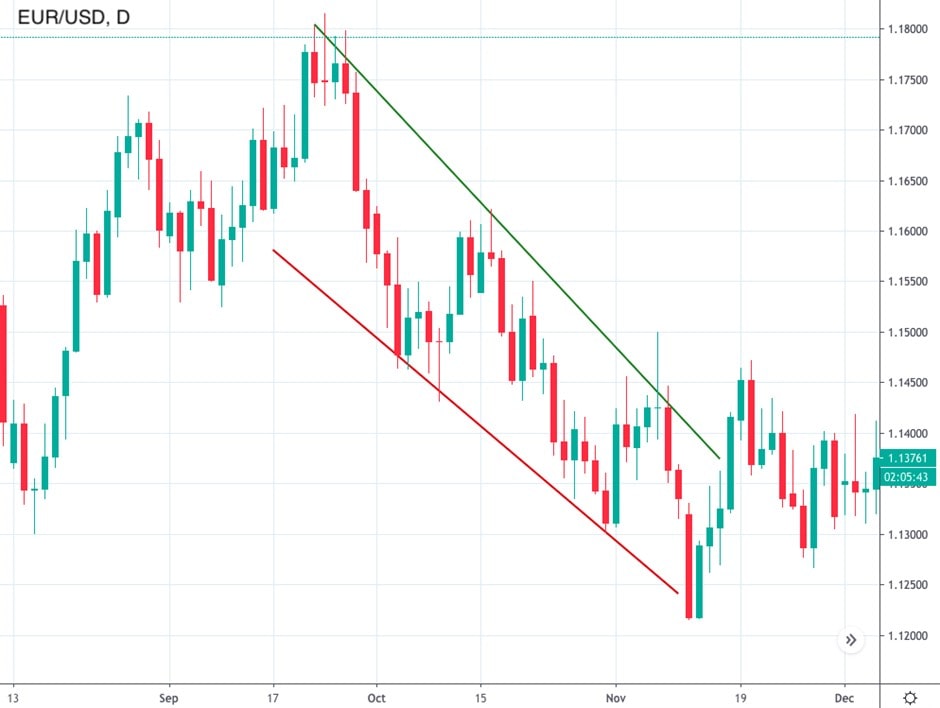
Trendlines are usually called support and resistance levels. Simply stated, a trendline is a level that limits the price movement from top to bottom and helps draw a channel within which the price moves.
The upper boundary of this channel will be the resistance, and the lower border will become support. To draw these levels, you only need two dots (a maximum and a minimum) that can be connected by the line.
Technical Indicators
We've already briefly mentioned moving averages as one kind of technical indicator, but there are other support and resistance indicators that make a trader's life easier by automatically placing support/resistance levels. For example, Fibonacci retracement and pivot points are both indicators that are widely used in technical analysis. They build horizontal lines that serve as either resistance or support.
Use technical indicators that will automatically determine support and resistance levels.
Fibonacci retracement is a more complicated indicator. You need to find price extremes and place the index correctly for it to work right.
Pivot points don't require any particular actions. All you need to do is place them on the chart like any other indicator. However, they're not a standard technical tool. If you trade in MetaTrader, you'll need to download them online.
There are many types of pivot points that serve different purposes. We recommend using a standard pivot points indicator that consists of five levels: one central line that acts as support/resistance, depending on the position of the price, as well as two resistance levels and two support levels placed above and below it.
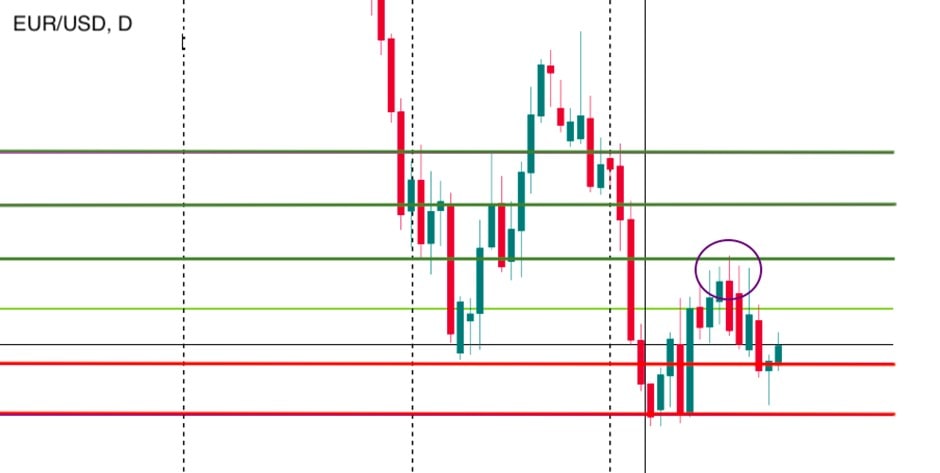
You can also apply moving averages to the price chart, although we should warn you that they're a less accurate way to determine support and resistance because they're not stable and change their position based on price movements.
Drawing Support and Resistance Levels
Now that you know how to define support and resistance lines, it's time to move on to practise placing them on the price chart. No matter what trading platform you use, there are tools for drawing support and resistance levels.
To draw support and resistance levels, you just need one dot and line tool.
If we're talking about classic horizontal lines, you only need to find the tool panel, choose a horizontal line and draw it through the peaks.
If we're discussing trendlines, the trading platform can either offer a trendline tool or the same line you used for the horizontal support and resistance.
If you rely more heavily on the indicators, simply choose your preferred indicator(s) and apply it/them to the chart.
Drawing S&R Levels in MT4
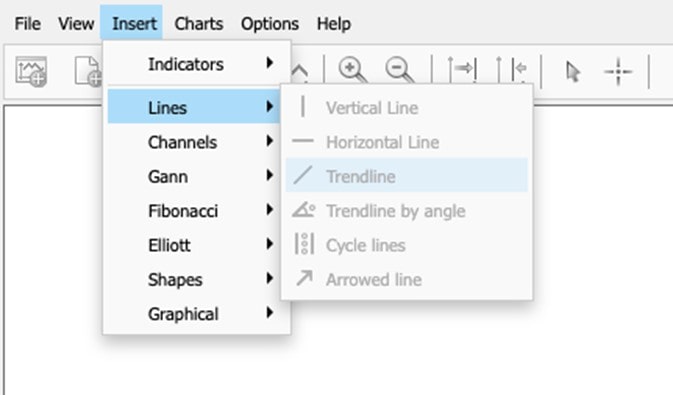
To draw support and resistance levels in MetaTrader 4, you should click 'Insert', then 'Lines'. Once there, choose a horizontal line or a trendline. To implement an indicator, select 'Insert', then 'Indicators'. Here, you'll either choose from the trend instruments or a custom option. Note that the Fibonacci tool is located separately. To find it, click 'Insert', then 'Fibonacci'.
Avoid False Breakouts
The main idea of the support/resistance levels is to stop the price. That's why traders trade on the price pullback. However, if the trend is reliable and buyers or sellers prevail in the market, the odds are that the level will be broken. If that happens, traders trade on the breakout. So, they sell in a robust downtrend and buy in a strong uptrend.
Wide zones will help avoid false breakouts.
However, there are situations when the price breaks the support or resistance, but the trend doesn't continue, and the price returns to previous positions. This is called a false breakout.
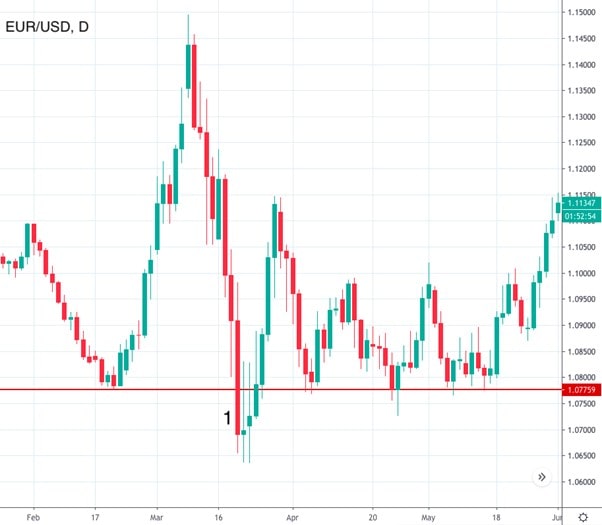
It can be challenging for traders and investors to determine whether a breakout is real or false. There's no perfect rule that will prevent you from falling for false breakouts, but this tip might help.
Tip: Identify support/resistance areas rather than levels. A level is a precise point that can be easily overcome. If you widen the levels, the risk of meeting a false breakout will decline. You can even use a line chart instead of a Japanese candlestick one to easily identify zones. A line price chart includes only close prices, so you eliminate unnecessary information.
Trade on Support and Resistance
Now is the time for the most exciting and crucial part of this article:
- Entry points. The main idea of these levels is that the price is supposed to bounce off of them. The easiest way to trade is to open a sell trade when the price bounces off the resistance and a buy position when it rebounds from the support. This rule applies both to trend trading and standard trading on horizontal levels.
- Exit points. Support/resistance levels can also be used as exit points. You know that the price calms down near them, so you can close a position as soon as the price approaches these levels. If you're sure the price is hitting the support/resistance levels, you can place a take-profit order at either the support if you're selling or the resistance if you're buying to close the trade automatically.
- Stop-loss levels. Support and resistance can also hint at possible stop-loss levels. You should never place them on the support or resistance. For example, if you see that the price is trading near a clear resistance line, you can look to enter into a short position and place your stop-loss level just above it.
Trading Strategies
You can build your own trading strategy using support and resistance levels, but we want to share several other effective strategies just in case.
Trade in Ranges
This strategy works for a market in consolidation when there's no clear trend either up or down. You need to determine horizontal support and resistance zones. Zones, not levels, are more productive and allow you to stay in the trade longer.
The idea is the same: buy at the support, sell at the resistance. The whole trade will be placed in the space between the support and resistance levels. If you know where the price will rebound, you don't even need to wait for it to touch these levels. You can simply place limit orders.
Tip: Remember about stop-loss levels. If you're opening a long position, place the stop-loss below the support level. For a short position, place it above the resistance.
Trade on Breakouts
The next strategy assumes that momentum is robust, and the price manages to break either above the resistance in a bullish trend or below the support in a bearish trend. However, there's also the risk of a false breakout. That's why traders trade on price pullbacks, not on breakouts.
Let's say, for example, that we have a newly forming bullish trend, and the price has broken above the range's resistance. Wait for it to reverse towards the resistance. This would be a pullback. When the price touches the resistance, that's your entry point. Open a long position and place the stop-loss below the previous resistance.
Trendline
You can also trade in a strong trend on a rebound from the trendline. Draw a line connecting at least two lows in the uptrend or a line connecting two highs or more in the downtrend.
These lines will perform as possible entry points. You need to be sure the trend is strong, which is why you need to use such indicators as ADX to confirm the trend's strength. Open a long position when the price bounces off the lower trendline in an uptrend and a short position when it reverses from the upper trendline in a downtrend.
Common Mistakes
There are several mistakes all traders make when drawing support and resistance lines or trading on them:
- Place zones instead of levels. If you draw precise levels instead of zones, there's a risk the price will break the levels.
- Stop-loss orders. Placing stop-loss orders on the support or resistance is possible but not recommended.
- Technical indicators. When using technical indicators to place support and resistance levels, it's essential to choose the right settings and to configure the indicator correctly.
- Larger timeframes. Support and resistance levels can be easily determined on any timeframe, but they're more reliable and necessary on bigger ones.
- Replacement. You should remember that support and resistance can replace each other. When the price breaks below the support, it becomes the new resistance; similarly, when the resistance is broken, it turns into support.
Conclusion
To wrap up, support and resistance are important levels every trader should know about. They help determine entry and exit points, show the current market picture and can predict the future price direction.
Yet, it's essential to know how to draw them. For this, you need to practice a lot. A Libertex demo account allows you to develop your skills thanks to the full range of securities and instruments available in it. The main advantage is that you can train in conditions that mirror the real market without risking your money.
Check out the answers to some of the most frequently asked questions.
FAQ
How Do You Calculate Support and Resistance?
You don't need a formula to calculate support and resistance levels. They're simply placed on previous price swings.
What Is Strong Support and Resistance?
Strong support and resistance are levels where the price turns around.
How Do You Read Support and Resistance?
Support and resistance are levels where the price either reverses or slows down.
Which Timeframe Is Best for Support and Resistance?
There is no best timeframe for support and resistance levels. However, to find a more reliable level, consider using big timeframes.
How Do You Set Support and Resistance Levels?
To set support and resistance, you can draw a horizontal line through the previous price extremes. A trendline can also be drawn through at least two points. But if you don't trust your skills, you can use technical indicators such as Moving Averages, Fibonacci Retracement or Pivot Points.
Disclaimer: The information in this article is not intended to be and does not constitute investment advice or any other form of advice or recommendation of any sort offered or endorsed by Libertex. Past performance does not guarantee future results.
Why trade with Libertex?
- Get access to a free demo account free of charge.
- Enjoy technical support from an operator 5 days a week, from 9 a.m. to 9 p.m. (Central European Standard Time).
- Use a multiplier of up to 1:30 (for retail clients).
- Operate on a platform for any device: Libertex and MetaTrader.