
A Pullback: Trade Against a Trend
Prepared by the Libertex team
Content reviewed internally in accordance with regulatory standards.
When reading analytical outlooks on price movements, you might run across the word "pullback". Many trading strategies are based on pullback action, and pullbacks allow you to trade against the trend.
Do you think this is wrong because theory teaches that you should follow the primary trend? What is a pullback, actually? Keep reading to learn the ins and outs of pullbacks.
Pullback: Definition
If you're familiar with a price chart, you know that an asset never moves in a straight line. It moves up and down, even within trends. Look at the image below that shows a strong uptrend. Every time the price goes down, it's a pullback.
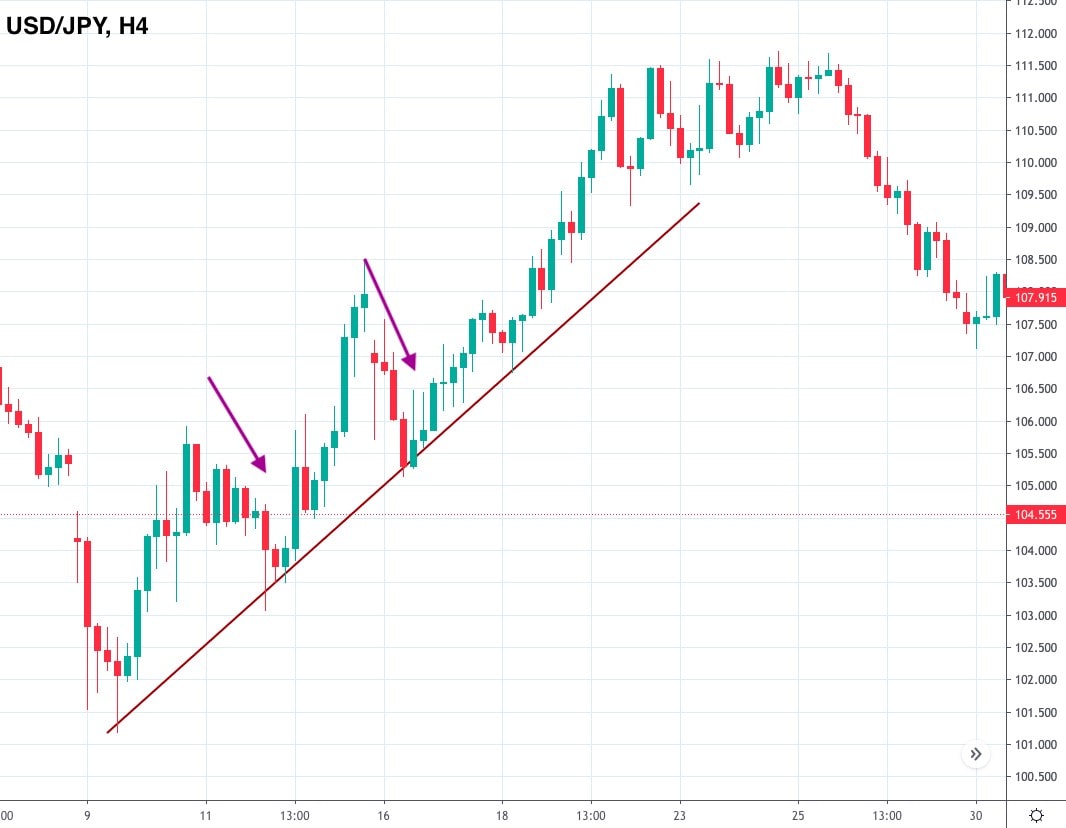
A pullback is a short-term price movement against the primary trend.
You should already be able to gather the meaning of a pullback from the explanation above, but to be direct, here's a definition: a pullback is a movement against the primary trend for a short period of time.
Pullback Triggers
We can say that a pullback is a pause in the primary trend. It means that bulls in a downtrend and bears in an uptrend take control of the price for a while. There can be several reasons why the price changes direction. To predict a pullback, you should learn about fundamental analysis.
Pullbacks occur due to a change in market sentiment.
- If we speak about forex, there can be news that signals a weakness of the base currency. Events mentioned in an economic calendar also affect the strength of currencies.
- If you trade metals, you should pay attention to the news. Overall market sentiment has an impact on their price.
- When choosing oil, you should follow the news that defines market sentiment because oil is a risky asset. Crude oil reserves data also influences the commodity's value.
- If you're experienced enough, you can try pullback stock trading. Earnings reports, a company's internal events and industry news affect price movement.
Pullbacks: Real Examples
To predict pullbacks, you should know how to analyse price movements. Let's consider a real example of a pullback.
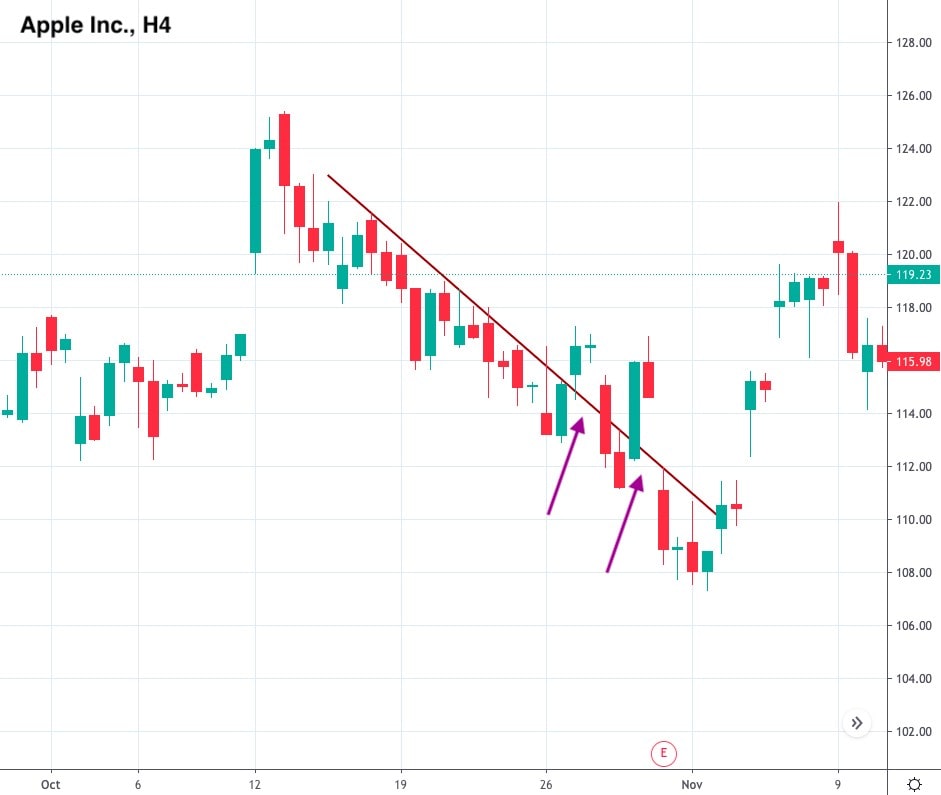
Pullbacks occur on currency charts and really any financial asset's chart. Here's an example of pullback stock trading. We have a four-hour chart of Apple stock. As you can see, a pullback may also happen in a downtrend. Moreover, during a pullback, candlesticks can break above resistance or below support but later return to them.
Pullbacks: Benefits and Drawbacks
A pullback is a complicated pattern that has more disadvantages, especially for a beginner trader.
|
Benefits |
Drawbacks |
|
Better conditions. A pullback allows traders to buy at a lower price in an uptrend and sell at a higher price during a downtrend. Imagine that you missed the beginning of an uptrend but still want to enter the market. The price moves up in an upward trend. So, every time a peak is formed, your chances to buy at an appropriate price drops. However, when a pullback happens, you get an opportunity to get a lower price. |
Pullback or reversal? It's not easy to determine whether what you're seeing is a pullback or a reversal, especially for newbies in the forex market. Imagine that you think the market has turned down for the short term and keep your trade open because you expect the trend will continue. However, it turns out a trend reversal is taking place, and you suffer significant losses. |
|
Difficult to predict. It's hard to predict the beginning and end of a pullback. You can easily miss the point when the trend resumes. |
Pullback vs Throwback
Pullbacks and throwbacks often confuse traders, but these terms are interchangeable.
According to one theory, a pullback occurs when the price breaks a support line downward for a short period of time. In this case, after the price goes back, the support becomes resistance. A throwback is a situation when a price breaks the resistance upward but returns. At the same time, the resistance becomes support.
It seems that a pullback is supposed to happen in uptrends, and a throwback occurs in downtrends. But many traders still call both occasions a pullback.
Pullback vs Reversal
Beginner traders may be confused when dealing with a pullback and a reversal. The example below will clarify the difference.
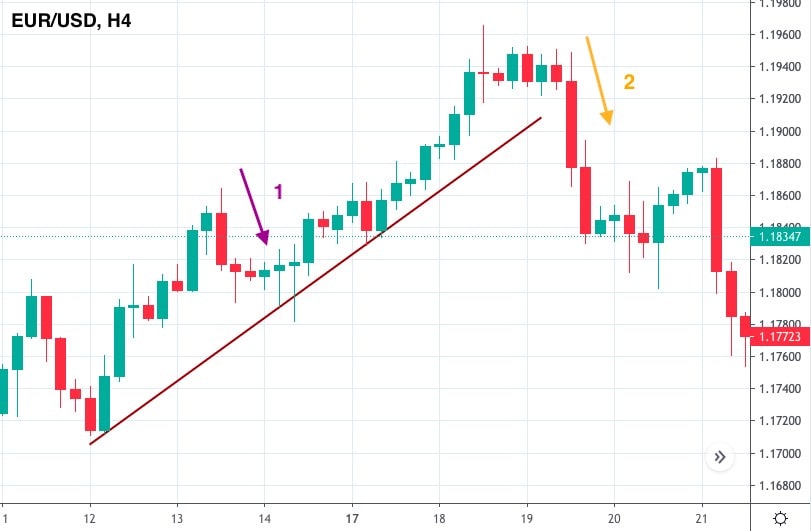
As you can see, a pullback (1) is a short-term price reversal. A real reversal (2) reflects a longer-term change in the trend. A reversal happens when market sentiment changes. It can be tricky to differentiate the terms. That's why you should use trading indicators that will help you define the trend.
Top Indicators for a Pullback Trading
Many indicators can separate a pullback from a reversal. We'll mention the most effective. Later, you can use other instruments. Still, to find the right ones, we recommend using indicators that determine support and resistance levels and demonstrate divergence.
Trend technical indicators help traders distinguish pullbacks from reversals.
Moving Average
The moving average indicator has many functions. One of them is to signal a market reversal. Here, you should learn more about Golden and Death Crosses. When a moving average with a smaller period crosses an MA with an immense period bottom-up, it's a signal of the uptrend. When an MA with a more extended period is crossed from top to bottom, it's a sign of a downtrend. Although, in many cases, the lag of the MA indicator is considered a disadvantage. However, in this case, it's a big pro that will ensure the trader is about to see a trend reversal.
Pivot Points
Pivot Points is one of the best indicators that help to define support and resistance levels. The price is supposed to pull back from these levels. Thus, if the price touches this level, you can consider it as an entry point on the pullback. If the price crosses the levels, it's a reversal.
Fibonacci Retracements
Fibonacci retracements also serve as support and resistance levels. That means you can use them to define pullbacks. Usually, 50% and 61.8% are used in trading strategies. If the price rebounds from these levels, it's a signal that the trend will continue. Here, you can use buy or sell limit orders.
RSI
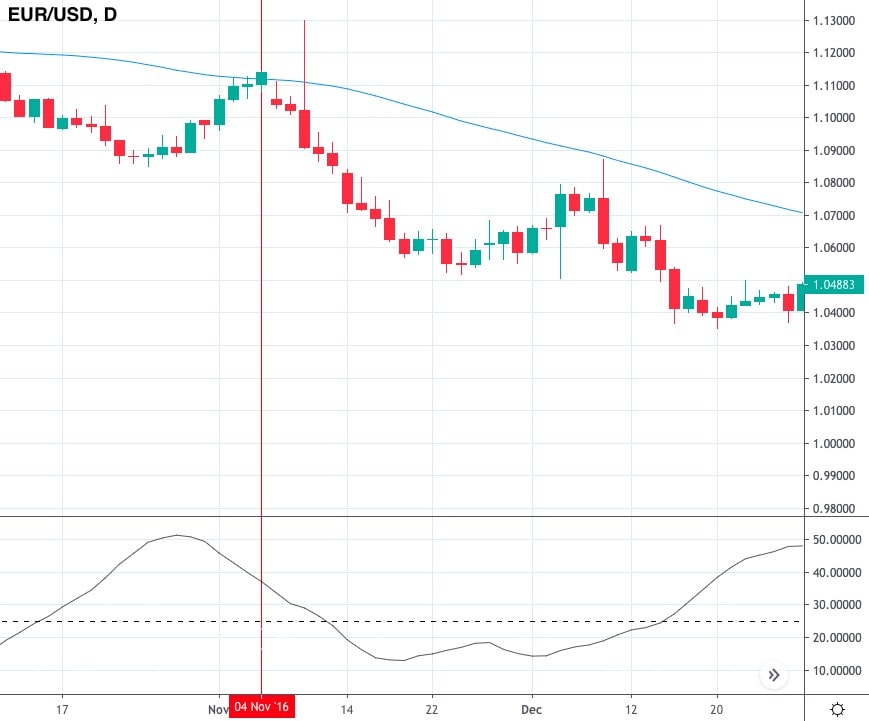
The RSI oscillator is used to define overbought and oversold market conditions. If the indicator crosses the 70 line downward, it may be a sign of a pullback. When it breaks 30 upward, it can be a pullback as well. However, the more reliable signal is a convergence/divergence. When the indicator forms a divergence with a price chart, it's a signal of a price reversal. It can be both a pullback and a trend reversal. Here, you should consider market sentiment.
ADX
The ADX indicator doesn't show the direction of the trend but reflects its strength. Any reading above 25 signals a strong trend. Thus, you can easily define whether it's a pullback or a reversal. If you see that the reading is above 25, a price reversal can be considered a pullback. As soon as the ADX moves below 25, expect a trend reversal.
Top Pullback Trading Strategies
As we've said, it may be hard to determine a pullback on the chart. If you have never dealt with pullbacks, we can suggest several trading strategies that will allow you to practice pullback trading with limited losses.
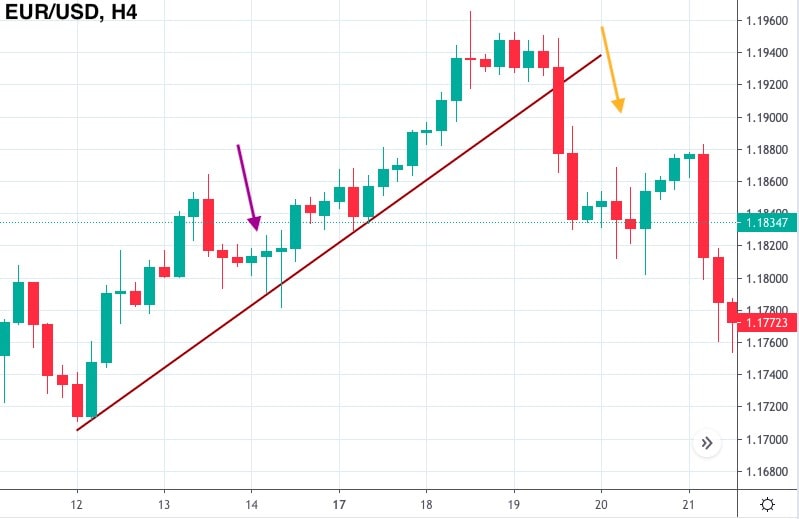
Trendlines Strategy
The first strategy is based on trendlines. All you need to do is draw a trendline. If it's a bullish trend, you should draw a support line. If it's a bearish trend, you need to put a resistance line. This line will serve as a barrier. If the price breaks this level, it's likely there is a trend reversal. However, if the price rebounds, it's a pullback.
Moving Average Strategy
Here, we combine a moving average and a candlestick pattern. If you're familiar with candlestick patterns, it won't be difficult for you.
You should apply a moving average on the price chart. It will reflect the current trend and work as a support or resistance. The period of MA will depend on the timeframe you trade on.
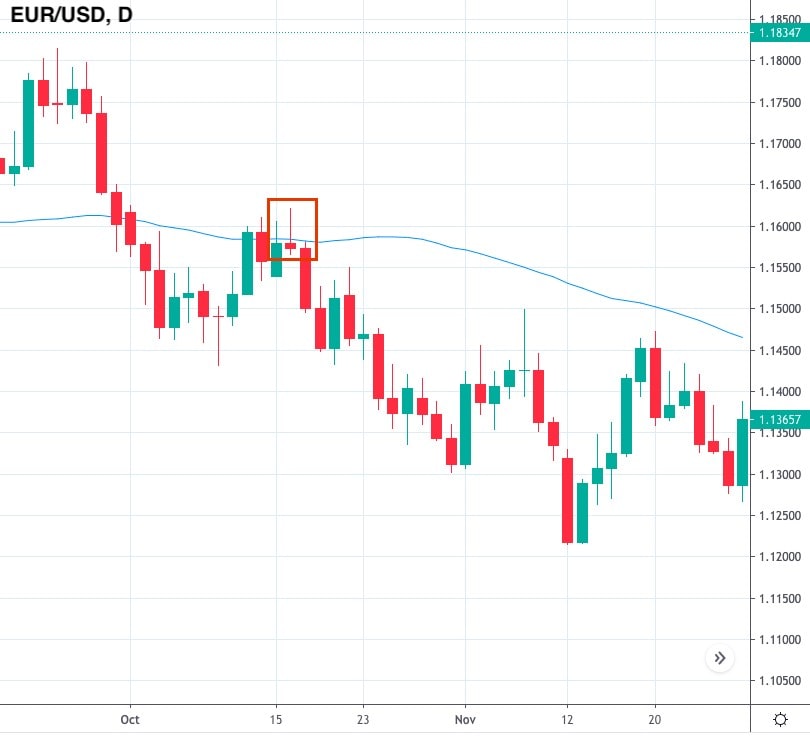
As soon as the price touches the MA, you should look for a reversal candlestick pattern. The best options are Engulfing and Shooting (on the chart below) or Evening Star patterns. That makes it a great opportunity to buy at the lowest price or sell at the highest one.
ADX Strategy
ADX is another indicator that can help you to trade pullbacks. ADX doesn't show the trend direction. Instead, it's used to show the strength of the trend. Usually, any reading above 25 is a sign of a strong trend.
We should also implement the MA indicator on the price chart. The period of the moving average depends on the timeframe. As soon as the price touches the MA and the ADX signals a strong trend, you can use it as an entry point and continue trading within the trend.
Conclusion
To conclude, a pullback can be a confusing point in trading. It's hard to predict and distinguish it from a trend reversal. That's why it's crucial to practice pullback trading before entering the real market. To do that, you can use a Libertex demo account, which includes a full range of CFDs trading instruments.
CFDs are an attractive option that allows you to trade stocks, metals and oil just by opening a trading account. You can also use all the indicators we mentioned above and open trades on the pullback.
So, what is a pullback? Well, it's time to summarise what we've learned here.
FAQ
What is a Pullback in Trading?
A pullback is a short-term price reversal against the primary trend.
Will There Be a Pullback in the Stock Market?
No matter what market you trade in, pullbacks are an essential part of trading.
How Do You Identify a Pullback?
You can identify a pullback by simply looking at the price chart. You can also implement technical indicators, such as Moving Average, ADX and RSI, that will help you distinguish a pullback from a reversal.
How Do You Predict Pullbacks?
You should follow economic events and news that may cause market fluctuations and a change in the force of market players (bulls/bears).
How Do You Trade a Pullback?
Pullbacks allow you to enter the market at a better price. Wait for a pullback to occur, find confirmation from candlestick patterns and technical indicators, and enter the market.
Why Do Pullbacks Happen?
Pullbacks happen due to market events that cause a short-term depreciation of the traded asset in a bullish trend or appreciation of the security in a downtrend.
Disclaimer: The information in this article is not intended to be and does not constitute investment advice or any other form of advice or recommendation of any sort offered or endorsed by Libertex. Past performance does not guarantee future results.
Why trade with Libertex?
- Get access to a free demo account free of charge.
- Enjoy technical support from an operator 5 days a week, from 9 a.m. to 9 p.m. (Central European Standard Time).
- Use a multiplier of up to 1:30 (for retail clients).
- Operate on a platform for any device: Libertex and MetaTrader.