Beautiful Signals of the Butterfly Pattern
Prepared by the Libertex team
Content reviewed internally in accordance with regulatory standards.
The butterfly pattern… It sounds nice, doesn't it? However, the reality is that it hides many difficulties for traders, especially those just starting out. It's not a common trading tool that appears on charts daily. To find the butterfly pattern, you need to practice a lot and put in some effort.
In this article, we'll try to uncover all the pitfalls you may encounter when trading on the butterfly pattern.
What the Butterfly Pattern Looks Like in Trading, and How It Works
Before we talk about the butterfly pattern, let's start with the basics: harmonic patterns.
The butterfly pattern is one of many harmonic patterns, which are chart patterns formed in a specific shape. They're similar to chart patterns such as head and shoulders or double top.
However, they're not as easy as basic chart patterns. Harmonic patterns are built with Fibonacci retracements and expansions. The aim of any harmonic pattern is to define levels where the prevailing trend will resume after consolidation and the targets of this trend.
Why should you learn harmonic patterns if they're more complicated than standard chart patterns? Harmonic combinations provide more reliable trading signals.
Now let's return to our topic, the butterfly pattern. It's a form of the Gartley pattern developed by Bryce Gilmore and Larry Pesavento. The butterfly pattern is a reversal pattern that occurs near the extreme price lows and highs. Traders use the butterfly pattern to indicate the end of a current trend and an entry point during a correction or new trend phase. There are two types of butterfly patterns: bullish and bearish.
The butterfly is a reversal pattern that occurs near the extreme price lows and highs. It's applied to the chart to identify the end of a current trend and an entry point during a correction or new trend phase.
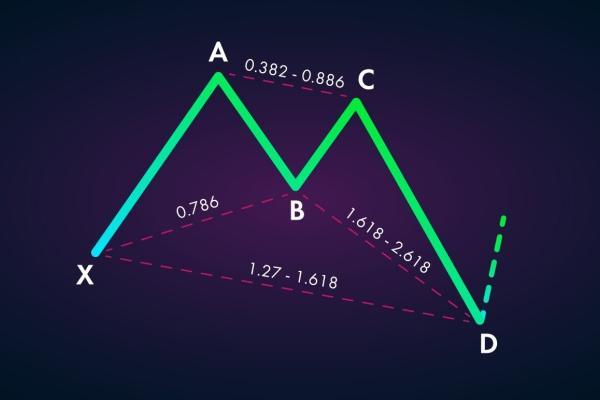
The butterfly pattern is a harmonic pattern that consists of four lines — XA, AB, BC and CD — and five points — X, A, B, C and D. The butterfly pattern also resembles the letters M (bullish) and W (bearish), as well as the Gartley and Bat harmonic patterns.
Inexperienced traders mistake the butterfly pattern for double top/bottom patterns. The whole shape of the butterfly pattern depends on Point B. It determines the butterfly's structure and acts as a starting point for other measurements. The pattern's structure identifies trade opportunities within the pattern.
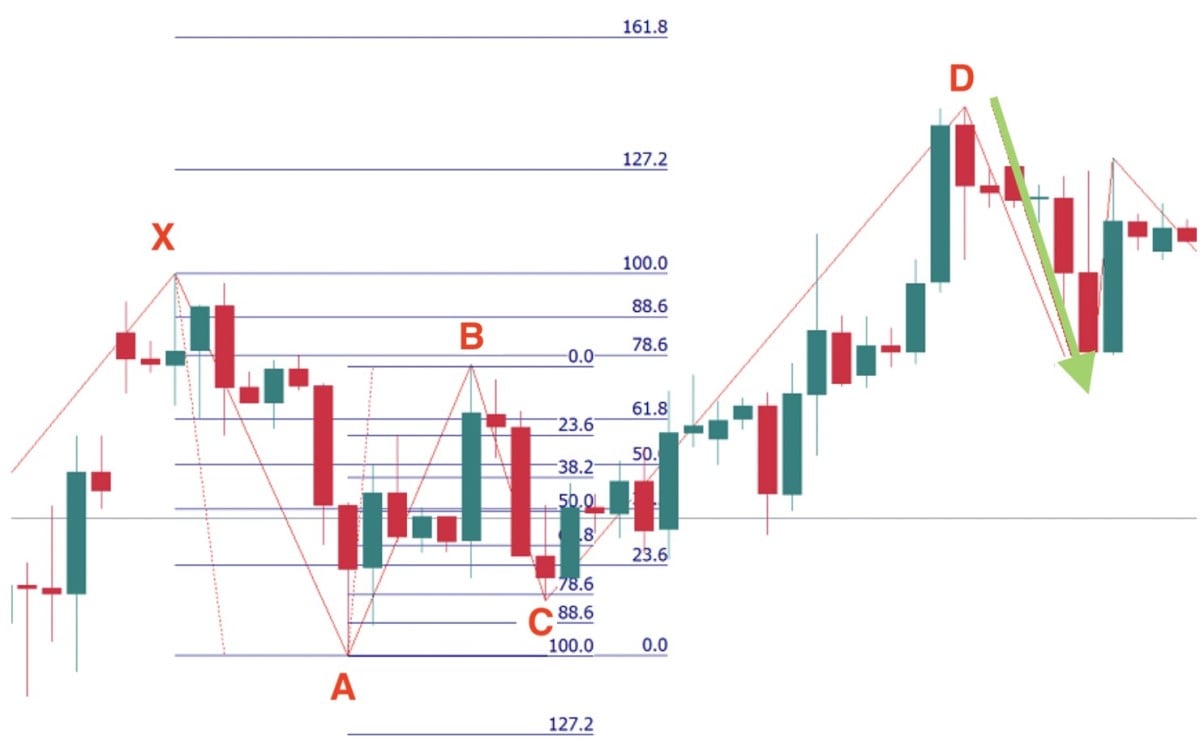
Butterfly Pattern: Forex Market Example
The butterfly pattern is hard to draw in MetaTrader. To identify the pattern, you should use Fibonacci levels and trend lines.
Benefits and Drawbacks of Butterfly Pattern
As we have already mentioned, the butterfly pattern is complicated. Still, there are other things you should know about this pattern that may help you to avoid losses.
Although the butterfly pattern is complicated, it produces highly reliable signals.
|
Benefits |
Limitations |
|
It differs in terms of the precision of signals. |
It's hard to draw on the MetaTrader platform. There is no specific tool for drawing it. |
|
It can be found on any timeframe. |
It's complicated, especially for beginner traders. |
|
Although you should have knowledge of Fibonacci tools when applying the pattern, the butterfly shape is easily recognisable. |
It can be mistaken for double top/bottom chart patterns and Gartley/Bat harmonic patterns. |
|
Although the butterfly pattern can be used as a core signal provider, you should always remember to confirm the signal. |
|
|
Requires knowledge of Fibonacci tools. |
It seems the butterfly pattern has more limitations than advantages, but its benefits outweigh its disadvantages for traders.
Identifying the Butterfly Pattern
It's not very easy to find the butterfly pattern on the price chart. Here are the parameters that will help you distinguish the butterfly pattern from other harmonic patterns.
- The key point of this pattern is that CD is bigger than XA.
- The XA line is a starting point of the pattern.
- The AB line shouldn't be bigger than Point X.
- The BC line shouldn't surpass A.
- The CD line should exceed Point X.
- Point D in the CD line should be equal to or exceed Point B.
- Point B should locate at up to 78.6% retracement of the XA line.
- Point C can be found at the 38.2%-88.6% retracement of the AB line.
- Point D should be at the 161.8%-261.8% extension of the AB line or the 127.2%-161.8% extension of the XA line.
The butterfly pattern resembles the Gartley pattern. The main difference is that Point D is not set at the retracement of the XA line but at its extension.
The butterfly and Gartley patterns look similar: they both have four lines and five points. The main difference is that Point D is not set at the retracement of the XA line but at its extension, so Point D surpasses starting point X.
Trading on the Butterfly Pattern
Any harmonic pattern can provide accurate entry, Take Profit, and Stop Loss levels. We gathered the key rules for trading on the butterfly pattern.
- Enter the market at Point D because it's a potential reversal zone.
- When entering the market, you should have the potential Take Profit and Stop Loss levels in mind. In the butterfly pattern, your first Take Profit order can be placed at 61.8% of the CD line. The second Take Profit level can be at 127.2% of CD. If you're a new trader with doubts, you can also set a Take Profit level at Point B. If you're ready to handle risks, apply an aggressive approach and target Point A.
- A Stop Loss level can be defined by the risk/reward ratio. The best ratios are 1:2 and 1:3.
Bearish and Bullish Butterfly Patterns
There are specific rules for bullish and bearish types.
- Bearish entry point. The sell order should be placed at D (a 127% extension of the XA line).
- Bearish Take Profit. Place the Take Profit point at Point A (aggressive movement) or B (defensive movement).
- Bearish Stop Loss. The Stop Loss order should be above the 161.8% extension of the XA line.
- Bullish entry point. Open a buy trade at Point D (the 127% extension of the XA line).
- Bullish Take Profit. The Take Profit level should be calculated according to your goals and market conditions.
- Bullish Stop Loss. The Stop Loss order should be below the 161.8% extension of the XA line.
The Best Butterfly Pattern Strategies
Let's look at some effective butterfly pattern strategies that will help you in your trading.
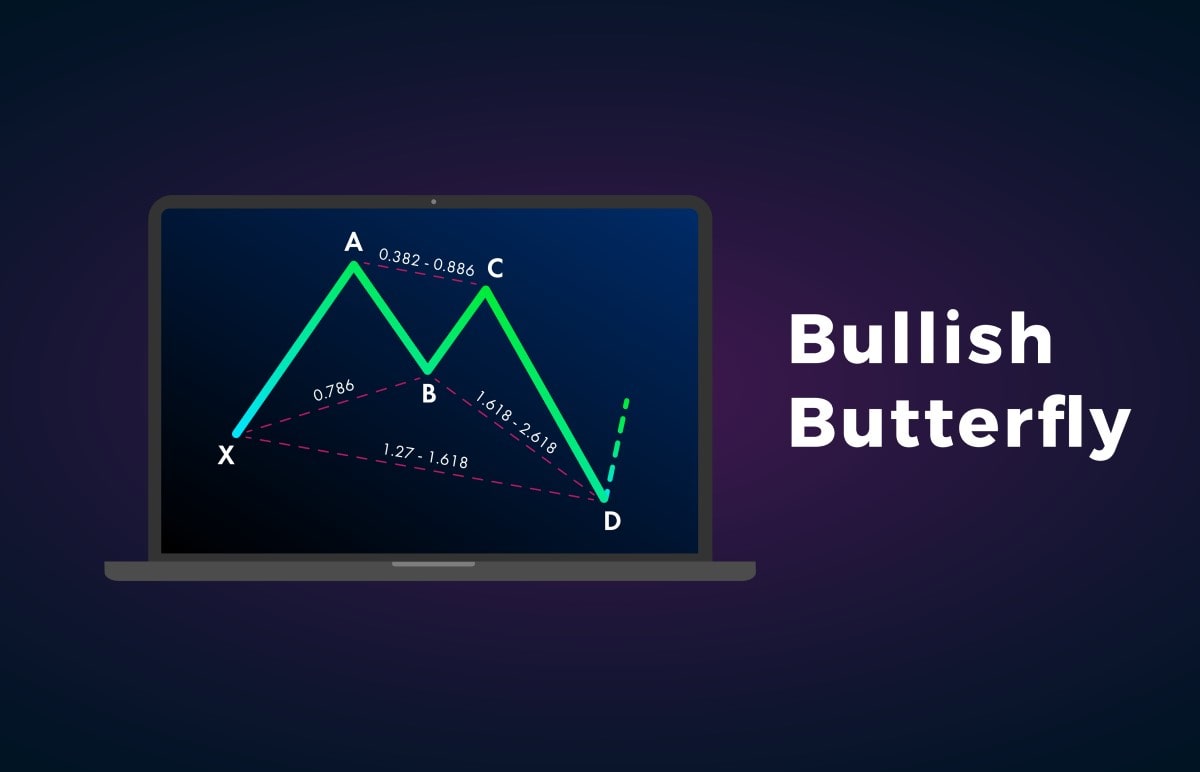
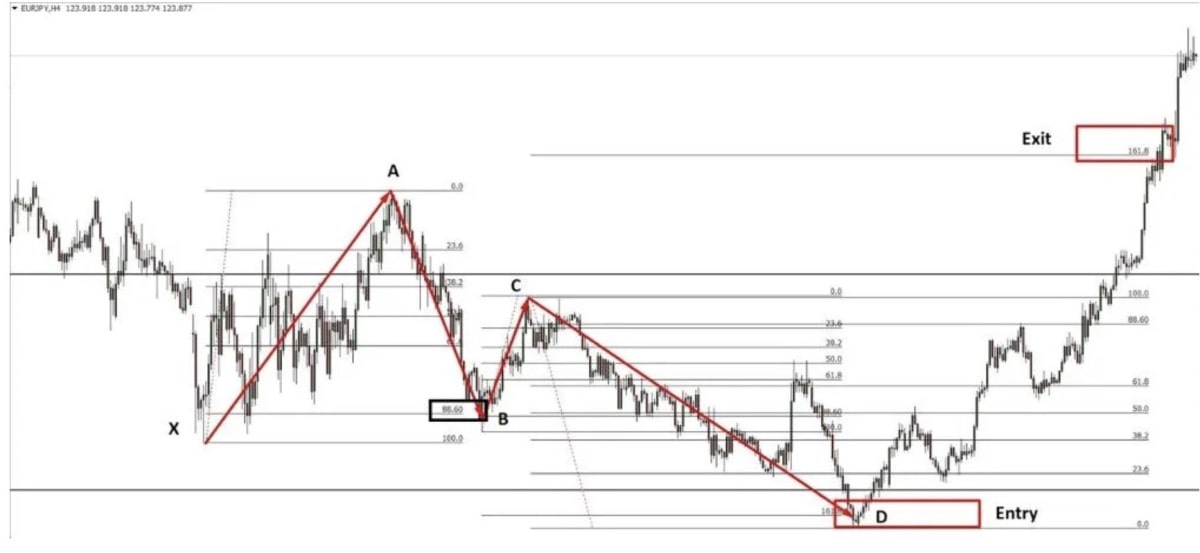
Strategy 1: Bullish Butterfly Pattern
Step 1. The bullish butterfly pattern signals an upward reversal and forms at the end of the downtrend. As such, the first step is to find a bearish trend. One important thing is that the market should be near a reversal point. A reversal can be found by applying technical indicators and finding candlestick reversal patterns.
Step 2. Apply Fibonacci tools to the price chart. The Fibonacci levels are the key element of harmonic patterns.
Step 3. Draw the butterfly pattern.
Step 4. Enter the market at Point D. However, it's better to look for confirmation. Usually, traders use reversal candlestick patterns, such as bullish engulfing or hammer. If the reversal candlestick is found, you should enter the market at the candlestick's closing point.
Step 5. Because the butterfly pattern is tricky, there are risks of false signals if you define the pattern incorrectly. That's why you should place a Stop Loss order. When trading a bullish butterfly, Point D is the lowest point. That means you should place the Stop Loss 10-15 pips below the reversal candlestick. The size of the Stop Loss order can be increased in case of high volatility to 20-25 pips.
Step 6. Determine your Take Profit level before entering the market. Ideally, the Take Profit level is set at Point A. Of course, you can close the trade earlier or increase the level depending on the market situation. If the market corrects at Point C, you can close at least a part of your trade and place a second Take Profit above it. At the same time, the Stop Loss order can be moved to the breakout level.
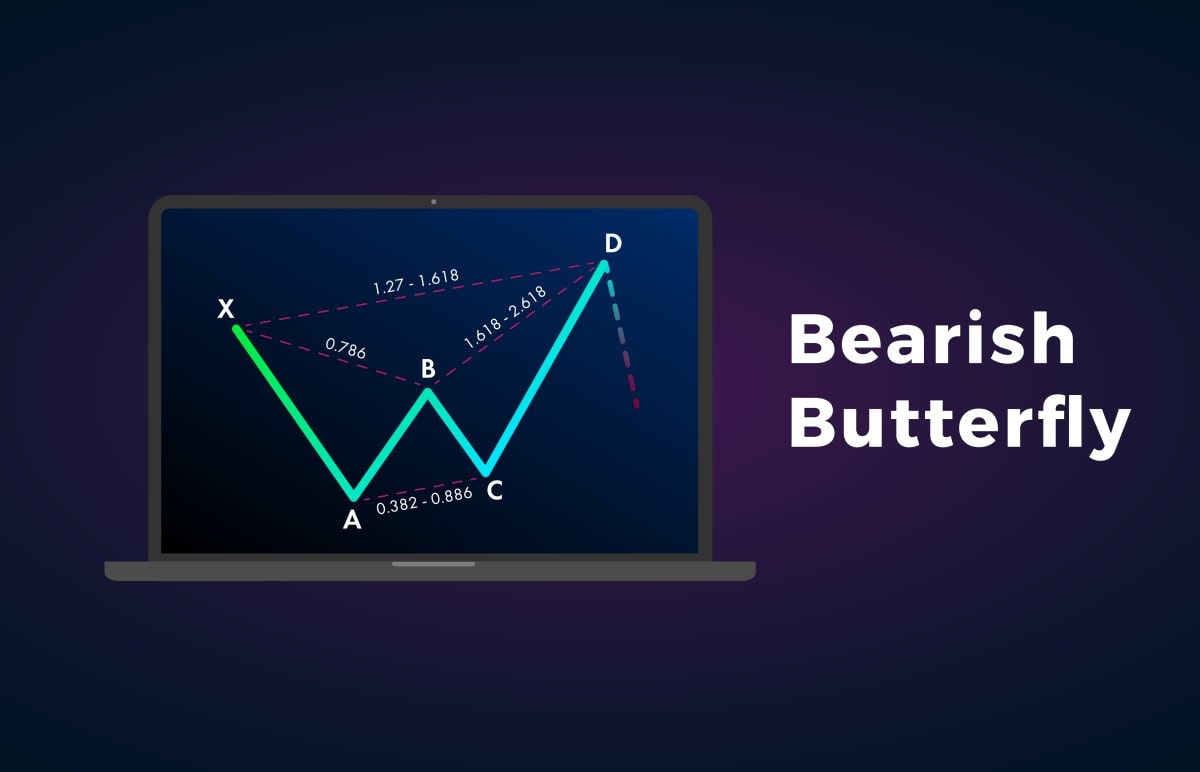
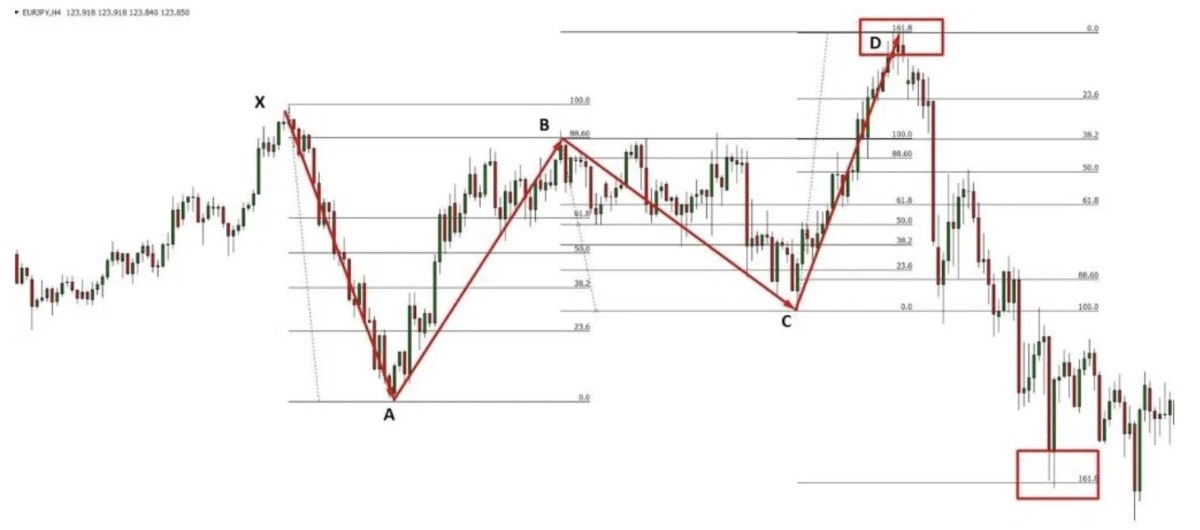
Strategy 2: Bearish Butterfly Pattern
Step 1. Find a bullish trend that is close to reverse as the bearish butterfly occurs at the top of the rising trend and signals a price decline.
Step 2. Apply Fibonacci levels to the price chart.
Step 3. Draw a bearish butterfly.
Step 4. Point D is an entry point. Again, you should look for a confirmation of the price reversal to avoid losses. Try to find reversal candlesticks, such as a shooting star.
Step 5. Calculate what risk level you can handle. Place a Stop Loss order 10-15 pips above Point D. The same applies as in the bullish butterfly strategy: you can extend the size of the Stop Loss to 20-25 pips in case of high volatility.
Step 6. The standard Take Profit is set at Point A, but you should still evaluate the current market conditions to set the correct Take Profit level. If the volume of the bearish momentum is high, the price may reach Point A. If the market corrects at Point C, it's advisable to take some profit. The second Take Profit level can stay at Point A. The Stop Loss order should be moved to the breakout level.
Key Tips About The Butterfly Chart Pattern
Check out the key tips about the butterfly pattern that you should remember when using it on a price chart.
- The butterfly pattern is a reversal pattern that occurs at the end of the trend.
- Reversals after the butterfly pattern are sharper.
- Because the butterfly pattern is quite complicated, it's mostly traded on big timeframes.
- When drawing the butterfly pattern, you should apply the Fibonacci indicator. The Fibonacci tool has specific levels, but it's advisable to add the 78.6%, 88.6% and 127% levels to visualise the pattern more clearly.
- Point D serves as a confirmation point of the butterfly pattern if the price begins to reverse after it.
- The whole shape of the butterfly pattern depends on Point B. It determines the butterfly's structure. It's also a start point for other measurements. The pattern's structure identifies trade opportunities within the pattern.
Here are key parameters of the butterfly pattern:
- The XA line can be any random movement on the price chart.
- The AB line is supposed to be a 78.6% retracement of XA.
- The BC line should be either a 38.2% or 88.6% retracement of AB.
- The CD line reaches 161.8% of the BC line if BC is set at 38.2% of the AB line, or if it reaches 261.8% of the BC line if BC is at 88.6% of AB.
Conclusion
Let's summarise what we've covered here. The butterfly pattern is not an easy trading tool. However, if you know how to draw it, it will reward you with accurate signals.
Before you start applying the butterfly pattern in real trades, make sure to register a Libertex demo account, which allows investors an option to practise trading a wide range of underlying assets on CFDs along with real financial market conditions.
Check the answers to the most frequently asked questions to summarise the information presented in this article.
FAQ
What Is the Butterfly Pattern?
The butterfly pattern is one of the harmonic patterns, which incorporates four lines — XA, AB, BC and CD — and five points — X, A, B, C and D. It signals a trend reversal and occurs near the extreme price lows and highs.
Which Harmonic Pattern Is the Best?
No one harmonic pattern is the best. Each pattern is suitable for a certain market condition. However, statistics show that the butterfly pattern provides a higher probability of a successful trade than the Gartley pattern.
How Can I Trade the Butterfly Chart Pattern?
There are specific rules for trading on the butterfly pattern. See the 'Trading on the Butterfly Pattern' section for more information.
How Can I Identify the Butterfly Pattern?
Here are the most vital requirements for identifying the butterfly pattern. Point B should be located at up to the 78.6% extension of the XA line. Point C can be found at the 38.2%-88.6% extension of the AB line. Point D should be at the 161.8%-261.8% extension of the AB line or the 127.2%-161.8% extension of the XA line.
Does Harmonic Trading Really Work?
Harmonic patterns is a powerful tool for intermediate market reactions, and it is definitely one of the stronger formations compared to regular chart patterns.
Disclaimer: The information in this article is not intended to be and does not constitute investment advice or any other form of advice or recommendation of any sort offered or endorsed by Libertex. Past performance does not guarantee future results.
Why trade with Libertex?
- Get access to a free demo account free of charge.
- Enjoy technical support from an operator 5 days a week, from 9 a.m. to 9 p.m. (Central European Standard Time).
- Use a multiplier of up to 1:30 (for retail clients).
- Operate on a platform for any device: Libertex and MetaTrader.