FTSE 100 Predictions for 2021 and Beyond: Are UK Stocks Gaining Ground Again?
Prepared by the Libertex team
Content reviewed internally in accordance with regulatory standards.
Stock market returns in 2020 were eerily similar to what happened in 2009. We're seeing some strength emerging from a deep stock market recession. Even though the future performance of the FTSE 100 may not resemble past results, it gives investors hope.
UK stocks are still trading at a hefty discount compared to their international peers, so now might be a good time to jump in. In what may become a bull market, can investors look for returns on the Footsie? Check out our FTSE 100 predictions to find out.
Brief Overview of FTSE 100
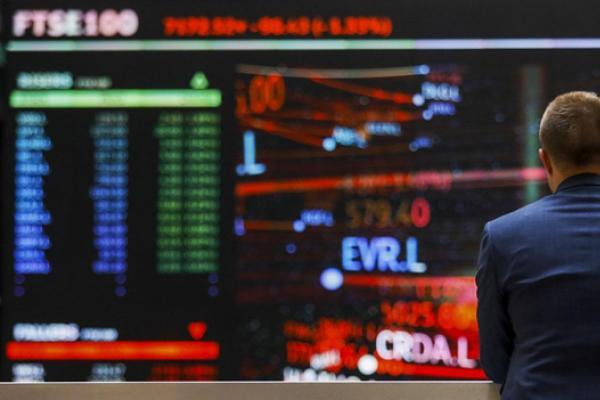
The FTSE 100 Index (The Financial Times Stock Exchange 100 Index) represents the 100 largest companies by market capitalisation listed on the London Stock Exchange. The index value changes with the share prices of the indexed companies and their market caps.
Index characteristics:
- Launch date: 3 January 1984
- Number of constituents: 101
- Net market cap (in millions of GBP): 1,516,013
- Dividend yield: 4.7%
Index constituents are readjusted every fiscal quarter in March, June, September and December. The list itself and the value of each constituent can be changed upon review by the index provider, FTSE Group.
The FTSE 100 accounts for around 80% of the entire market cap of the LSE. This is why many market analysts, traders and investors view the FTSE 100 as representative of the wider UK stock market, just like with the Dow Jones or S&P 500 for US stocks.
However, it's important to note the uptick in international companies counted in the index. And while it's still the best health indicator of the UK economy, it doesn't solely reflect UK-based companies.
Key Factors in FTSE 100 Price Changes
While there are numerous factors at play, we want to point out the main market-moving events. These three factors have the biggest impact on FTSE predictions.
Constituent Companies
The collective value of listed companies affects the value of the FTSE 100 on a daily basis. These companies have the biggest weighings:
- Royal Dutch Shell: A global group of energy and petrochemical companies
- British Petroleum: One of the world's largest integrated oil and gas companies
- AstraZeneca and GSK (GlaxoSmithKline): International pharmaceutical companies
- British American Tobacco: The world's largest tobacco group
- Rio Tinto: A leading global mining group
- HSBC: One of the largest banking and financial services institutions
- Unilever: Multinational consumer goods
Economic Recovery and Improved Outlook
Vaccination programmes are continuing at pace, lockdown restrictions are easing and additional support was announced in the Budget. All of these lead to a much more positive outlook than anyone could have expected 12 months ago.
The Organisation for Economic Cooperation and Development (OECD) expects growth for the global economy. As for the UK specifically, it appears that the economy will be less 'scarred' than expected. With the FTSE 100 being so tied to the wider UK market, it should follow the same upward path.
Pound Sterling Fluctuations and Inflation
In the post-Brexit era, FTSE 100 companies receive over 70% of their revenues from overseas. It may be surprising, but the drop in the value of the pound sterling increases corporate earnings due to the converted revenue.
For example, if the US dollar strengthens against the pound due to stimulus optimism, the FTSE 100 trades higher. Similarly, a strengthening EUR against GBP gives the index a boost as a significant portion of revenue comes from France, Germany and Italy.
Historical Performance of the FTSE 100 Index
Over the several decades that the FTSE 100 index has been around, a lot has happened. But taking a glance at the price chart, it's clear that its price has consistently moved upward, as has the UK economy.
One of the biggest hurdles was in 1998 amid the global financial meltdown. But it didn't stop the FTSE 100 from rising to its all-time high of 6930.20 on 26 December 1999.
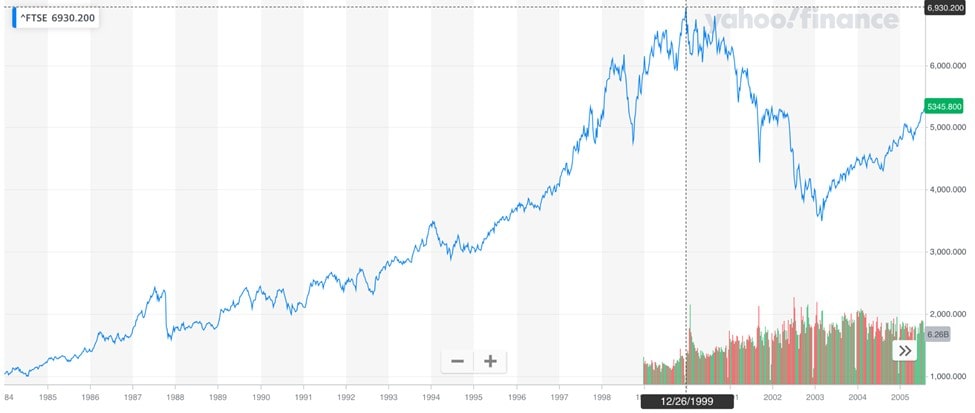
After the collapse of the tech bubble and the September 11 attacks, the index's price found itself at around 4430. After a short-lived recovery to over 5,300 in 2002, the market fell again in 2003. In February 2003, the FTSE 100 fell below 3,500.
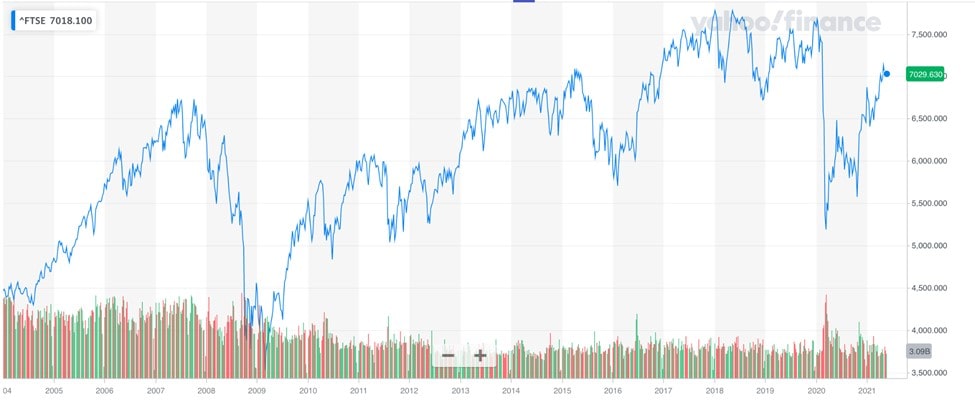
The period between 2005 and 2015 was characterised by noticeable fluctuations inside a long-term uptrend. The stock market sell-off in 2015-2016 didn't leave the FTSE 100 untouched. Even though the companies listed remained relatively strong, the index price fell from 7,000 to 5,700.
The price rose to a higher range (above 7,500) and was disrupted in 2020 by the spread of COVID-19.
How Is the FTSE 100 Performing Now?
London's FTSE 100 benchmark sharply declined during 2020, from 7,400 on 16 February to below 5,200 on 15 March. This was the worst performance since the financial crisis in 2008. But the wider UK market fell on a scale not seen since 1706.
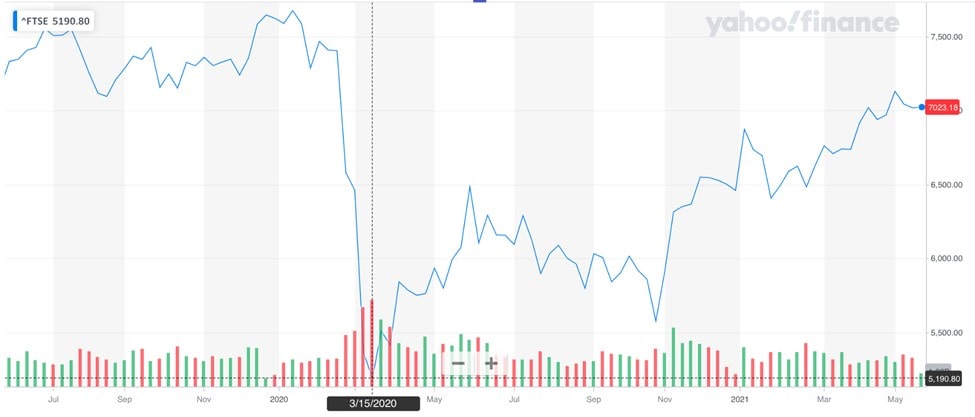
Over the course of 2020, the FTSE 100 gained a quarter of its price back, which is quite significant. It didn't take long for it to reach 6,000 and then 7,000.
The factors that worked against the FTSE 100 in 2020 — a deep recession and Brexit — started to fade into the background, giving the index a chance to bounce back. News of the COVID-19 vaccine was a catalyst for growth.
Now, let's move on to FTSE predictions for 2021 and beyond.
Short-Term FTSE 100 Price Prediction for 2021
The table below was sourced from Long Forecast, which uses AI and backtesting-based mathematical systems to forecast major turning points. Here, you can see where the index may achieve certain gain or loss benchmarks during the second half of 2021. The average price might even get close to 8,000, which it hasn't done since 2018.
|
Month |
Minimum Price (GBP) |
Maximum Price (GBP) |
Average Price (GBP) |
Total Change (compared to May 2021) |
|
June 2021 |
6558 |
7396 |
6977 |
0.10% |
|
July 2021 |
6785 |
7651 |
7218 |
3.56% |
|
August 2021 |
6938 |
7824 |
7381 |
5.90% |
|
September 2021 |
7069 |
7971 |
7520 |
7.89% |
|
October 2021 |
7075 |
7979 |
7527 |
7.99% |
|
November 2021 |
7159 |
8073 |
7616 |
9.27% |
|
December 2021 |
7517 |
8477 |
7997 |
14.73% |
Since constituents play a huge role in the FTSE 100's price formation, let's take a quick look at expectations for its biggest companies:
- Royal Dutch Shell: With 9 analysts offering 12-month price forecasts, the median estimate represents a 31.39% increase (compared to May 2021).
- Unilever: Out of 12 Wall Street analysts, there are currently 3 "Sell" ratings, 2 "Hold" ratings and 7 "Buy" ratings.
- BP: 23 Wall Street analysts have issued ratings for 2021, and there are 3 "Sells", 7 "Holds" and 13 "Buys".
- British American Tobacco:10 analysts are very hopeful about this stock, and one maintained a "Hold" rating.
- AstraZeneca: Even though this stock is going through a temporary consolidation, it received 14 "Buy" ratings.
Overall, these companies alone have the power to drive FTSE 100 further up.
FTSE 100 Predictions for the Next 5 Years
The 12-month forecast for the FTSE 100 index's performance in 2022 is provided in the table below. Long Forecast predicts a further rise with a drop towards the end of the year.
|
Month |
Minimum Price (GBP) |
Maximum Price (GBP) |
Average Price (GBP) |
Total Change (compared to May 2021) |
|
January 2022 |
7141 |
8053 |
7597 |
9.00% |
|
February 2022 |
7163 |
8077 |
7620 |
9.33% |
|
March 2022 |
7120 |
8028 |
7574 |
8.67% |
|
April 2022 |
6819 |
7689 |
7254 |
4.07% |
|
May 2022 |
6809 |
7679 |
7244 |
3.93% |
|
June 2022 |
7150 |
8062 |
7606 |
9.12% |
|
July 2022 |
7507 |
8465 |
7986 |
14.58% |
|
August 2022 |
7132 |
8042 |
7587 |
8.85% |
|
September 2022 |
6776 |
7640 |
7208 |
3.41% |
|
October 2022 |
6545 |
7381 |
6963 |
-0.10% |
|
November 2022 |
6720 |
7578 |
7149 |
2.57% |
|
December 202 |
6760 |
7624 |
7192 |
3.19% |
Despite the predicted decrease in September-December of 2022, the FTSE 100 is estimated to pick up steam in the coming years. We have collected FTSE 100 predictions for the next 5 years to show the likelihood of the asset rising/falling. Check out the details below.
|
Direction |
Probability |
|
Down at least 20% |
5% |
|
Down at least 10% |
6% |
|
Down |
8% |
|
Up |
92% |
|
Up at least 10% |
91% |
|
Up at least 20% |
90% |
|
Up at least 30% |
88% |
|
Up at least 40% |
85% |
|
Up at least 50% |
80% |
|
Up at least 100% |
63% |
|
Up at least 150% |
45% |
|
Up at least 200% |
17% |
Technical Analysis of the FTSE 100 Index
From a technical point of view, the big picture for the UK blue-chip index is positive, and the market is holding firmly. After a consistent bull trend since the latter part of last year, the recent sell-off can be considered a natural consolidation.
Where it gets more interesting for traders is technical indicators. There are diverse trading indicators, but the best ones for the indices market include:
- Moving Averages
- Exponential Moving Average Indicator
- Relative Strength Indicator
- Average Directional Index
- Stochastic oscillator Trading Indicator
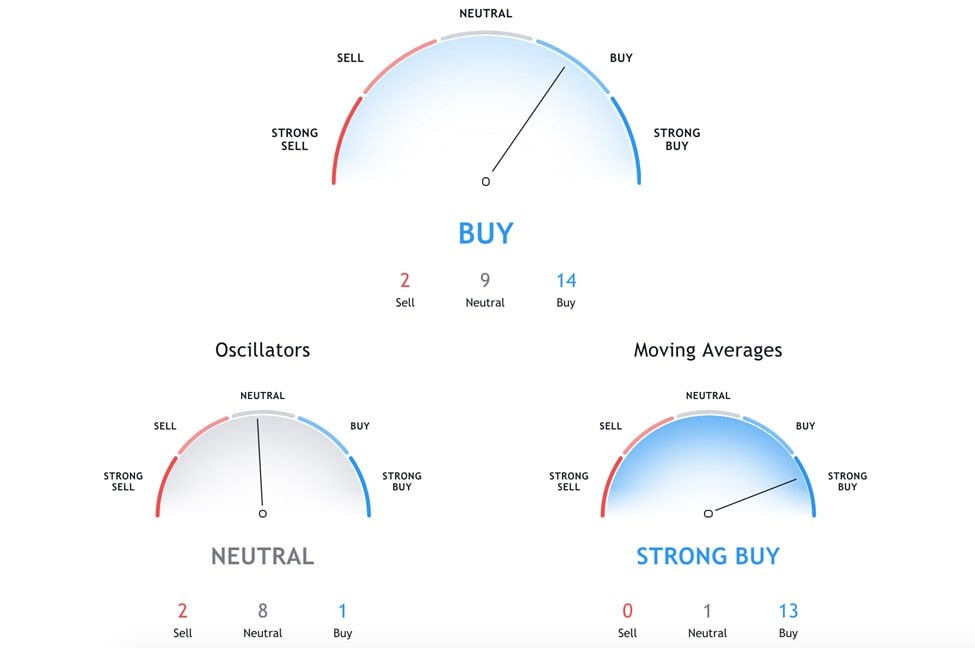
Before going through the details, here is a summary of what signal technical indicators are sending to traders for a 1-day timeframe.

Oscillators:
- Relative Strength Index (14) - 54.4 - Neutral
- Stochastic %K (14, 3, 3) - 62.1 - Neutral
- Commodity Channel Index (20) - 15.4 - Neutral
- Average Directional Index (14) - 19.2 - Neutral
- Awesome Oscillator - 48.4 - Neutral
Moving averages:
- Exponential Moving Average (50) - 6923.2 - Buy
- Simple Moving Average (50) - 6919.1 - Buy
- Exponential Moving Average (100) - 6784.7 - Buy
- Simple Moving Average (100) - 6788.0 - Buy
- Exponential Moving Average (200) - 6629.5 - Buy
- Simple Moving Average (200) - 6457.8 - Buy
The UK 100 Index is still below its pre-pandemic levels; it has to make up another 10% to catch up to where it was. For comparison, we put the S&P 500 as another popular index, which is trading 35% higher than the FTSE 100.
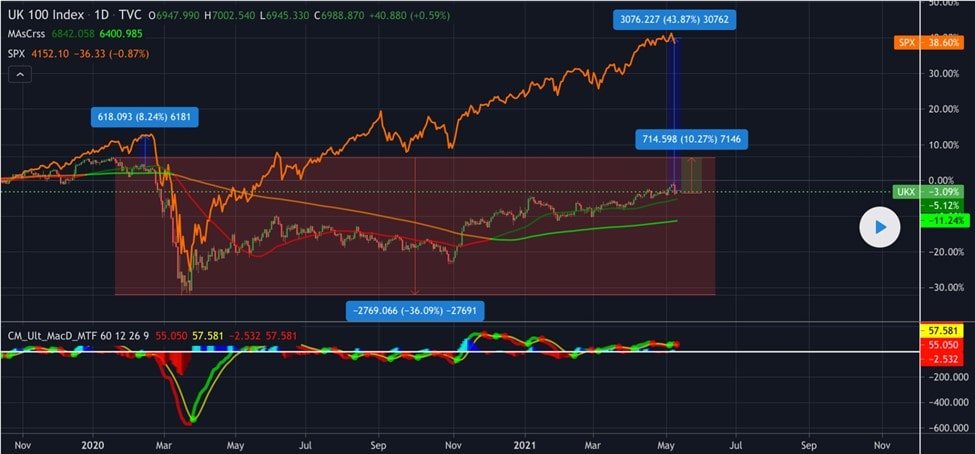
The speed of MA crossovers signals that the market is slightly overbought. Also, key support and resistance levels that you should watch out for are listed below:
- S1 - 6947.09
- S2 - 6972.64
- S3 - 6999.78
- R1 - 7052.47
- R2 - 7078.02
- R3 - 7105.16
If the FTSE 100 crosses above 7,000, the resistance will be pushed higher, and we might see it climb to the top since the pandemic began at 7,167.
What Do Experts Think About the FTSE 100?
UBS set its price point for the end of 2021 at 7,200. Compared to the 6,460 mark at the end of 2020, this is quite an achievement in the context of economic disruption. Analysts at HSBC investment bank also shared a positive view.
According to these analysts, the reason for such a positive outlook comes from the anticipated growth of United Kingdom firms' valuations after fighting through twenty-year lows. In addition, they expect the pound to surge along with the equity market.
Andrew Slimmon, Head of Applied Equity Advisors Team at Morgan Stanley, recently noted that historically, the second year of a newly formed bull market shows higher performance. While investors saw poor stock market returns last year, the possibility of the coronavirus pandemic soon being behind us can create more volatility along the way.
Taking lessons from 2009-2010, Andrew Slimmon added that stocks would likely need to take a breather, much as they did back then. So, the growth might not be explosive, but overall returns should be fair.
What to Do With the FTSE 100: Trading vs Investing?
Hopes for the global economic recovery have certainly helped stock markets at the start of 2021. Now, the FTSE 100 has an even stronger standing than some of its biggest overseas counterparts. Based on further forecasts, the index could become a timely addition to an investing portfolio.
As the FTSE 100 started recovering from its drop in March 2020, many investors were too slow to react and bet on it. The market climbed significantly before the bears turned into bulls. If you don't want to miss out on future opportunities, trading may be the best and fastest way to capitalise on its rise. While returns are not guaranteed, the data and historical performance suggest lucrative leveraged trading possibilities.
If you're considering getting into CFD trading to take advantage of this year's top performers, there's no better way to start than with Libertex. Create a demo account for a risk-free opportunity to put your knowledge into practice. After you become more familiar with all the tools available to you, you can turn to live trading to potentially see great returns.
FAQ
Is the FTSE 100 a Good Investment in 2021?
FTSE 100 companies have always been considered high-quality investments since these are the strongest ones in the UK market. Therefore, Britain's blue-chip stock index may be a good investment in the new bull market that is forming this year.
Is the FTSE 100 Worth Buying?
The FTSE 100 recently hit fifteen-month highs, and there's no indication of a reversal amidst this outperformance of expectations. Analysts say that the odds are increasing on positive returns, which gives an indication that the FTSE 100 is a "Strong Buy".
What Will the FTSE 100 Be Worth in 2025?
Based on historical price-based estimations, there is a 90% chance of the FTSE 100 price rising by at least 20%. Moreover, there's a 63% chance of the index at least doubling in price in the next several years.
Disclaimer: The information in this article is not intended to be and does not constitute investment advice or any other form of advice or recommendation of any sort offered or endorsed by Libertex. Past performance does not guarantee future results.
Why trade with Libertex?
- Get access to a free demo account free of charge.
- Enjoy technical support from an operator 5 days a week, from 9 a.m. to 9 p.m. (Central European Standard Time).
- Use a multiplier of up to 1:30 (for retail clients).
- Operate on a platform for any device: Libertex and MetaTrader.