What Is Heikin-Ashi, and How Is It Used in Trading?
Prepared by the Libertex team
Content reviewed internally in accordance with regulatory standards.
There are plenty of leading indicators that require a particular configuration, additional settings and complicated calculations. However, not many traders know about one of the simplest indicators that depict such well-known candlesticks: Heikin-Ashi.
What is the essential part of almost any trade? Finding a trend. And Heikin-Ashi helps do just that. Read on to learn how to get signals from one of the most straightforward forex indicators.
Heikin-Ashi: The Basics
As you can see from the name of the indicator, it is related to Japan. Translated from Japanese, Heikin-Ashi means "an average bar." Every trader knows the famous Japanese candlesticks because, no matter what security you trade, you're likely to use a chart with Japanese candlesticks. However, there are other types of charts, and Heikin-Ashi is one of them. Furthermore, this technique is both a chart type and an indicator.
Heikin-Ashi candlesticks look like usual Japanese candlesticks but remove market noise.
Munehisa Homma created this approach in the 1700s. And while Heikin-Ashi candlesticks may resemble regular Japanese ones, the indicator makes the chart more readable and helps determine a strong trend. Would you like to know how it works? Let's look at the example below.
Heikin-Ashi Candles: Example
We prepared an example to make it easier to understand. We took a 1-hour chart of the EUR/USD pair and applied the Heikin-Ashi index to the chart with regular Japanese candlesticks.
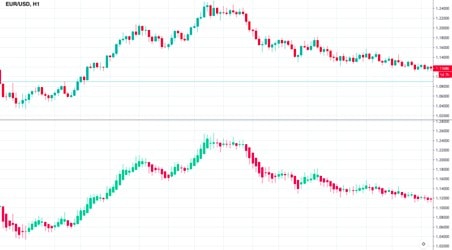
The upper chart is the Japanese candlestick chart; the bottom one is the Heikin-Ashi candlestick.
The Heikin-Ashi chart has a smooth effect because it averages the price movement. Moreover, if you look at the candlestick colours, you'll see they don't match. This happens because Heikin-Ashi depicts the whole bullish trend in a bullish colour (green on our charts) and the bearish trend in a bearish colour (red on our charts).
If you look at the candle wicks, you'll see that most Heikin-Ashi candlesticks don't have shadows, which signals a strong trend. The current price of the asset you're trading may differ from that of the Heikin-Ashi one. Additionally, Heikin-Ashi charts don't reflect price gaps.
Heikin-Ashi: Learn the Core
To better understand the essence of the indicator, let's consider several points that will clarify how Heikin-Ashi works.
Let's Calculate
The Heikin-Ashi is mostly used to smooth the market and get rid of market noise. As we continue comparing Japanese and Heikin-Ashi candlesticks, let's reiterate that Japanese candlesticks show the open, close, high and low price points for a specific period.
The aim of the Heikin-Ashi is to serve as a trend indicator.
That's why it needs a particular formula:
- To calculate the open price, you need to add the open (previous bar) and close (last bar) prices and divide the sum by 2.
- To calculate the close price, you need to add the open, high, low, and close prices and divide the sum by 4.
- To get the high, you need to get the maximum from the high, open or close price of the current period.
- To get the low, you need to get the minimum of the low, open, or close of the current period.
Even though the formula doesn't look complicated, you won't need to calculate any point because the indicator is automatically built in.
How to Use It
The Heikin-Ashi chart is available on all trading platforms. For MetaTrader, find the 'Insert' window, click the 'Indicators' tab and then choose 'Custom'. Heikin-Ashi will be on the list.
At the same time, Heikin-Ashi can be implemented as a chart type. Just switch Japanese candlesticks to Heikin-Ashi.
Heikin-Ashi: Catch Its Signals
Heikin-Ashi clearly reflects the tendency prevailing in the market, allowing a trader to decide whether to keep their position open or close it if the trend has paused. As such, we can highlight two main things the indicator shows.
Trend Strength
The first indicator's function is to measure the strength of the trend. Any small consolidation or correction is barely visible on the chart because the indicator smooths it out. To trade in the trend with Heikin-Ashi, it's recommended to use a trailing stop to widen your rewards while trading within the trend.
With a strong trend, a trader can keep their position open and benefit from it.
- Bullish trend. It's unlikely you'll find lots of Japanese candlesticks without shadows. However, it's a common thing for Heikin-Ashi. If you see lots of bullish candlesticks without a lower shadow, it's a strong signal of an uptrend.
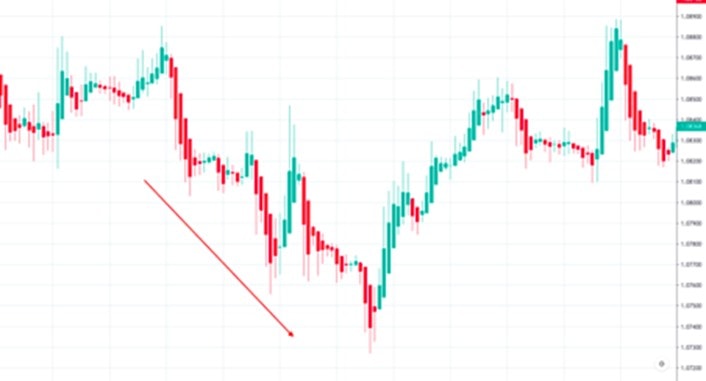
- Bearish Trend. The opposite rule applies to a bearish trend. Bearish candlesticks without upper wicks signal a strong downtrend.
- Triangles. If you're familiar with the triangle pattern applied to Japanese candlesticks, you won't have difficulties finding the pattern on the Heikin-Ashi indicator. There are three types of triangles: ascending, descending and symmetrical. If the indicator breaks above the upper boundary of the ascending or symmetrical triangle, the upper trend will continue. If the candlesticks fall below the bottom line of the descending triangle, the downtrend will strengthen.
Trend Reversal
A reversal signal helps the trader to determine when to exit the previous trend-following trade and enter the new trend. This will help the trader avoid losses and give them an opportunity to enter a new trade fast.
Trend reversal will prevent traders from losses and will help to enter a trade fast.
- Doji candlestick. A doji candlestick (a candlestick with a small body and long shadows) always signals uncertainties in the market. For Heikin-Ashi, this kind of candlestick is a sign of a trend reversal.
- Wedges. A wedge is an indicator that differs very little from the triangle. There are two types of wedges: rising and falling. If you see the rising wedge on the indicator, wait until a candlestick breaks below the indicator's bottom line. If you find a falling wedge, wait for the price to break above the upper line, the bearish trend will reverse.
Heikin-Ashi Charts: Analysis
If the rules seem complicated, let's consider a real example.
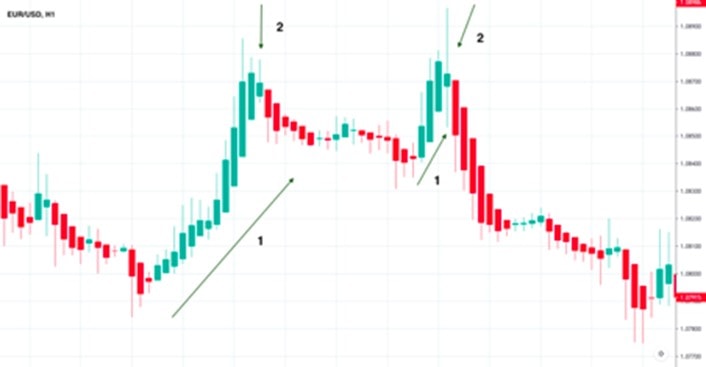
- As we can see here, the pair formed a strong uptrend on the 1-hour chart. Bullish candlesticks didn't have lower shadows.
- Candlesticks at point 2 are doji candlesticks that have small bodies and long shadows. They signalled a trend reversal. As we consider the short-term timeframe, the trend may change often.
How to Combine with Indicators
Because the Heikin-Ashi is a trend indicator, you should use other trend indicators to strengthen its signals. Moving Averages and Parabolic SAR are among the most reliable trend indicators that can help you get a confirmed signal.
Combine Heikin-Ashi with other indicators to get stronger signals.
If we talk about trend reversals, you should use an indicator that can determine the change in price direction, such as the RSI indicator, MACD indicator or Awesome Oscillator.
Benefits and Limitations
As with any other indicator, Heikin-Ashi has its advantages and disadvantages. It's important to note that it has more pros than cons.
|
Benefits |
Limitations |
|
Ease. It's one of the most accessible indicators to understand. First, it doesn't require a particular configuration. You can find the indicator on any trading platform. Secondly, it's easy to read its signals; any trader, even a newbie, can work with Japanese candlesticks and their patterns. |
Gap. There is no indicator that wouldn't lag in time because all of them base signals on historical price movements. The same applies to the Heikin-Ashi; the indicator stays behind the price. |
|
Strong signals. Heikin-Ashi is one of the most reliable indicators because it uses only historical price movements that give precise results. |
|
|
Filter. The indicator filters out market noise and reduces small corrections. |
|
|
Ability to combine. Because the indicator can provide signals on trend strength and market reversal, it's possible to combine it with almost all chart patterns and indicators. Combining indicators will provide you with more reliable signals. |
|
|
Any timeframe. A significant advantage of the indicator is the opportunity to use it on any timeframe. However, signals on bigger timeframes are more reliable. |
The Best Heikin-Ashi Trading Strategy
In this example, we'll consider a strategy with a buy signal. To apply the same strategy for the sell signal, do opposite steps.
Step 1. Find a strong bearish trend.
Step 2. Wait until the bearish Heikin-Ashi candlestick changes to bullish. The first bullish Heikin-Ashi candlestick should have a long upper shadow.
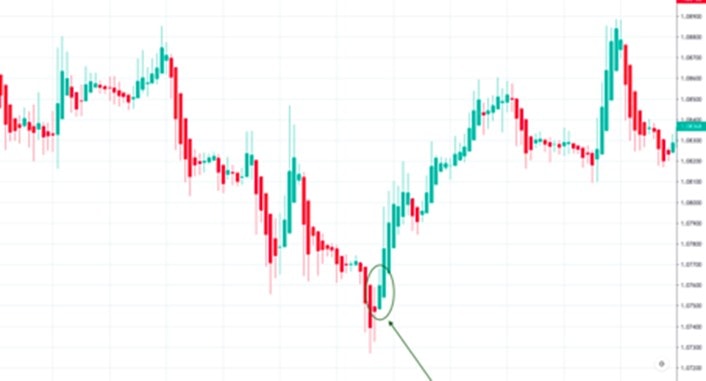
Step 3. Open a long position at the next Heikin-Ashi candlestick.
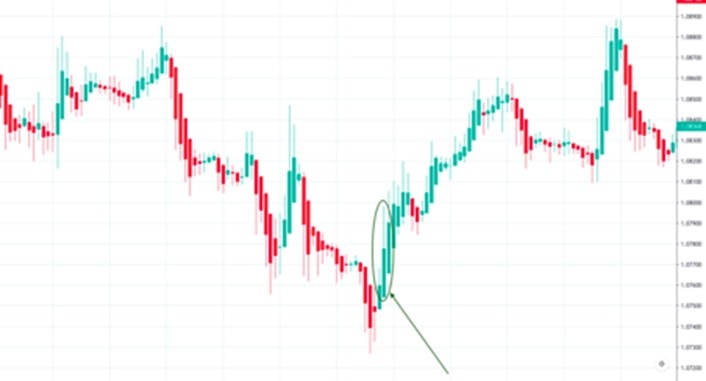
Step 4. Remember about the Stop-Loss. It should be placed below the low of the first bullish candlestick.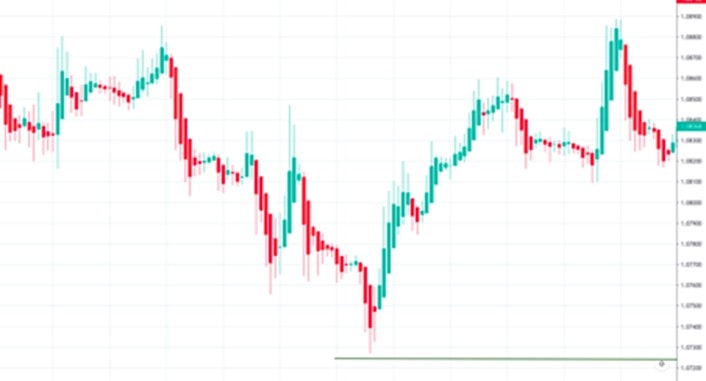
Step 5. It's time to close the trade as soon as the Heikin-Ashi candlestick approaches the level of the previous bullish candlestick.
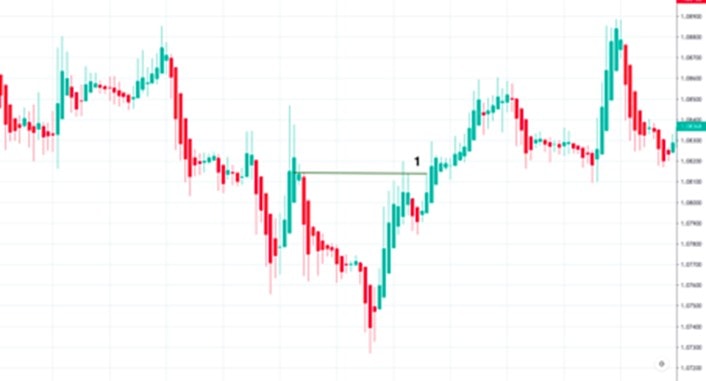
Step 6. Take potential profit.
Tips for Traders
Here is our best trading advice when it comes to using Heikin-Ashi:
- Combine. Although the indicator is one that provides the most trustworthy signals, just like with any indicator, it has time lags. So, to avoid missing a good signal, it's essential to get additional confirmation.
- Larger timeframe, more definite trend. As you may know, the trend is stronger on bigger timeframes. Although the indicator works perfectly on any timeframe, it's recommended to use it on bigger ones (from H1).
- Don't confuse Japanese candlesticks with Heikin-Ashi candlesticks. Although it seems there aren't many differences between these types of candlesticks, as we said above, the Heikin-Ashi chart doesn't have gaps, and most candlesticks don't have upper or lower shadows. Moreover, the colour of the current Japanese candlestick may differ from the current Heikin-Ashi candlestick. Thus, you may get a fake signal if you confuse the charts.
Conclusion
To conclude, Heikin-Ashi is one of the most reliable and easiest-to-use indicators for forex trading. Since most traders know how to read Japanese candlesticks, every trader will be able to catch the signals of this indicator quickly. However, before you start using the indicator for real trades, it's worth training on a demo account.
Libertex provides traders with a demo account that fully duplicates the real market. It doesn't matter if you don't trade for real; you can use the whole range of indicators and feel the atmosphere of the actual market.
Let's answer the most frequently asked questions.
FAQ
Is Heikin-Ashi Reliable?
Heikin-Ashi is one of the most trustworthy indicators because it uses only previous movements, which is the most reliable approach. However, you should remember that there is no perfect indicator or pattern that will 100% guarantee a result. That's why we recommend applying Heikin-Ashi with other patterns or indicators.
What Is The Difference Between Heikin-Ashi and Japanese Candlesticks?
The primary difference is the formula. Japanese candlesticks show the price chart itself with its open, close, high and low prices. Heikin-Ashi, on the other hand, removes the price noise, giving you a clear trend without small corrections.
How Do You Use Heikin-Ashi?
There are two primary functions for Heikin-Ashi: determining the strength of the trend and its reversal.
Where Can I Get a Heikin-Ashi Chart?
Any trading platform has the Heikin-Ashi chart, which is simply part of the main chart as an indicator or alone as its own chart. If you use MetaTrader, you should open the 'Insert' window, click 'Indicators', then select 'Custom' and choose Heikin-Ashi. Or, you can simply replace the Japanese candlestick chart with the Heikin-Ashi one.
How Are Heikin-Ashi Candlesticks Calculated?
Here's the basic formula:
- If you need to calculate the open price, add the open (last bar) and close (last bar) prices and divide the amount by 2.
- To calculate the close price, add the open, high, low and close prices and divide the sum by 4.
- To get the high, you need to get the maximum from the high, open or close price of the current period.
- To get the low, you need to get the minimum of the low, open, or close of the current period.
How Do You Trade Heikin-Ashi Candlesticks?
All you have to do is determine whether candlesticks are bearish or bullish. If they're bearish, you have a downward trend. Remember that if bearish candlesticks don't have upper shadows, the trend is more robust. Bullish candlesticks reflect the uptrend and, if they don't have lower shadows, the trend is more reliable. If you see a doji candlestick, you should expect a trend reversal.
Disclaimer: The information in this article is not intended to be and does not constitute investment advice or any other form of advice or recommendation of any sort offered or endorsed by Libertex. Past performance does not guarantee future results.
Why trade with Libertex?
- Get access to a free demo account free of charge.
- Enjoy technical support from an operator 5 days a week, from 9 a.m. to 9 p.m. (Central European Standard Time).
- Use a multiplier of up to 1:30 (for retail clients).
- Operate on a platform for any device: Libertex and MetaTrader.