Japanese Candlesticks: Find Reliable Signals
Prepared by the Libertex team
Content reviewed internally in accordance with regulatory standards.
Charts come in all shapes and sizes, but most traders prefer Japanese candlesticks. In general, candlesticks provide the full range of information a trader needs to make a successful trade. Moreover, they combine patterns that serve as reliable signals of the market's direction. To know more about the most trustworthy patterns and candlesticks' signals, read on.
Japanese Candlesticks: History
Japanese candlesticks are one of the chart types that represent traders' sentiment. It was developed by Homma, a Japanese man, in the 18th century. At that time, this type of chart showed the relation between the price and supply/demand for rice.
The Western world found out about candlesticks in 1991 when Steve Nison published his book Japanese Candlestick Charting Techniques.
What Is a Japanese Candlestick?
Japanese candlesticks are the most comprehensive type of chart that shows crucial price points: open, close, high and low. If we look at other types, such as the line chart, we'll notice that it only connects dots of closing prices. As such, it provides a lack of useful information for trading.
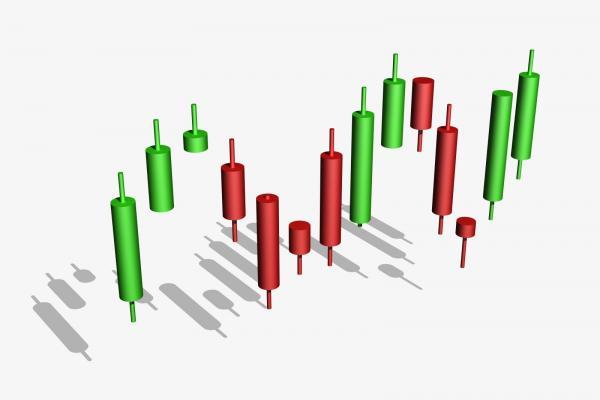
Japanese candlesticks are a type of chart that provides useful information on market dynamics.
One candlestick reflects the price's dynamics within a particular period. The period, in turn, depends on the timeframe you use for trading.
Japanese Candlestick: What It Looks Like
A candlestick looks like a bar (body) with or without thin lines (so-called shadows). The body is a range between two major points: the open and close prices. Shadows are placed above (upper shadow) and below (lower shadow) the body and correspond to the highest and lowest price points.
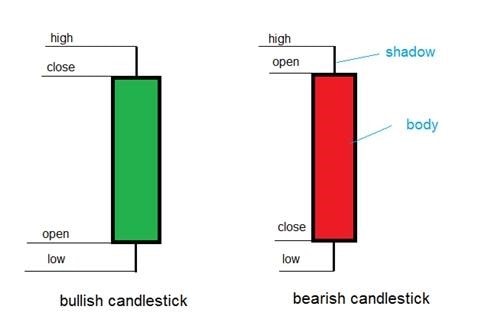
Candlesticks have two colours. Usually, traders use either black and white or green and red schemes. So, if the candlestick is white or green, it's bullish and means the price was growing within the chosen period. If it's black or red, it's bearish and reflects a downward price direction within the selected period. Trading platforms usually allow you to choose the colours you like.
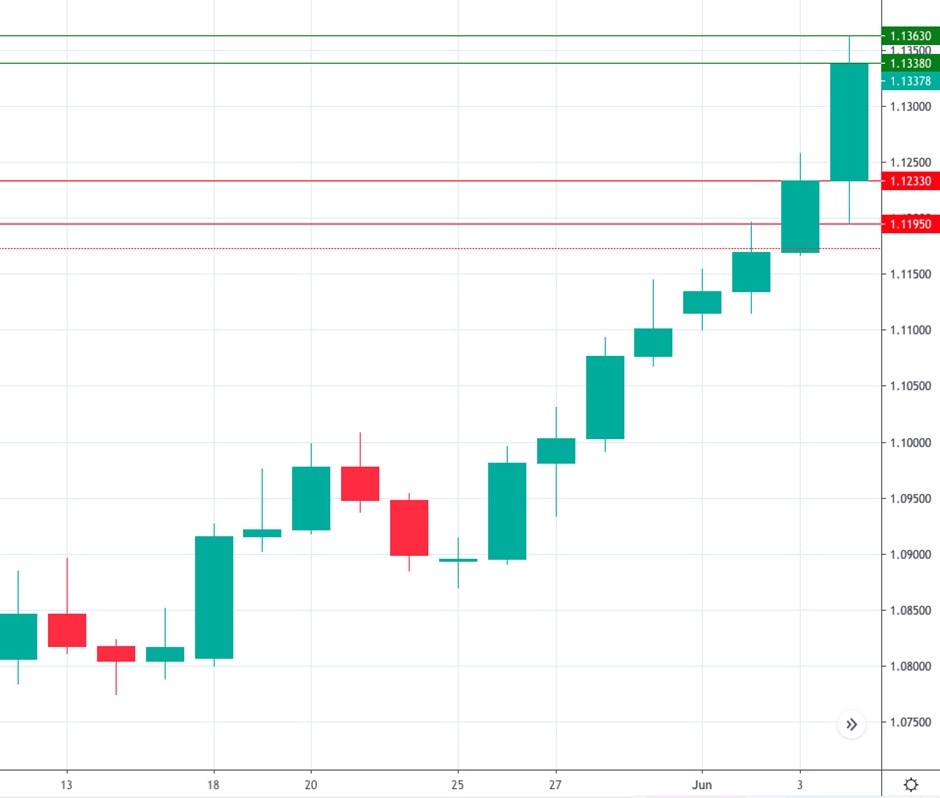
To learn how to read candlestick charts, let's look at the example. You see a bullish candlestick (it's green) and choose the EUR/USD pair and a 1-hour timeframe. That means you know how the price of an asset rose within one hour.
The highest point, 1.1363, represents the highest price within one hour. The close price is 1.1338, i.e., the level at which the candlestick closed after one hour passed. The open price is 1.1233; that's the price at which EUR/USD opened. The lowest point the EUR/USD pair reached within one hour is 1.1195.
In the previous example, we looked at a bullish candlestick. If you see a bearish one, it will have a different colour, and open and close prices will be inverted (the open price will be above the closed one).
However, the whole chart consists of many candlesticks, so you have the entire picture of the asset's price movement.
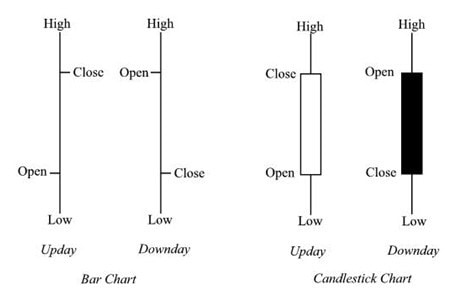
Japanese Candlesticks and the Bar Chart
Although both types provide information on four crucial price points, Japanese candlesticks are more convenient. Previously, bars were depicted only in black, but now, traders can use the same colours as Japanese candlesticks. If you use the black and white scheme, it's difficult to understand whether bulls or bears are dominant in the market.
When looking at candlestick chart patterns, it's hard to determine the bar's size. The length of the shadows is difficult to define, too. Thus, bar charts are not the best option for trading patterns.
Japanese Candlesticks: Types
There are different types of candlesticks. As we said at the beginning of the article, candlesticks can come either with or without shadows. On top of that, they can have one or two shadows.
Doji
A doji candlestick has a tiny body, which means the open and close prices were at nearly the same level. It usually has long shadows. A doji candlestick is always a sign of uncertainty among traders.
Doji doesn't provide strong signals itself and is considered a 'neutral' candlestick. However, it can be a part of a reliable pattern. If it follows a series of bullish candlesticks, it's a signal that bulls have become exhausted, and a trend reversal may happen soon. If doji comes from several bearish candlesticks, it's a sign of bears' weakness and a possible reversal upward.
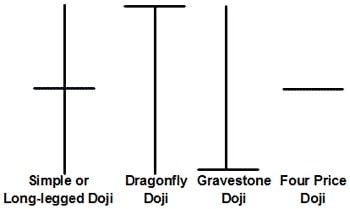
At the same time, there are four kinds of doji candlesticks.
- A long-legged doji has long upper and lower shadows of almost the same length. This type reflects great indecision among investors.
- A dragonfly doji is a strong bullish reversal candlestick that appears at the end of a bearish trend. It has a long lower shadow.
- A gravestone doji is the opposite of a dragonfly doji; it occurs at the end of a bullish trend and has a long upper shadow.
- A four-price doji is very rare, but it shows total market uncertainty and has no shadows.
Shadows
The length of a shadow represents the strength of market fluctuations. So, if a candlestick has long shadows, it means high volatility occurred during the trading session. If the shadow is short, it means the market was stable.
- Long upper shadow. If a candlestick has a long upper shadow and a short lower one, it shows that bulls were more active during the session. Still, they couldn't stay in control, and the bears managed to pull the price lower.
- Long lower shadow. If a candlestick has a long lower shadow and a short upper one, it means bears dominated the market, but bulls were stronger at the end of the session and pushed the price up.
Spinning Tops
The spinning top looks like a doji candlestick, but the body of the spinning top is more significant. This type of candlestick has long shadows and reflects uncertainty in the market, but it means both buyers and sellers were active, though neither group could remain in control. Like doji candlesticks, if the spinning top follows bullish candlesticks, it's a sign of a possible reversal downward. If the spinning top appears after bearish candlesticks, you can expect a reversal upward.
Marubozu
A Marubozu candlestick doesn't have upper or lower shadows. When an open price is the same as the low, and a close price is the same as the high, it's a bullish Marubozu. On the contrary, if the open price is the same as the high, and the close is similar to the low, it's a bearish Marubozu.
Japanese Candlesticks: The Most Effective Patterns
Japanese candlesticks are not only a chart type; they're also one of the most effective tools a trader can use in technical analysis. Candlestick patterns are widely used and provide reliable signals because they can be easily found on the chart and occur often.
Candlestick patterns are widely used and provide reliable signals.
Candlestick patterns can be divided into reversals and continuations. Because there is a vast number of them, we'll consider the ones that appear more frequently.
Reversal Patterns: Bullish
Bullish reversal patterns occur at the end of a downward trend and signal reversal upward.
Hammer
This is a pattern that consists of one candlestick with a long lower shadow that should exceed the body at least two times. The colour of the candlestick isn't essential, but if it's bullish, the signal is more robust.
The signal is also more reliable if the candlestick after the hammer closes above the open price of the candlestick before the hammer.
Inverted Hammer
This is a one-candlestick pattern. The candlestick has a small body and a long upper shadow that surpasses the body twice. The colour of the hammer doesn't matter. Still, if it's bullish, the signal is more reliable.
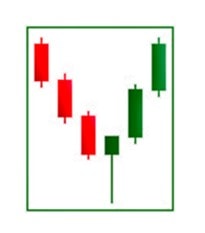
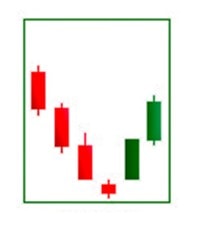
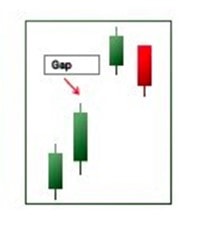
Morning Star
This pattern consists of three candlesticks. The first one is a long bearish one. The next one should open with a gap down. The colour of the second candlestick doesn't matter, but it's preferable if it's bullish. The third candlestick should open with a gap up that must cover the previous downward gap.
The gap isn't necessary, but if it appears, the signal is more potent.
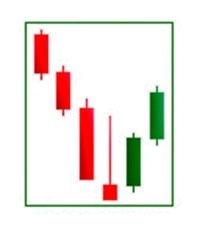
Morning Doji Star
This pattern is similar to the morning star, but the second candlestick is doji. It's thought to be more reliable than a simple morning star.
Bullish Harami
This pattern consists of two candlesticks. The first bearish one should fully contain the second bullish candlestick. To get confirmation, the third candlestick should be bullish and long.
Bullish Harami Cross
This pattern is similar to the previous one, but the second candlestick is doji.
Bullish Engulfing Pattern
This pattern has two candlesticks. The first one is bearish, and the second one is bullish. Its open price should be below the close price of the previous candlestick, and the close price should be above the open level of the previous candlestick. As such, the bullish candlestick absorbs the bearish one.
Reversal Patterns: Bearish
These patterns occur at the end of a bullish trend and signal downward movement.
Shooting Star
This is a pattern that is represented by one candlestick. It has a small body and an upper shadow, which is two times longer than the body. The colour doesn't matter, but if it's bearish, the chance the trend will turn downward is higher.
Evening Star
This is a three-candlestick pattern. The second candlestick opens with a gap upward after a big bullish candlestick. Usually, the second candlestick is small, and the third one is bearish and opens with a gap down that covers the previous gap up. However, gaps are not crucial.
Evening Doji Star
This is similar to the evening star pattern, with the only difference being that the second candlestick is doji. The evening doji star pattern is more reliable than the evening star.
Hanging Man
It may have a scary name, but this is a strong pattern. It's represented by one candlestick. The lower shadow exceeds the body two times. The colour doesn't matter, but the bearish one is preferable. However, to be sure a reversal happens, wait to see whether the next candlestick is bearish and closes lower than the candlestick before the hanging man.
Bearish Engulfing Pattern
This pattern consists of two candlesticks. The first one is bullish; the second is bearish. The bearish one should open above the bullish candlestick's high and close below its low. The strength of the signal depends on the candlesticks' size. If they are long, the sign is more durable.
Bearish Harami
The pattern has two candlesticks. The body of the second one should be 'included' in the first one. It's crucial that the candlesticks have different colours. The pattern should be confirmed by the bearish candlestick that appears after the second pattern candlestick.
Bearish Harami Cross
The pattern differs from the previous one only by its second candlestick, which is doji.
Continuation Patterns: Uptrend
Continuation patterns signal the strength of the current trend and predict its continuation.
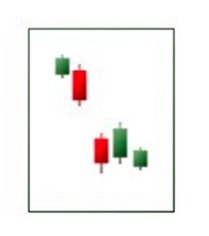
Upside Tasuki Gap
A bullish candlestick opens with a gap up but is followed by a bearish candlestick. The bearish candlestick should open and close below the close and open prices of the previous bullish candlestick. If the bearish candlestick doesn't cover the gap, there's a chance of a continuing uptrend. If the gap is filled, it's more likely the uptrend has ended.
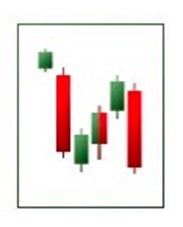
Rising Three Method
Two to five bearish candlesticks should follow a long bullish candlestick. However, none of them should close below the opening price of the bullish candlestick. On top of that, the shadows of the bearish candlesticks shouldn't be below the open price of the bullish candlestick. The last pattern's candlestick should open within the previous candlestick body and close above the first bullish candle's close price.
This pattern looks like the flag pattern.
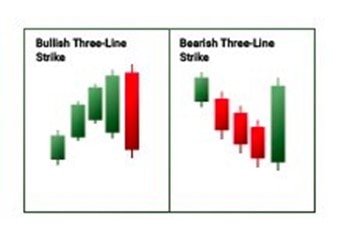
Three-Line Strike
There should be three bullish candlesticks moving progressively, followed by a big 'strike' candlestick that opens above the last bullish candlestick but closes below the first bullish candlestick of the three. All three candlesticks should have an average size. If they're small, the pattern won't work.

Continuation Patterns: Downtrend
These patterns signal the market will continue falling.
Downside Tasuki Gap
There should be a gap between two downward candlesticks. The third candlestick closes and opens higher than the second bearish one. If it doesn't cover the gap, the downtrend will continue.
Bearish Three-Line Strike
There should be three bearish candlesticks moving progressively and then a bullish 'strike' candlestick that opens below the close price of the last bearish candlestick and closes above the first bearish candlestick of the three.
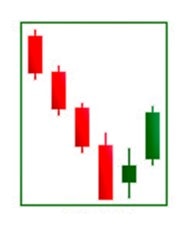
Falling Three Method
Two to five bullish candlesticks should follow the extended bearish candlestick. However, none of them should close above the open level of the bearish candlestick. Their shadows shouldn't be above the open price, either. The last candlestick of the pattern should open within the body of the last bullish candlestick and close below the first bearish candle's close price.
Japanese Candlestick Strategy
There are many strategies to try while trading because there's a wide range of candlestick patterns. We'll tell you about one of them, but before we start, here's a reminder of the main steps you should follow.
As we mentioned above, candlestick patterns relate to a trend. So, the first thing to do is to find a strong trend. The second step is to find a candlestick pattern. If you see the price approaching a support or resistance level, it's worth looking for a reversal pattern. If you're trading in a strong trend, find a continuation pattern.
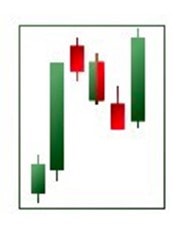
Third Candlestick Strategy
This strategy will work when the market turns to a bearish trend.
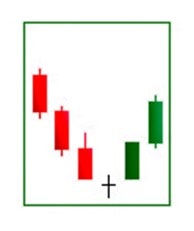
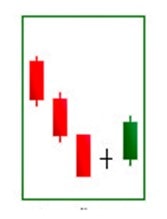
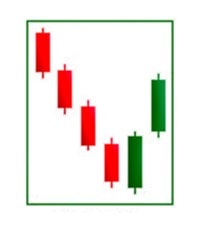
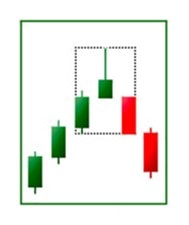
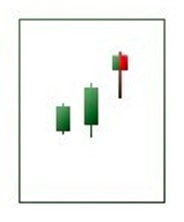
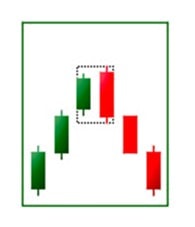
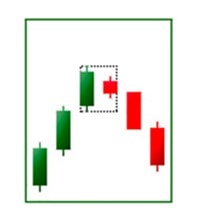
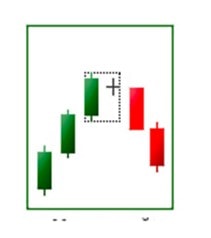
- Look for a candlestick whose high and low are above the previous candlestick's.
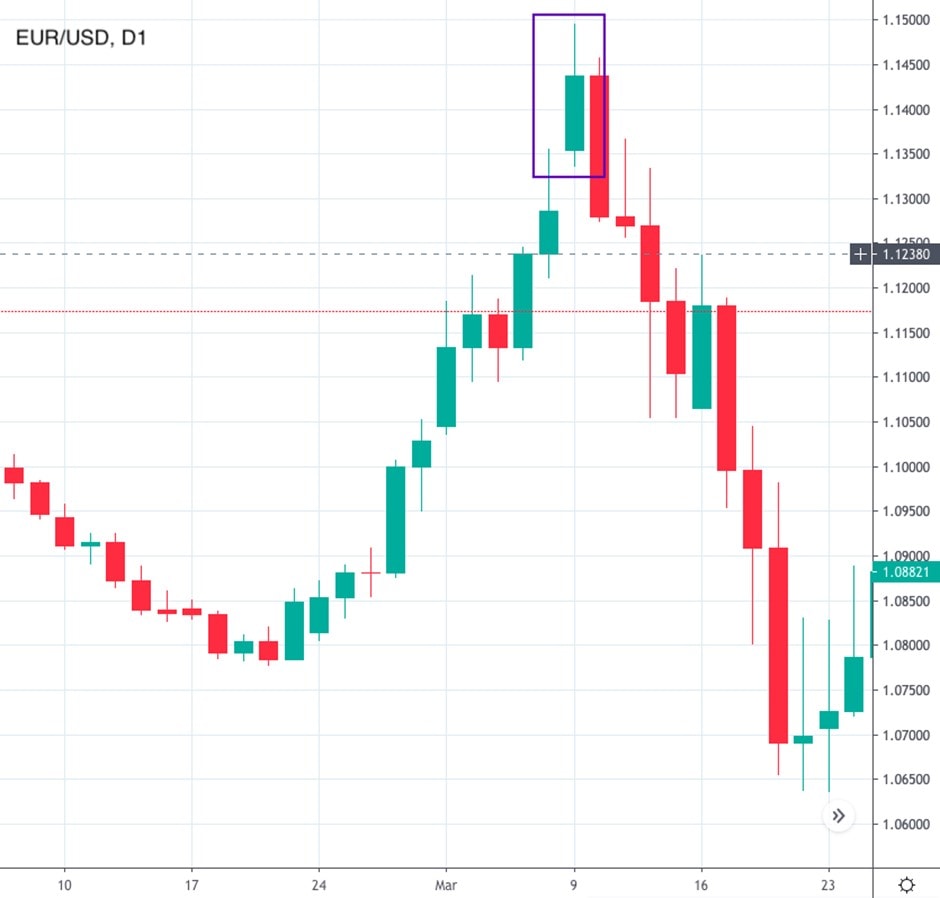
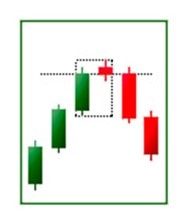
a candlestick whose high and low are above the previous one - Check that the next candlestick is bearish.
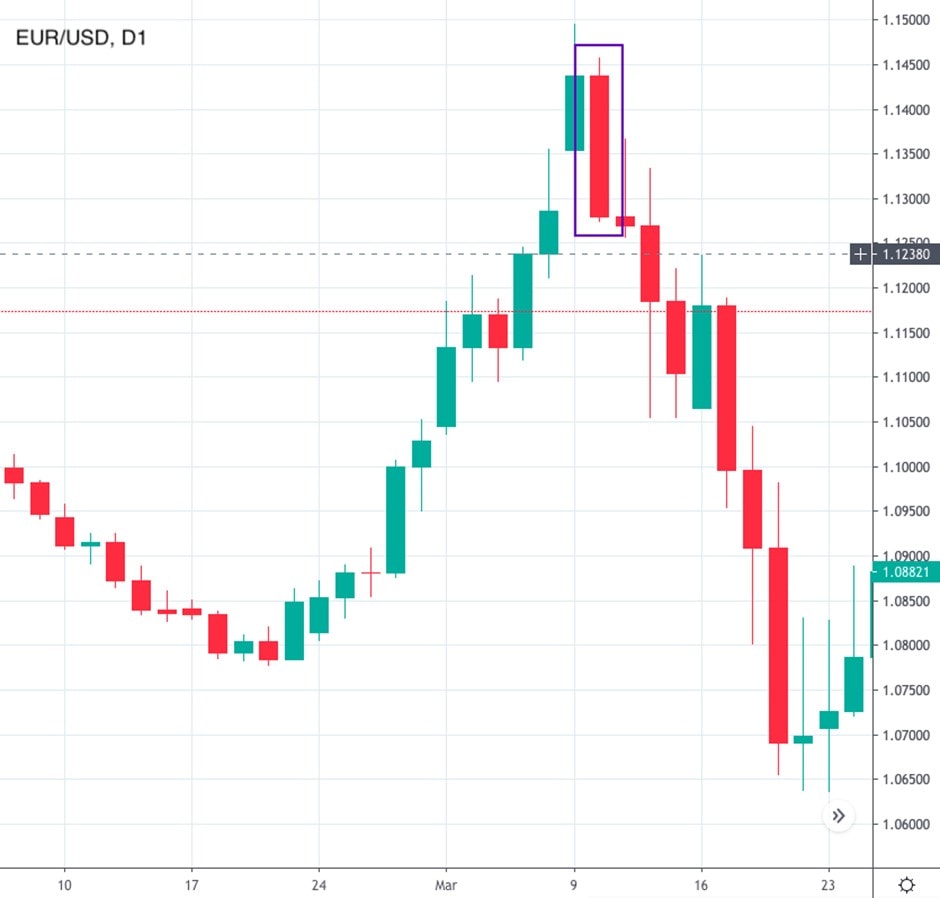
- A sell position should be opened at the open price of the third bearish candlestick (1). If you get a confirmation from another indicator — for example, an oscillator — the signal will be more reliable.
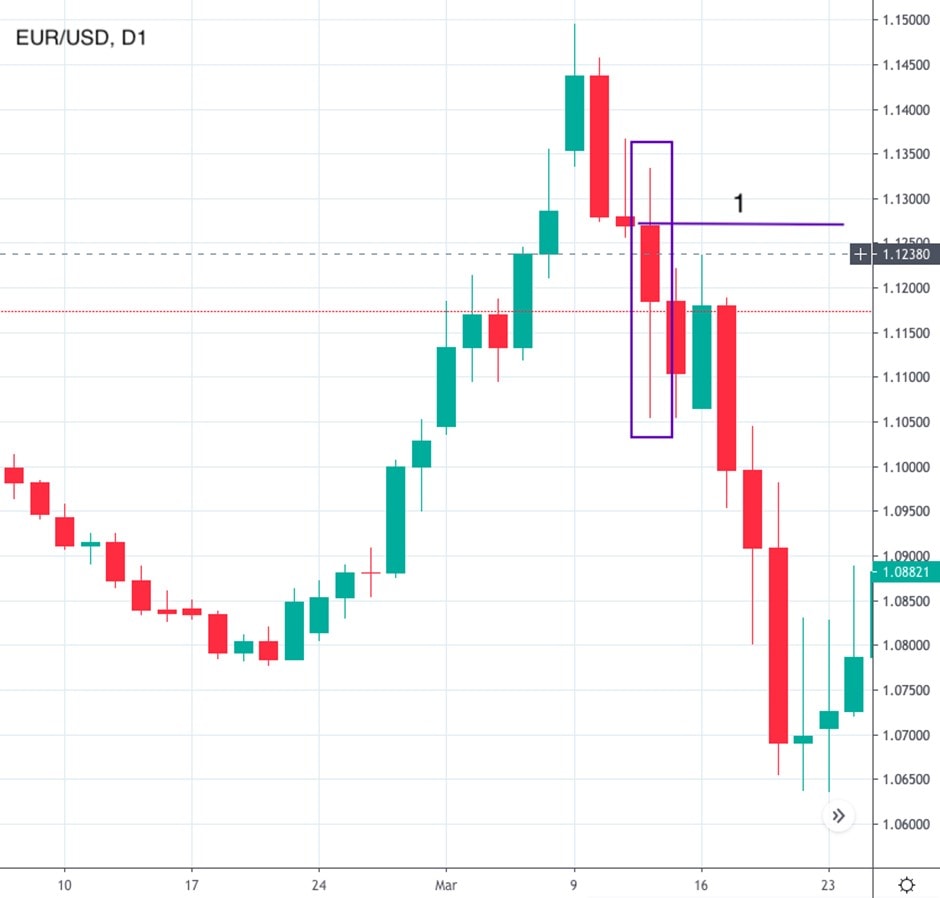
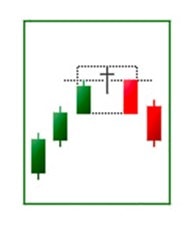
the third bearish candle (1) - Take profit as soon as the third candlestick closes (2).
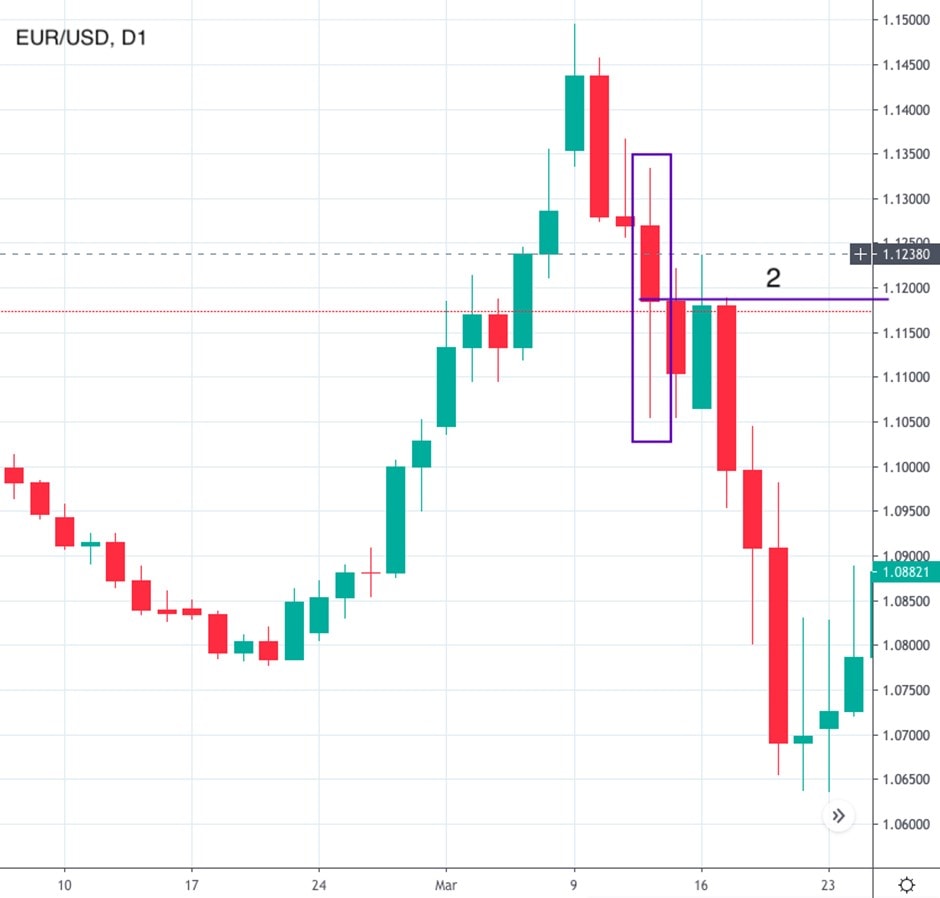
the third candle closes (2) - Remember that the stop-loss order should be placed above the high of the first candlestick (3).
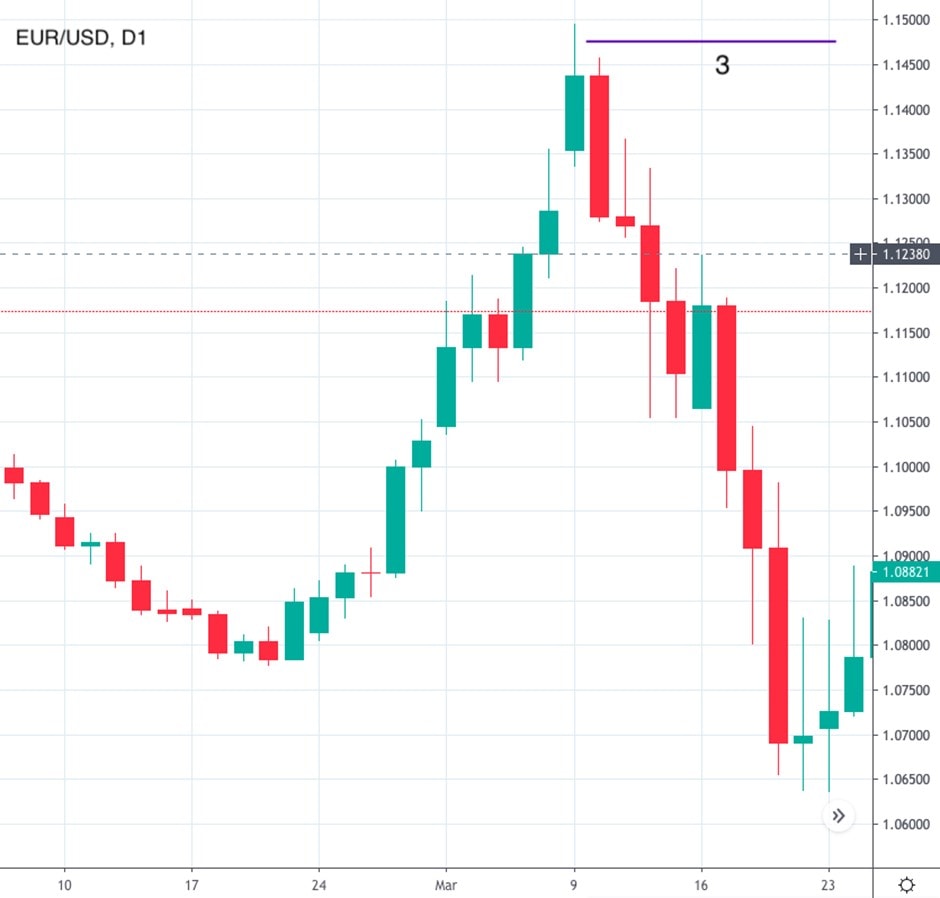
of the first candlestick (3)
Tips For Traders: How To Avoid Mistakes
There are plenty of guides on how to use Japanese candlesticks. And while their patterns are simple, many traders make mistakes. Check the tips below to avoid the most common mistakes.
- Find confirmation. Although candlestick patterns are strong, it's crucial to find approvals. If you need proof of the trend reversal, use such indicators as RSI and MACD. If the trend continues, look at the Parabolic SAR.
- Know the colour. It seems easy, but some traders confuse colours. We recommend using either green and red or white and black schemes.
- Choose bigger timeframes. Candlestick patterns work better on bigger timeframes because the trends for them are more reliable.
Conclusion
Japanese candlesticks are the most popular chart type because they show four crucial points that provide complete information to traders: the high, low, open and close points. Moreover, they form some of the most reliable patterns that predict the market's direction with a high level of accuracy.
Even beginners don't have a hard time finding patterns, but it's still crucial to practise before applying Japanese candlestick strategies in real trading. To get a little practice under your belt, you can use a Libertex demo account, which allows you to copy the real market with simulation money to gain more experience and avoid losses in the future.
Read the answers to the most frequently asked questions.
FAQ
What Are Japanese Candlesticks?
Japanese candlesticks are a type of chart that presents the investors' sentiments and the market's dynamics. They're also used as patterns that predict the market's direction.
Do Japanese Candlesticks Work?
Yes. Japanese candlesticks are one of the most reliable tools traders can use that provide strong signals and are easily identifiable on the chart.
Which Candlestick Pattern Is Most Reliable?
Several patterns provide the most reliable signals: the morning and evening stars, harami and hammer.
How Do You Read Japanese Candlesticks?
Japanese candlesticks have four main points: the open, close, high and low prices. These points reflect trader sentiment and market fluctuations. Candlesticks with short wicks indicate a stable market. Those with long shadows demonstrate high volatility.
Disclaimer: The information in this article is not intended to be and does not constitute investment advice or any other form of advice or recommendation of any sort offered or endorsed by Libertex. Past performance does not guarantee future results.
Why trade with Libertex?
- Get access to a free demo account free of charge.
- Enjoy technical support from an operator 5 days a week, from 9 a.m. to 9 p.m. (Central European Standard Time).
- Use a multiplier of up to 1:30 (for retail clients).
- Operate on a platform for any device: Libertex and MetaTrader.