MACD: Your Multifunctional Indicator
Prepared by the Libertex team
Content reviewed internally in accordance with regulatory standards.
When you ask traders to name a good technical analysis indicator, whether they're new to trading or seasoned professionals, they'll undoubtedly mention the MACD. It's one of the widely-used indicators that has many advantages.
The crucial benefit is that it gives many signals and can be used in different circumstances. Moreover, it's free and doesn't require any downloading. You can simply find it in MetaTrader and apply it to your chart. Let's take a closer look at the best indicator's implementation.
What Is the MACD Indicator?
MACD stands for Moving Average Convergence Divergence. It's a momentum indicator that follows the trend and shows the correlation between two moving averages of the asset's price.
Here, we need to clarify what the momentum indicator is. A momentum indicator calculates the change or speed of the asset's price movement.
The MACD indicator was developed by Gerald Appel in the late 1970s. The indicator's effectiveness has been time-tested and shown to work.
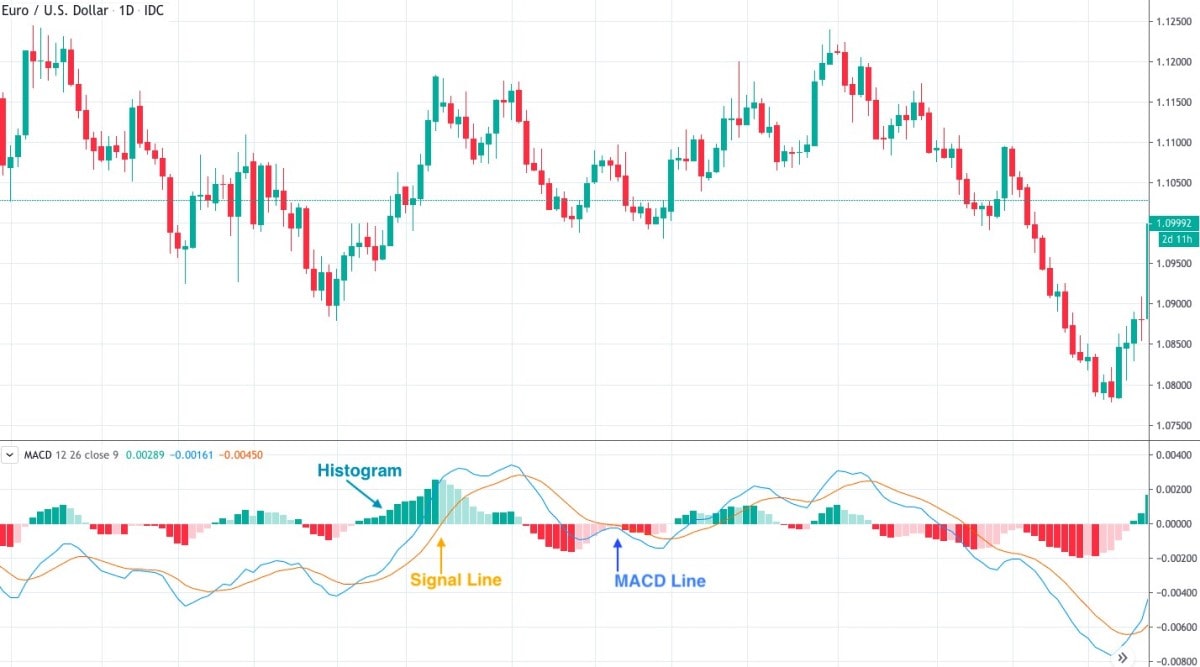
Look at the picture below. The MACD indicator consists of 2 lines: MACD and signal line, and one histogram (bars). A histogram is used to show the difference between the fast and slow moving average. Thus, when the distance between EMAs increases, the histogram rises. It's called divergence. As soon as moving averages get closer, the histogram reduces. It's called convergence. This explains why the indicator is called the Moving Average Convergence Divergence.
Calculating the Moving Average Convergence Divergence
The formula of the MACD is simple. MACD is a subtraction of the 26-period Exponential Moving Average (EMA) from the 12-period EMA.
| MACD = 12-period EMA – 26-period EMA |
If you don't know what the Exponential Moving Average is, there is a simple explanation. EMA is the moving average that puts a greater weight on the most recent price points. That helps this type of moving average to stronger react to the recent price changes.
However, when setting the MACD indicator, you'll see three numbers. For example, 12, 26 and 9 are default settings. As we said above, MACD is the 12-period EMA minus the 26-period EMA. MACD signal line is the 9-period EMA. MACD histogram is the MACD minus the MACD signal line.
How to Implement the MACD Indicator
This indicator is a standard tool in MetaTrader. That means you don't need to buy it or download it additionally:
- Go to MetaTrader
- Click Insert – Indicators – Oscillators
- Pick MACD
If you use any other platform, it's likely that the indicator will be set by default. If not, you can always download it for free.
In the settings window, you can change the periods of the moving averages price, from close to open, high, low and, of course, style. We would recommend you keep the close price. Also, you can change the MA periods. Remember that longer periods are better for bigger timeframes, while shorter periods are better suited to smaller ones.
How to Read the MACD Indicator
We are at the most important point of this article. Let's look at what signals the MACD indicator gives.
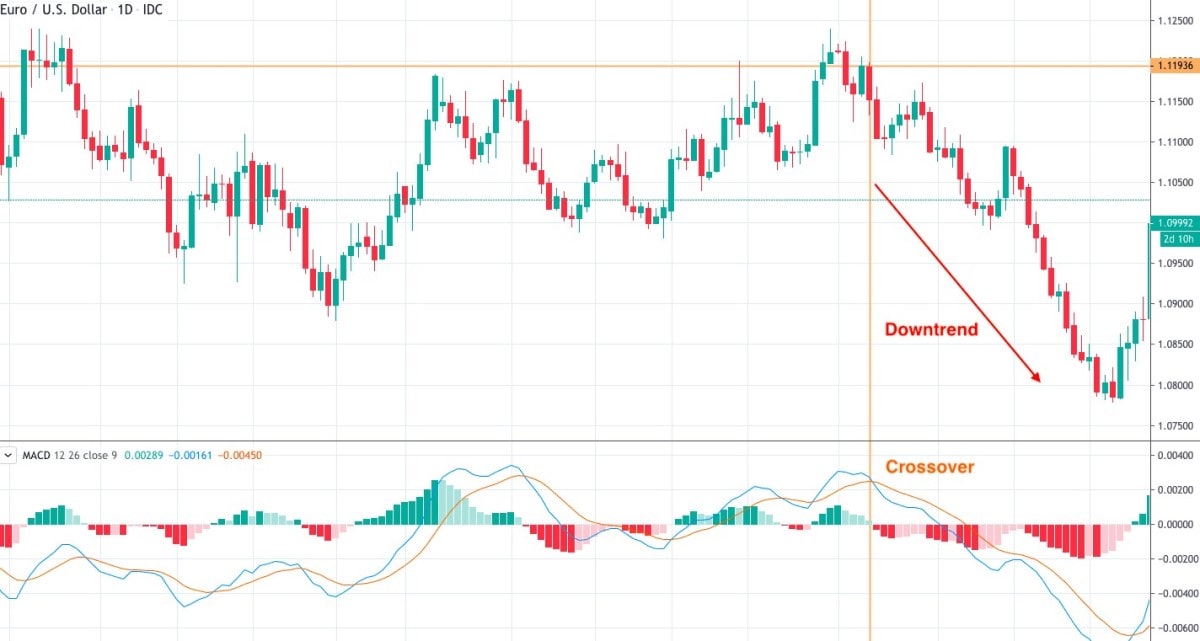
1. Crossover
The first and most common indicator function is the buy/sell signal. A buy signal appears when the MACD line breaks above the signal line. A sell signal happens when the MACD crosses the signal line upside down. The signal will be more influential within the sharp trend. In the case of a weak trend, the signal may turn out fake as the market will turn around.
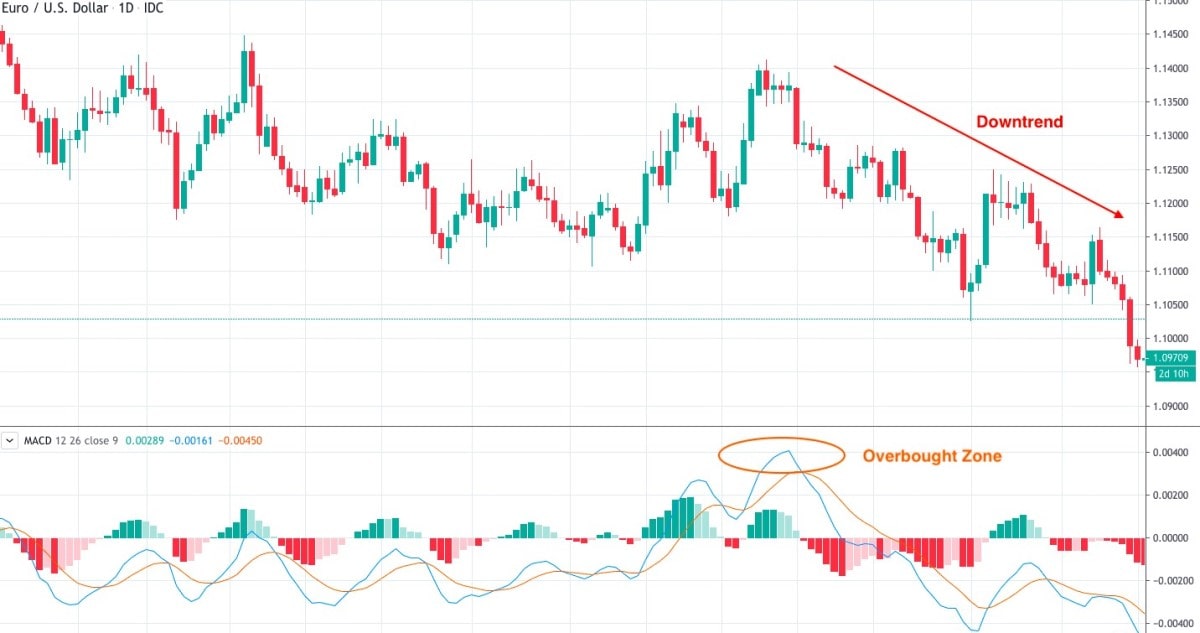
2. Overbought/Oversold Zone
Don't forget that MACD is an oscillator, so one of its functions is to determine market conditions. Both lines will be the crucial point you should consider. If they form significant tops or bottoms, it's a sign of a close correction. There's no need to mention any specific level. You'll understand when the rise or fall is more significant than usual.
If the lines reach the top, it shows that the asset is overbought. Wait for the reversal down. If they form an extreme low, wait for a reversal up. In this case, you can combine the MACD with the RSI to get additional confirmation.
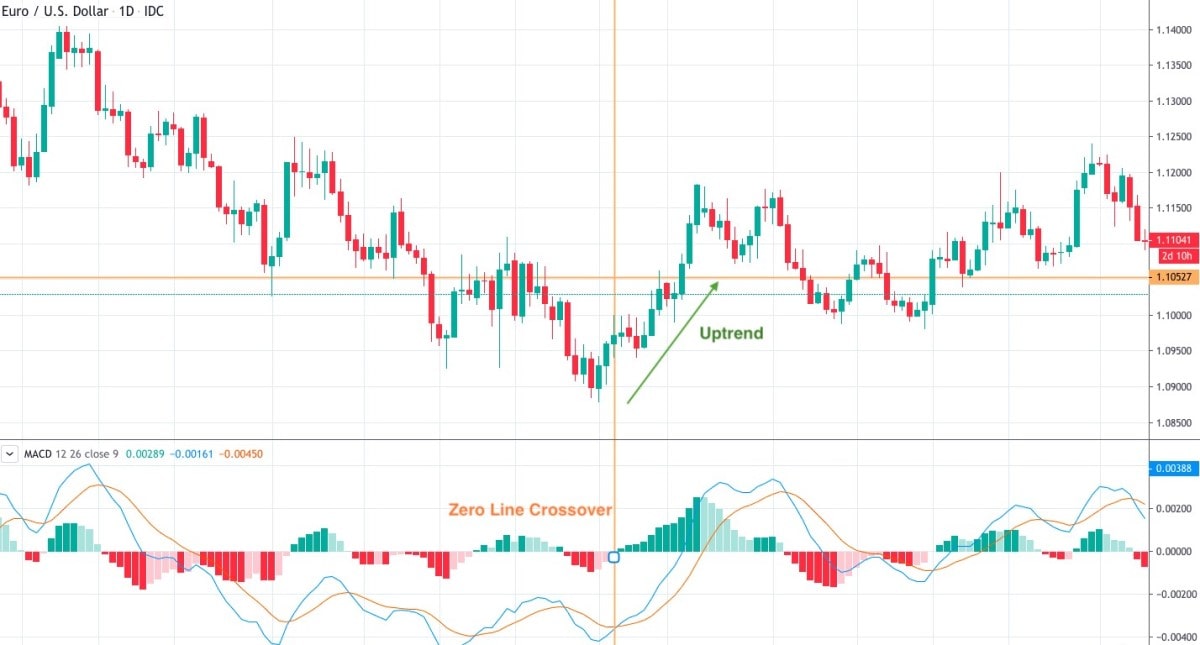
3. Zero-Line Crossover
Pay attention to the MACD histogram. If it rises above the 0 level, it's a signal of an upward trend. If it falls below the 0 level, consider opening a short position. However, be careful. The signal works in a strong trend. In times of high volatility, the histogram can move up and down frequently, and that will lead to fake signals.
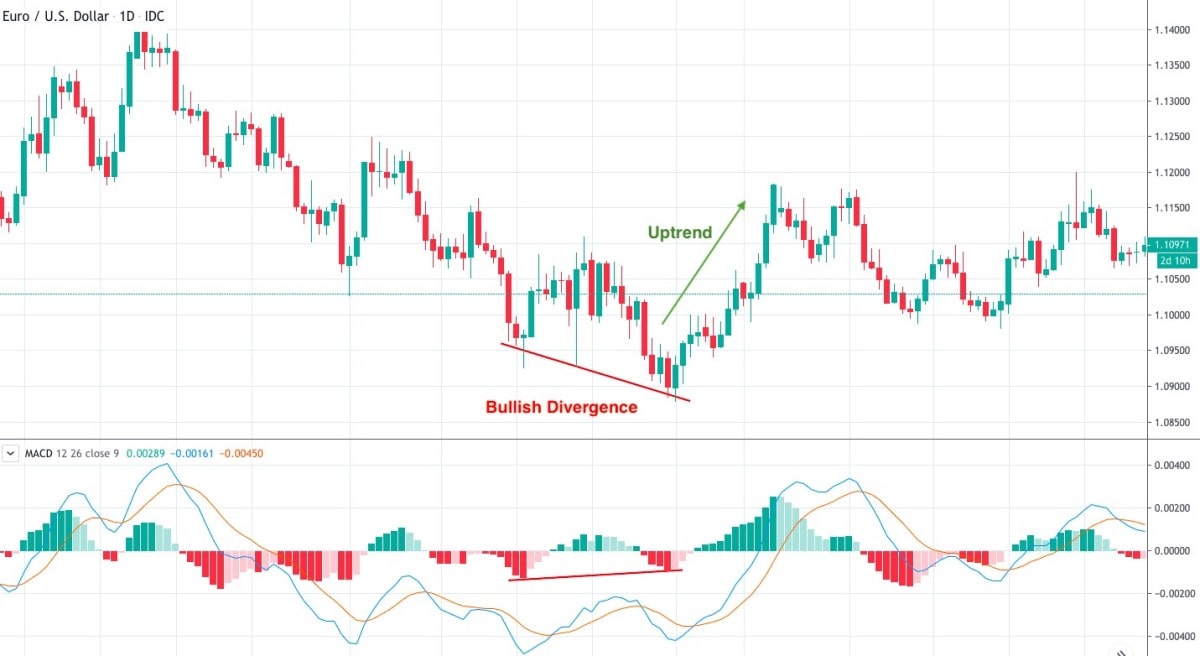
4. Convergence/Divergence
A MACD divergence/convergence is a difference between the direction of the price and the indicator. Bullish convergence happens when the price forms lower lows, while the MACD histogram sets higher lows. It's a buy signal. Bearish divergence is formed when the price sets new tops, while the MACD indicator's extremes become lower. It's a sell signal.
Benefits and Limitations of the MACD Indicator
Everything has two sides, and indicators are no exception. No matter how great the indicator works, it'll have something to affect its effectiveness.
|
Pros |
Cons |
|
1. Trend and momentum. There are several types of indicators. Some of them are used to determine the trend, some to reflect market conditions. As for the MACD, it combines both trend and momentum functions. |
1. Time lag. It's a flaw not only of the MACD indicator but of all the indicators. Nevertheless, the time lag between the MACD signal and the price movement is one of the biggest. It doesn't allow traders to catch an excellent entry point. |
|
2. Plenty of functions. There are a few indicators that can provide so many signals. There's a small chance you implement the MACD on the chart and don't get any sign. |
2. Stop-Loss/Take-Profit levels. Sometimes it's not that easy to determine Stop Loss and Take Profit levels. Indicators are one of the options, but not this time. MACD doesn't provide ready-to-use levels. |
|
3. Simplicity. Although it seems the indicator is complicated, it's not true. Use it several times, and you won't have any difficulties catching a signal. |
3. Fake reversal. MACD is a useful and practical indicator. However, counterfeit signals happen. Sometimes, the MACD gives a sign of reversal because of a weak trend. Divergence may occur in times of sideways price movement. In this case, MACD will move towards the zero line. However, the reversal won't happen. |
Why MACD Indicator Matters
MACD indicator signals traders whether a bullish or bearish movement is strengthening or weakening. It's an important point. By having this knowledge, you'll avoid unprofitable trades. The significant number of the applications makes the MACD indicator an irreplaceable trading tool.
Bonus: How to Avoid Mistakes When Trading with MACD
There's no perfect indicator. Any indicator can give fake signals. However, sometimes the reason is not the indicator; it's the trader's lack of experience and understanding, which create additional mistakes.
Histogram
The first mistake you can face is the wrong interpretation of the MACD histogram. What does the histogram show? It shows whether the market is bullish or bearish and the strength of either bulls or bears.
Some traders think that when the histogram rises significantly, showing the power of the buyers, it's a good signal to buy. However, it will likely be a late signal. If the histogram shows the strength of either bulls or bears, it means that the recovery may happen soon. Thus, it's too late to enter the current market. The best time to open a position is when the histogram is near the 0 level.
Crossover
The MACD crossover works well on a strong trend. However, you should remember that the market changes its direction quite often, especially on short timeframes. Thus, the crossover signals will not be accurate if the trend is weak.
Bonus: MACD Strategy, Follow the Trend
Here is how you can use MACD in trading:
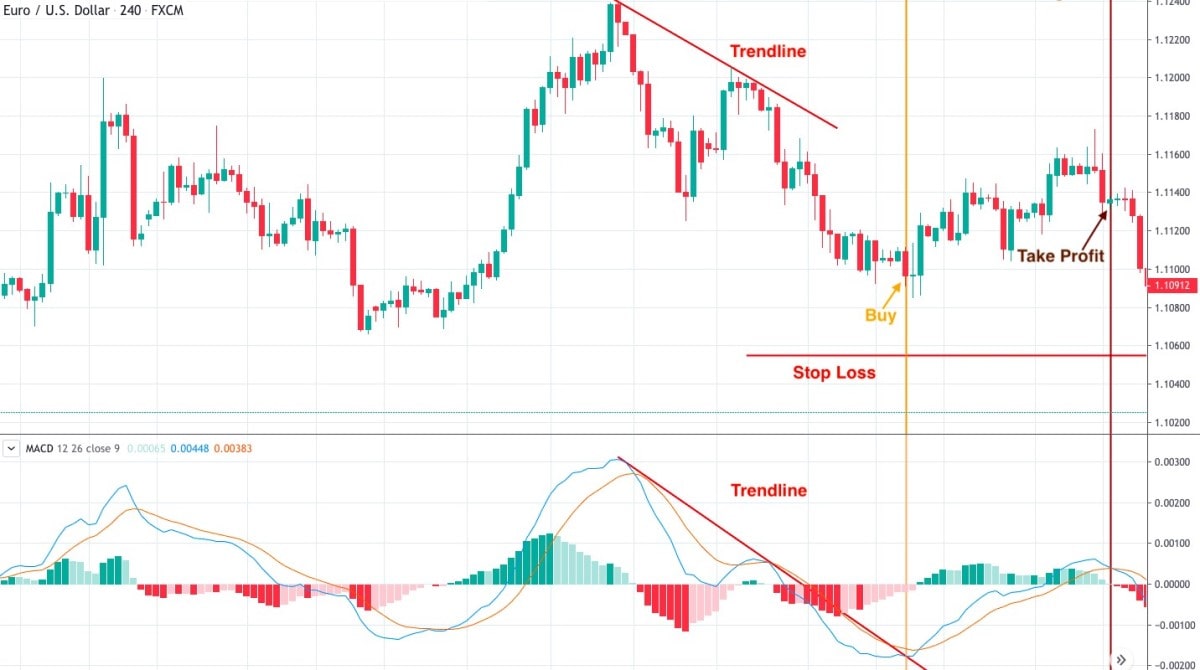
- The first step is to wait for the MACD to form a higher swing high. It's essential the price forms the higher swing high, too. After that, we should look for a lower swing high. Again, the lower swing high of the indicator should be confirmed by the lower swing high of the price.
- After we get two swing high points of both price and indicator, we need to connect them with a trendline.
- The third step is to wait for the MACD breakout. The MACD line crossing the signal line from bottom to top isn't enough. The indicator should break above the trendline we drew. It will be the entry point. Open a long position as soon as the MACD crosses the trendline bottom-up.
- Remember the Stop-Loss order. You should place the stop loss 5-10 pips below the latest low swing of the price.
- Now, you need to wait for a good exit point. Close the position as soon as MACD crosses the signal line in the direction opposite to the entry point. It means from top to bottom. However, don't close the trade immediately as soon as you notice the MACD crossover. Wait for a candlestick to close to be sure the crossover happened. Then you can close your position.
You can use the same rules but in reverse to open a short position.
Conclusion
We can say that the MACD indicator is one of the oldest, most effective and straightforward indicators you can apply for trading. The most significant advantage is that it's multifunctional. If you read our article carefully, you remember that there are four situations when the indicator gives signals. Compare this number to other technical indicators, and you'll understand that it's a lot. The indicator can easily be applied to any timeframe. Thus, you can use it for any of your trading strategies.
It's time to practice! Use the Libertex demo account to experience the advantages of the Moving Average Convergence Divergence indicator.
We explained the basics of the MACD indicator. However, you may still have questions. We gathered the most frequent ones.
Moving Average Convergence Divergence: FAQ
Which MACD Setting Is the Best?
12, 26 and 9 are default MACD settings. However, it doesn't mean it'll work well in any timeframe or within any trading strategy. It's always better to try different options to find the best one that will suit your trading style.
We can recommend some other settings you can apply. 8, 17 and 9 are just as popular as the default combination. A combination of 3, 10 and 16 can be used for intraday trading. 5, 35 and 5 can be applied to smaller timeframes as they are more sensitive.
What Is the Difference Between RSI and MACD?
If you open MetaTrader, you'll see that both indicators are in the Oscillators tab. That said, they differ in settings and functions. The MACD indicator is based on the Moving Averages. On the contrary, the RSI indicator is calculated by measuring the speed and average price gains/losses.
As for functions, RSI is mostly used for reflecting oversold/overbought conditions, while the MACD indicator is more applied to determine the trend.
What Is the MACD Zero Line?
The zero line or centreline is the middle point of the indicator and is clearly visible on the chart. The line is used for reversal determination. If MACD breaks above the zero line, traders may expect the uptrend. Otherwise, the MACD will cross the zero-line upside-down, signalling the downtrend.
Is MACD a Good Indicator?
Definitely. Despite the disadvantages mentioned above, the MACD indicator is one of the most effective forex indicators. The vast number of signals, convenient implementation and accessibility make it one of the favourite indicators among traders. This indicator is multifunctional. On the one hand, it follows the trend; on the other hand, it forecasts the momentum.
Disclaimer: The information in this article is not intended to be and does not constitute investment advice or any other form of advice or recommendation of any sort offered or endorsed by Libertex. Past performance does not guarantee future results.
Why trade with Libertex?
- Get access to a free demo account free of charge.
- Enjoy technical support from an operator 5 days a week, from 9 a.m. to 9 p.m. (Central European Standard Time).
- Use a multiplier of up to 1:30 (for retail clients).
- Operate on a platform for any device: Libertex and MetaTrader.