Ripple Price Prediction: Long Gone or a New Life?
Prepared by the Libertex team
Content reviewed internally in accordance with regulatory standards.
In addition to Bitcoin and Ethereum, Ripple (XRP) is another cryptocurrency that deserves consideration for investment. In many minds, Ripple is a digital asset used by giant world banks and financial organisations.
But what about everyday traders? Can this cryptocurrency be used for trading? Can it be a worthy investment in the coming years? If you want to explore XRP trading without risking real capital first, you can open a free Libertex demo account and test strategies on live XRP price data before committing funds. Let's explore the full picture.
It's worth starting with the basic terms that will help you distinguish Ripple's products: XRP (Ripple), XRP Ledger and RippleNet.
Key Takeaways
- XRP is currently trading near $1.34, reflecting an approximately 0.5% drop over the past 30 days amid continued post-bull-cycle consolidation and regulatory clarity developments in 2026.
- LongForecast projects XRP to trade in the range between $1.05 and $1.61 through the end of 2026, with a year-end close near $1.22.
- WalletInvestor forecasts an average XRP price of $1.19 in 2026, with a potential peak of $1.38 and a floor near $1.00.
- CoinPriceForecast projects that XRP will reach $2.07 by mid-2030, representing an approximately 54.5% increase from current levels.
- Following the August 2025 SEC settlement, institutional adoption milestones are now the primary catalysts that could drive XRP above $2.26 in the long term.
Key Updates
- XRP is currently priced at $1.34, down approximately 0.5% over the past 30 days as of 26 May 2026. 24-hr trading volume stands at approximately $1.3B as of 26.05.2026, with a market capitalisation of around $82.9 billion.
- Ripple secured partnerships with Deutsche Bank, JPMorgan, and Mastercard's payment network in early 2026, bringing its total year-to-date deal count to over 17. That's a positive structural catalyst for XRP's adoption, though the token remains down approximately 41% from its January peak of $2.42.
- Bitcoin's broader market trend in 2026 has pressured XRP alongside the wider crypto market, with XRP showing stronger correlation during the downturn. The token is down 26% year-to-date and has underperformed BTC as institutional capital has rotated toward Bitcoin ETFs and away from altcoins.
Current XRP / USD rate
XRP Price Prediction 2026 – LongForecast
LongForecast projects XRP trading between $1.05 and $1.61 across 2026, with a year-end close of approximately $1.22, representing a 10.3% decrease versus its March opening price.
|
Month |
Open ($) |
Min ($) |
Max ($) |
Close ($) |
Change (%) |
|
May 2026 |
1.37 |
1.23 |
1.51 |
1.34 |
-2.2 |
|
June 2026 |
1.34 |
1.14 |
1.48 |
1.33 |
-2.9 |
|
July 2026 |
1.33 |
1.28 |
1.48 |
1.38 |
0.7 |
|
August 2026 |
1.38 |
1.25 |
1.43 |
1.34 |
-2.2 |
|
September 2026 |
1.34 |
1.05 |
1.34 |
1.13 |
-18.0 |
|
October 2026 |
1.13 |
1.07 |
1.23 |
1.15 |
-16.0 |
|
November 2026 |
1.15 |
1.11 |
1.27 |
1.19 |
-13.0 |
|
December 2026 |
1.19 |
1.13 |
1.31 |
1.22 |
-11.0 |
Source: LongForecast (27.05.2026)
XRP Price Prediction 2027 – WalletInvestor
WalletInvestor's 2027 XRP forecast projects a price range between $0.52 and $1.06, with an average annual price of $0.68 and a year-end close of approximately $0.53.
|
Month |
Open ($) |
Min ($) |
Max ($) |
Close ($) |
Change (%) |
|
January 2027 |
1.04 |
0.994 |
0.974 |
1.06 |
4.02% |
|
February 2027 |
0.992 |
0.955 |
0.923 |
1.03 |
3.77% |
|
March 2027 |
0.954 |
0.912 |
0.884 |
0.983 |
4.36% |
|
April 2027 |
0.911 |
0.87 |
0.836 |
0.947 |
4.42% |
|
May 2027 |
0.869 |
0.827 |
0.803 |
0.894 |
4.79% |
|
June 2027 |
0.826 |
0.786 |
0.763 |
0.85 |
4.87% |
|
July 2027 |
0.784 |
0.743 |
0.727 |
0.802 |
5.3% |
|
August 2027 |
0.741 |
0.7 |
0.68 |
0.763 |
5.61% |
|
September 2027 |
0.698 |
0.658 |
0.633 |
0.725 |
5.76% |
|
October 2027 |
0.657 |
0.615 |
0.597 |
0.677 |
6.33% |
|
November 2027 |
0.614 |
0.574 |
0.551 |
0.638 |
6.55% |
|
December 2027 |
0.572 |
0.531 |
0.516 |
0.588 |
7.27% |
Source: WalletInvestor (27.05.2026)
Ripple (XRP) Long-Term Price Prediction 2028–2037
CoinPriceForecast projects that XRP will reach $1.51 by mid-2028 and climb to $2.26 by year-end 2030 (+69%), with continued growth to $3.48 by 2037 (+160% from today's price).
|
Year |
Mid-Year ($) |
Year-End ($) |
Change (%) |
|
2028 |
1.51 |
1.74 |
29 |
|
2029 |
1.74 |
1.88 |
40 |
|
2030 |
2.07 |
2.26 |
68 |
|
2031 |
2.31 |
2.48 |
84 |
|
2032 |
2.58 |
2.75 |
105 |
|
2033 |
2.87 |
3.03 |
125 |
|
2034 |
3.19 |
3.35 |
149 |
|
2035 |
3.22 |
3.36 |
150 |
|
2036 |
3.35 |
3.48 |
159 |
|
2037 |
3.62 |
3.48 |
159 |
Source: CoinPriceForecast (27.05.2026)
XRP Price: Technical Analysis on 26 May 2026
Although you can find Ripple's technical analysis on different platforms, it's always better to draw your own conclusions. Crypto technical analysis follows the same principles as currency or commodity CFD analysis — define support and resistance levels, then apply your preferred indicators.
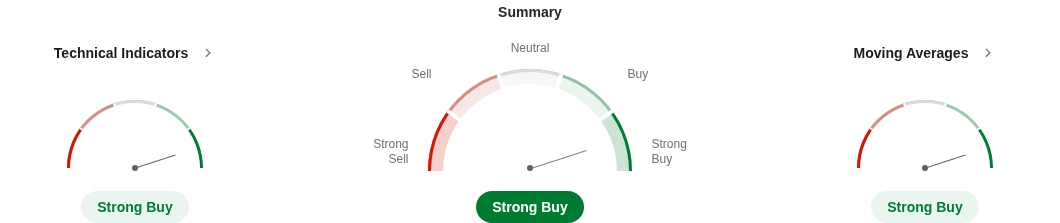
Technical Indicators
|
Indicator |
Value |
Action |
|
RSI(14) |
52.48 |
Neutral |
|
STOCH(9,6) |
48.97 |
Neutral |
|
STOCHRSI(14) |
81.25 |
Overbought |
|
MACD(12,26) |
-0.001 |
Sell |
|
ADX(14) |
36.89 |
Sell |
|
Williams %R |
-29.64 |
Buy |
|
CCI(14) |
127.15 |
Buy |
|
ATR(14) |
0.007 |
High Volatility |
|
Highs/Lows(14) |
0.0033 |
Buy |
|
Ultimate Oscillator |
51.78 |
Buy |
|
ROC |
-0.206 |
Sell |
|
Bull/Bear Power(13) |
0.0128 |
Buy |
Source: Investing (26.05.2026)
Moving Averages
|
Period |
SMA Value |
SMA Action |
EMA Value |
EMA Action |
|
MA5 |
1.3461 |
Buy |
1.3486 |
Buy |
|
MA10 |
1.3448 |
Buy |
1.3477 |
Buy |
|
MA20 |
1.3488 |
Buy |
1.348 |
Buy |
|
MA50 |
1.3518 |
Sell |
1.3497 |
Buy |
|
MA100 |
1.3491 |
Buy |
1.3533 |
Sell |
|
MA200 |
1.3614 |
Sell |
1.3674 |
Sell |
Source: Investing (26.05.2026)
Pivot Points
|
Name |
S3 |
S2 |
S1 |
Pivot |
R1 |
R2 |
R3 |
|
Classic |
1.3261 |
1.3332 |
1.3448 |
1.3518 |
1.3634 |
1.3704 |
1.382 |
|
Fibonacci |
1.3332 |
1.3403 |
1.3447 |
1.3518 |
1.3589 |
1.3633 |
1.3704 |
|
Camarilla |
1.3513 |
1.353 |
1.3547 |
1.3518 |
1.3582 |
1.3599 |
1.3616 |
|
Woodie |
1.3285 |
1.3344 |
1.3472 |
1.353 |
1.3658 |
1.3716 |
1.3844 |
|
Demark |
- |
- |
1.3483 |
1.3536 |
1.3669 |
- |
- |
Source: Investing (26.05.2026)
Ripple: Some of the Basics
Put simply, Ripple is a specific payment protocol that can compete with Bitcoin. It works similarly to a payment system, money transfer network and currency exchange. Ripple interacts with cryptocurrencies, currencies and commodities. XRP is the internal coin of the Ripple protocol.
How It Started
In 2004, Ryan Fugger announced the idea of the Ripple payment platform for the first time. Ripple's development began when Jed McCaleb and Chris Larson took over the project in 2012 (at that time, it was called OpenCoin).
Ripple was a startup based in San Francisco that developed a blockchain-like payment system famous among financial organisations for enabling fast transfers anywhere in the world.
XRP (Ripple) is a digital currency powered by RippleNet — used by financial institutions for low-fee, near-instant transactions. RippleNet is a private digital payment platform built on the XRP Ledger's distributed ledger database. XRP Ledger is open-source and based on the same distributed ledger infrastructure.
Despite a common misconception, Ripple was created not to oppose the traditional banking system but to provide an alternative transfer method alongside it. The protocol is mostly used by banks applying the xCurrent software solution for real-time cross-border payments.
XRP vs Bitcoin and Ethereum
XRP belongs to the broader cryptocurrency category but occupies a distinct niche within it. Unlike Bitcoin and Ethereum, XRP was designed specifically for institutional cross-border settlement, not retail payments or decentralised applications. Understanding these differences matters because XRP's price drivers are fundamentally different from BTC's.
|
Feature |
XRP |
Bitcoin (BTC) |
Ethereum (ETH) |
|
Settlement speed |
3–5 seconds |
Up to 10 minutes |
~15 seconds |
|
Transaction cost |
Fractions of a cent |
Several dollars (congestion) |
Variable gas fees |
|
Consensus model |
Federated consensus (XRPL) |
Proof-of-Work |
Proof-of-Stake |
|
Primary use case |
Cross-border payments (B2B) |
Store of value / retail |
Smart contracts / DeFi |
|
Supply |
Fixed: 100 billion XRP |
Capped: 21 million BTC |
No hard cap |
The XRP Ledger is technically not a traditional blockchain but an open-source distributed ledger with a unique federated consensus model: pre-approved validators (banks, universities, Ripple Labs) reach agreement through a voting protocol rather than energy-intensive mining. This architecture enables XRP's 3–5 second settlement at near-zero cost, the commercial underpinning of RippleNet. Because XRP's primary market is institutional cross-border settlement, its price is driven more by regulatory developments and partnership news than by the retail sentiment cycles that dominate Bitcoin's price action.
What Affects Ripple's Price
The cryptocurrency market's best feature is that every digital asset is affected by a common set of factors. For XRP, however, those factors carry different weights than for most other cryptocurrencies. Here is a ranked breakdown by historical price impact:
- Macro crypto market trend / BTC correlation: A structural driver. During broad bull cycles, XRP rises even under regulatory headwinds (2021: $0.23 → $1.83 despite the ongoing SEC case). During bear markets, BTC correlation tightens.
- Institutional partnerships: a medium-term catalyst. Partnership announcements (HDFC Bank August 2020, Bank of America November 2020) create initial price spikes but require sustained adoption to hold gains.
- Investor and whale sentiment: A short-term volatility driver. When a large holder sells, the price drops. Jed McCaleb's April 2020 sale of 54M XRP contributed to a decline; his final sale in July 2022 removed a chronic supply overhang.
- Technology improvements: A long-term signal. Milestones such as new unique address records or ODL volume growth signal adoption momentum but rarely produce immediate price moves.
These drivers do not operate in isolation. A partnership announcement during a bearish macro environment may have a limited price effect. Institutional news needs a receptive market to generate sustained momentum.
Development of the Technology
When the technology improves, it signals the coin has a future. According to CoinMarketCap data, the XRP/USD pair was at $0.23 on 1 November 2020 and reached $0.76 by 24 November — a new record of unique addresses transacting in XRP was among the supporting factors. Ripple has stated its ambition to challenge SWIFT technology. If the protocol comes closer to that goal, it will signal an appreciation of XRP.
Regulation
The Ripple company cooperates with large financial institutions, but regulatory issues materially affect its value. On 22 December 2020, the SEC filed a case against Ripple for the alleged illegal sale of XRP coins. The token crashed from $0.4457 (open) to $0.26 (close) that day; the lowest price hit $0.2098 at Bitstamp.
Agreements
New agreements with leading banks and financial organisations are a key XRP catalyst. Ripple became famous as many banks accepted its technology despite scepticism toward crypto. In August 2020, HDFC Bank Limited — India's largest bank — joined RippleNet. In November 2020, the company started collaborating with Bank of America, the second-largest bank in the US.
Partnership announcements create initial price spikes, but only sustained adoption across Ripple's On-Demand Liquidity product generates lasting XRP demand. The initial spike requires follow-through to hold.
Investors' Mood
Investor sentiment can be read by monitoring price direction and the activity of key coin holders. When a large holder sells, the price goes down. In April 2020, Jed McCaleb — Ripple's co-founder — sold 54 million XRP, contributing to a price decline.
As a co-founder holding 9 billion XRP, his years of systematic selling created chronic downward supply pressure. His final sale in July 2022 removed that overhang, though XRP was unable to break above $0.40 that month.
Market Sentiment
It doesn't matter how impressive the technology is or how many investors believe in XRP's success: if the primary market trend is bearish, the cryptocurrency will drop.
Market sentiment is the aggregate emotional and directional bias of all market participants. Three measurable tools are used to track it:
- Crypto Fear and Greed Index (0–100 scale). Extreme fear often signals a buying opportunity; extreme greed warrants caution. Traders use it as a contrarian signal.
- Large-holder (whale) wallet tracking. On-chain tools such as Whale Alert monitor significant XRP transfers. Whale accumulation may signal confidence; large sell-offs can front-run price drops.
- Social media volume analysis. Spikes in XRP mentions on Twitter and Reddit frequently precede short-term volatility.
The December 2020 SEC lawsuit is the definitive XRP sentiment case study. XRP dropped more than 40% within hours as sentiment collapsed, demonstrating how quickly negative sentiment can override institutional utility. While sentiment drives short-term price spikes, the underlying market trend determines medium-to-long-term direction.
XRP: Past Price Performance
The analysis of Ripple's historical price is a vital part of successful investing. Past trends make it possible to understand what factors affected the coin's direction and to what degree.
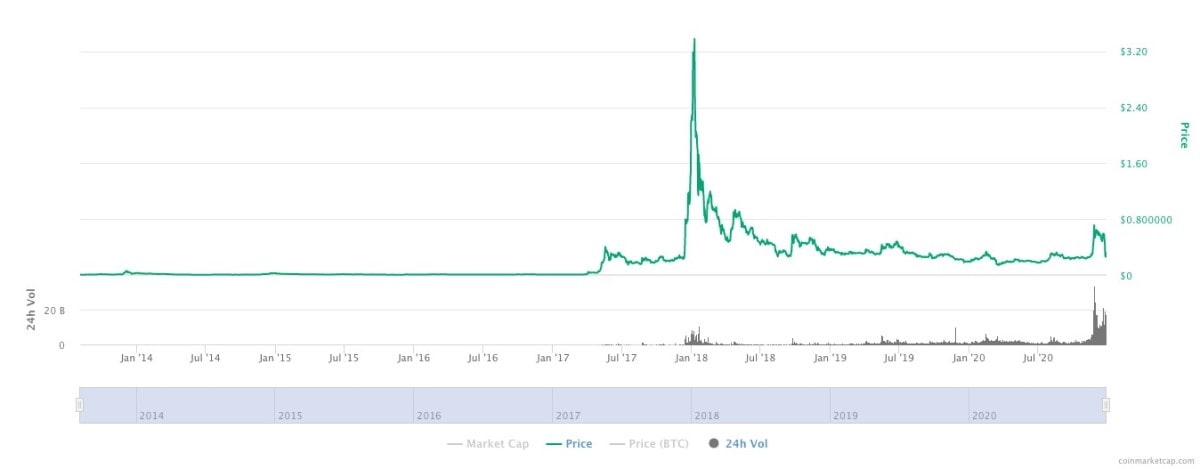
XRP first appeared on a cryptocurrency exchange on 4 August 2013 at $0.01. The all-time high was recorded on 4 January 2018 at $3.84 — a range of 38,400%, which underlines why understanding price drivers matters. XRP's price is influenced most by institutional partnerships, Bitcoin price correlation, and overall market sentiment.
The main advantage of Ripple is its relatively low volatility compared to most cryptocurrencies, though with significant event-driven spikes. Its biggest fluctuations occurred in the 2017–2018 bull run and in December 2020 following the SEC announcement. Outside those events, sideways movement has prevailed for extended periods.
XRP and the Broader Crypto Market Cycle
During the 2021 bull market, XRP rose from approximately $0.23 to $1.83 despite the SEC lawsuit headwind, demonstrating that macro bull cycles can lift even embattled assets. The first significant surge occurred in March 2021, peaking at $1.83 in April, before pulling back to $1.03 within the same month. A series of upswings continued through the second half of 2021, with XRP reaching $1.43 in September.
During the 2022 bear market that was triggered by Russia's invasion of Ukraine and the Terra/LUNA collapse, XRP fell in line with the broader market regardless of Ripple-specific news. By 12 May 2022, the price had fallen to $0.3852. This illustrates a key structural insight: the broader crypto market trend historically overrides XRP-specific fundamentals during bull and bear cycles. BTC correlation tends to be strongest during panic sell-offs and weakest during XRP-specific catalysts.
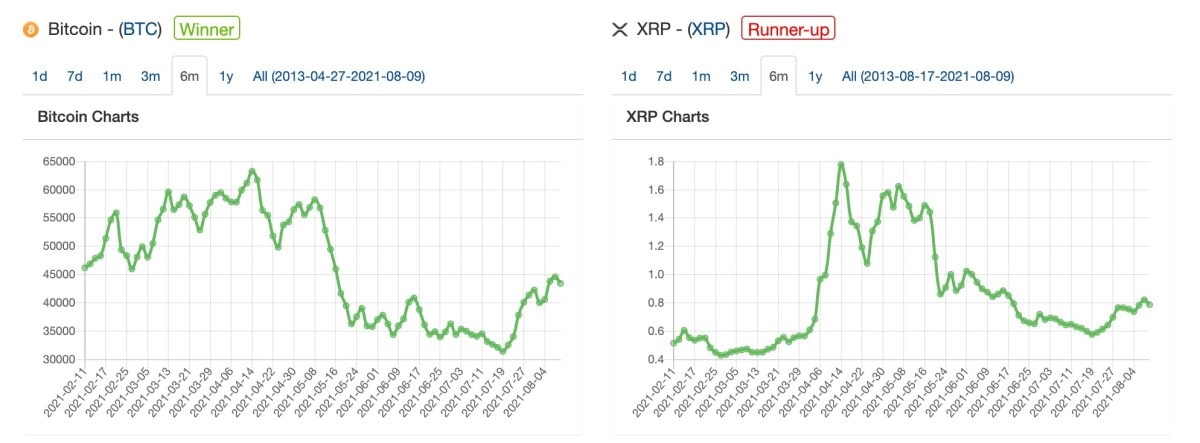
Historically, XRP/USD and BTC/USD movements were similar, with Ripple's price direction often following Bitcoin's primary trend. However, the correlation is no longer as tight — you cannot make an accurate projection for Ripple based solely on Bitcoin's performance.
Methodology Behind XRP Price Predictions: How Forecasts Are Built
Ripple price forecasts are generated through a combination of four analytical layers:
- Technical analysis. Using indicators including RSI, MACD, moving averages, stochastic oscillator, and Fibonacci retracement to identify trend direction, momentum, and key reversal levels on the XRP/USD chart.
- On-chain metrics. Active address counts, large-holder behaviour, and transaction volumes on the XRP Ledger provide real-time demand signals not visible in price data alone.
- Expert and analyst consensus. Aggregated forecasts from WalletInvestor, LongForecast, and CoinPriceForecast, summarised in the sections above.
- Macroeconomic and regulatory context. Federal Reserve interest rate cycles and broader crypto market conditions. The 2022 Fed rate-hiking cycle coincided with a ~60% XRP decline as higher rates raised the opportunity cost of holding non-yielding crypto.
No single prediction is guaranteed. The 2021–2022 period is the clearest historical benchmark: most bullish 2021 forecasts underestimated the rally peak, while most 2022 forecasts overestimated recovery speed. Treat any individual forecast as one data point; weigh forecasts that align across multiple independent sources more heavily than outliers.
Ripple Long-Term Price Prediction by Experts
Although you can find Ripple's technical analysis and expert predictions on different platforms, it's always better to make your own assessment. Brad Garlinghouse, CEO of Ripple, has claimed the company will become the Amazon of the cryptocurrency industry — a prediction made before the SEC lawsuit that should be contextualised accordingly.
DigitalCoinPrice projects XRP at an average of $0.94 in 2030, representing approximately -29.9% from the current price level.
Based on available long-term forecasts, XRP could rise to approximately $2.26 by 2030 and potentially $267.30 by 2050, driven by assumed mainstream institutional adoption.
How Accurate Are XRP Price Predictions?
No crypto price prediction carries a guarantee, and XRP's history illustrates this clearly. XRP peaked at $1.83 in April 2021 and dropped to $0.3852 in May 2022. Most bullish 2021 forecasts underestimated the rally peak; most 2022 forecasts overestimated recovery speed. The December 2020 SEC lawsuit alone invalidated many pre-existing forecasts that had not accounted for black-swan regulatory risk.
Treat any individual forecast as a scenario rather than a certainty. Forecasts that align across multiple independent sources deserve more weight than outliers. Use the price tables in this article as frameworks for possibility, not as guaranteed price targets.
How to Perform Technical Analysis on XRP: A Step-by-Step Guide
Technical analysis of XRP/USD follows a repeatable multi-step process. No single indicator should be used in isolation. The indicators below form a multi-confirmation system where each signal is cross-checked against others before acting.
Step 1 — Identify the prevailing trend. Use moving average crossovers and price action structure to determine the primary direction. An uptrend is defined by higher highs and higher lows; a downtrend by lower highs and lower lows. Without knowing the trend, individual indicators give ambiguous signals.
Step 2 — Mark key support and resistance levels. Identify zones on the XRP/USD chart where price has repeatedly reversed. Candlestick patterns at these levels — such as hammer candles at support or shooting stars at resistance — provide early reversal signals.
Step 3 — Apply momentum indicators. RSI measures overbought/oversold conditions: below 30 = oversold, above 70 = overbought, ~50 = neutral. MACD shows momentum direction — a crossover above the signal line indicates improving momentum. The Stochastic Oscillator's %K/%D lines confirm momentum. A buy signal is most reliable when RSI is below 35 AND Stochastic %K crosses above %D below 20.
Step 4 — Check Fibonacci retracement levels. Fibonacci retracement identifies potential reversal zones at 38.2%, 50%, and 61.8% — based on the distance between a swing high and swing low. Particularly useful for planning entry points after a pullback within an established trend.
Step 5 — Confirm with volume. Only act on technical signals where volume supports the move. A breakout above resistance on low volume is suspect; on high volume, it is more reliable. Volume confirmation is the final filter before acting on any XRP trade entry or exit.
Additionally, Bollinger Bands measure volatility through a 20-period MA centre line with ±2 standard deviation outer bands. When the bands narrow (a 'squeeze'), low volatility is present, and a significant price move is typically imminent. Always confirm Bollinger Band signals with RSI and MACD before acting.
To see how these indicators currently read for XRP, revisit the technical analysis tables above.
Managing XRP Volatility: What Traders Need to Know
XRP's volatility is generally lower than most major cryptocurrencies, but with acute event-driven spikes. The two most significant volatility events in XRP's history were the 2017–2018 bull run and the December 2020 SEC announcement, which caused an immediate 40%+ single-day drop. Outside these events, XRP's 30-day volatility has typically been lower than BTC and ETH, while remaining volatile in absolute terms.
Practical risk management for XRP traders:
- Position sizing by volatility. If XRP typically moves 3–5% per day, a stop-loss placed 2% away may be hit by normal price noise. Widen the stop beyond normal daily noise and reduce position size accordingly. Never size a position based on a fixed dollar amount; size it based on the distance to your stop-loss.
- Stop-loss orders are non-negotiable. Given XRP's history of sharp regulatory-event drops, a stop-loss is the primary tool for limiting downside on any open position.
- CFD flexibility. XRP CFD trading allows you to profit from both rising and falling prices without owning the underlying asset. CFDs enable short positions, particularly relevant during XRP's high-volatility SEC-related periods. Note that leverage amplifies both gains and losses.
The apparent contradiction between XRP's reputation for 'lower volatility' and its 80%+ historical drawdowns is resolved by context: lower volatility versus other altcoins does not mean low volatility in absolute terms. Never allocate more than you can afford to lose entirely, and always use stop-losses at technically significant levels.
Ripple (XRP): Trade or Invest?
It's always a dilemma as to whether you should trade or invest. The main difference lies in the speed of potential profit. If you invest in Ripple by buying it on a cryptocurrency exchange, you'll need to hold the coins for a long period. Any long-term investment carries risk — no one can make an accurate XRP price prediction with certainty.
Another approach is to trade XRP pairs. Margin trading includes risks, but it also allows you to limit them by opening multiple trades and managing entries and exits. Short-term trades offer faster profit potential, and the limited capital required to open a leveraged position is an advantage for smaller accounts.
Trading cryptocurrencies can be done with a broker via CFDs. Before you decide which approach suits you best, you can open a Libertex demo account with various assets, including cryptocurrency CFDs, and implement different strategies using XRP's recent price movements — without risking real capital.
Where Can You Trade XRP?
There are two primary routes for trading XRP:
(a) Crypto exchanges — buy and own actual XRP tokens. Binance is the largest by volume and offers XRP/USDT and XRP/BTC pairs with high liquidity. Note that Binance.US briefly suspended XRP trading in 2021 following the SEC lawsuit. Other regulated options include Bitstamp — a European-regulated exchange that maintained XRP trading throughout the SEC lawsuit period and where XRP hit its lawsuit-era low of $0.2098 — and Kraken.
(b) CFD brokers — trade XRP price movements without owning the asset, with access to leverage and the ability to go short. Libertex offers XRP CFDs with a multiplier of up to 1:30 for retail clients, plus a free demo account to practice strategies before live trading.
|
Feature |
Crypto Exchange (e.g., Binance) |
CFD Broker (e.g., Libertex) |
|
Asset ownership |
Yes — you own XRP |
No — price exposure only |
|
Leverage available |
Limited (futures only) |
Up to 1:30 (retail) |
|
Short-selling |
Futures only |
Yes — on all CFDs |
|
Minimum capital |
Value of XRP bought |
As low as $10 |
|
Regulatory protection |
Varies by jurisdiction |
CySEC regulated |
XRP and the SEC Lawsuit
The SEC filed a lawsuit against Ripple in December 2020, alleging the illegal sale of XRP as an unregistered security. The case was formally resolved on 7 August 2025, when both parties jointly dismissed their appeals and Ripple paid a $50 million settlement.
The resolution marked a turning point for XRP. Exchanges that had delisted the token reinstated it, spot XRP ETFs launched on CME and Nasdaq in late 2025 attracting over $1.29 billion in net inflows, and the legal uncertainty that had suppressed XRP's price since 2020 was fully removed.
Conclusion
Ripple (XRP) occupies a unique position in the cryptocurrency landscape: a token designed for institutional cross-border settlement, with real-world banking partnerships, but carrying the overhang of ongoing regulatory uncertainty. Its price history — from $0.01 at launch to $3.84 at its all-time high and back through the SEC-triggered crash — illustrates how sensitive XRP is to regulatory developments above all other factors.
The forecasts for 2026 and beyond are wide-ranging. WalletInvestor, LongForecast, and CoinCodex each offer different scenarios. Long-term outlooks through 2037 range from conservative to highly bullish depending on adoption assumptions. None should be treated as certainties.
For traders, the key insight is this: XRP's price is driven more by regulatory outcomes and macro crypto cycles than by its technical indicators alone. Use the indicator tables and forecast data in this article as a framework for planning — not as a guarantee of future price direction.
FAQ
What Will Ripple Be Worth in 2026?
Based on forecasts from WalletInvestor, LongForecast, and CoinCodex, XRP is projected to trade in a range of $1.00–$1.61 in 2026, with an average around $1.19.
Does Ripple Have a Future?
Ripple has established real-world banking partnerships (including HDFC Bank and Bank of America) and continues to grow its On-Demand Liquidity product. The resolution of the SEC lawsuit is the key determinant of whether Ripple can fully unlock its institutional growth potential.
How Much Will Ripple Be Worth in 5 Years?
A five-year horizon from 2026 points to 2027 through 2031. Long-term forecasts from the CoinPriceForecast project XRP in a range of $2.07–$2.26 by 2030, implying significant upside from current levels, though these projections carry high uncertainty.
What Will Ripple Be Worth in 2030?
CoinPriceForecast projects XRP at $2.07 (mid-year) and $2.26 (year-end) by 2030. All are scenarios, not guarantees.
Is Ripple a Good Investment?
Whether XRP is a good investment depends on your time horizon and risk tolerance. XRP has demonstrated the ability to generate large returns during bull cycles but also carries significant regulatory, volatility, and market risk. CFDs are not suitable for all investors. 84% of retail investor accounts lose money trading CFDs with this provider.
How Much Will Ripple Be Worth in 10 Years?
A 10-year outlook is highly speculative. CoinPriceForecast projects XRP reaching $3.36 by year-end 2035 and $3.48 by 2037, representing approximately +160% from current levels, depending on the scale of institutional adoption of blockchain-based cross-border payment infrastructure.
Can XRP Reach $100?
Reaching $100 would require XRP's market capitalisation to exceed $10 trillion, larger than the entire current global stock market. Most credible forecasts for 2030–2050 do not project XRP anywhere near $100. Such scenarios require extreme adoption assumptions that have no current basis.
Disclaimer: The information in this article is not intended to be and does not constitute investment advice or any other form of advice or recommendation of any sort offered or endorsed by Libertex. Past performance does not guarantee future results.
Why trade with Libertex?
- Get access to a free demo account free of charge.
- Enjoy technical support from an operator 5 days a week, from 9 a.m. to 9 p.m. (Central European Standard Time).
- Use a multiplier of up to 1:30 (for retail clients).
- Operate on a platform for any device: Libertex and MetaTrader.