Silver Price Forecast for 2026-2030: Expert Predictions and Market Analysis
Prepared by the Libertex team
Content reviewed internally in accordance with regulatory standards.
Silver prices are projected to reach between $53.90 and $77.36 by year-end 2026 and over $249.98 by 2030, driven by industrial demand growth from solar panels and electric vehicles, Federal Reserve policy expectations, and mining supply constraints. Industrial applications account for over 50% of total silver demand, with solar panel production consuming 230 million ounces annually.
The gold-silver ratio, which historically averages between 60 and 80, currently sits around 70, suggesting that silver could potentially outperform gold. Silver offers leverage to gold price movements during bull markets, though predictions depend on macroeconomic conditions.
Silver's dual nature as a precious metal and industrial commodity drives renewed investor interest. The photovoltaic industry requires silver for electrical conductivity, while electric vehicles use 25-50 grams per vehicle. Investment demand through ETFs remained robust in 2025, with the gold-silver ratio's historical patterns suggesting silver typically outperforms gold in bull markets. Five consecutive years of supply deficits provide structural price support, as renewable energy infrastructure creates long-term demand, distinguishing silver from purely monetary metals. Market volatility remains elevated amid ongoing geopolitical tensions, though the short-term silver outlook indicates continued strength through early 2026.
Silver price chart
Silver price forecast for 2026
Federal Reserve rate decisions directly impact silver prices through the dollar's strength, with expected rate cuts in 2026 supporting higher valuations. Uncertainty about Fed policy creates volatility in XAG/USD trading. The photovoltaic industry consumes over 230 million ounces annually, as the expansion of solar energy capacity drives structural demand higher. Green energy policies accelerate silver consumption in the renewable sector. Demand for solar panels continues to accelerate as global clean energy capacity expands, with the green energy transition creating structural tailwinds for silver consumption.
According to LongForecast, the silver price forecast for 2026 indicates a range between $53.90 and $77.36. Data is available from June onward, with the year opening near $62.92. The year-end price in December is projected at $64.04, representing a modest +0.6% gain versus the current price of $63.68.
| Month | Low-High (USD) | Close (USD) | Total Change % |
| June 2026 | 58.68-77.36 | 62.92 | -3.8% |
| July 2026 | 53.9-66.31 | 60.16 | -8% |
| August 2026 | 58.46-64.62 | 61.54 | -5.9% |
| September 2026 | 57.5-63.56 | 60.53 | -7.4% |
| October 2026 | 53.94-60.53 | 56.78 | -13.2% |
| November 2026 | 56.78-63.32 | 60.3 | -7.8% |
| December 2026 | 60.3-67.24 | 64.04 | -2.1% |
Source: LongForecast.com (19.06.2026)
Silver price forecast for 2027
Approximately 70% of silver is produced as a byproduct of mining other metals, while primary silver mines face declining ore grades and rising costs. Supply deficits have persisted for multiple consecutive years. The energy transition requires massive silver consumption for electrification, with electric vehicles using 25-50 grams per vehicle.
According to LongForecast, the 2027 silver forecast shows prices ranging between $64.04 and $101.09, with June potentially reaching $85.87. The year is expected to close at $96.28, representing an intra-year gain of approximately 41.6% (from January's $68.01 to December's $96.28), or +47.2% versus the current price of $63.68.
| Month | Low-High (USD) | Close (USD) | Total Change % |
| January 2027 | 64.04-71.41 | 68.01 | 4% |
| February 2027 | 68.01-75.84 | 72.23 | 10.4% |
| March 2027 | 70.75-78.19 | 74.47 | 13.9% |
| April 2027 | 74.47-83.04 | 79.09 | 20.9% |
| May 2027 | 79.09-88.19 | 83.99 | 28.4% |
| June 2027 | 81.58-90.16 | 85.87 | 31.3% |
| July 2027 | 85.87-95.75 | 91.19 | 39.4% |
| August 2027 | 87.31-96.51 | 91.91 | 40.5% |
| September 2027 | 82.41-91.91 | 86.75 | 32.6% |
| October 2027 | 86.75-96.74 | 92.13 | 40.9% |
| November 2027 | 86.13-95.19 | 90.66 | 38.6% |
| December 2027 | 90.66-101.09 | 96.28 | 47.2% |
Source: LongForecast.com (19.06.2026)
Silver price forecast for 2028
Economic cycle impact becomes more pronounced during potential downturns, as economic recession negatively impacts industrial silver demand. Silver behaves differently from gold during downturns. Industrial consumption trends show that industrial demand fluctuates with manufacturing activity and GDP growth, while demand in the technology sector significantly influences silver consumption patterns. 5G and electronics maintain steady demand growth.
According to LongForecast, the 2028 silver price prediction shows fluctuations between $81.62 and $114.28. The price opens the year near $90.65 and could reach a peak of $108.84 in October, closing the year at $102.63, a 13.2% annual increase.
| Month | Low-High (USD) | Close (USD) | Total Change % |
| January 2028 | 86.12-96.28 | 90.65 | 38.6% |
| February 2028 | 81.62-90.65 | 85.92 | 31.4% |
| March 2028 | 85.22-94.2 | 89.71 | 37.2% |
| April 2028 | 89.71-100.03 | 95.27 | 45.7% |
| May 2028 | 90.73-100.29 | 95.51 | 46% |
| June 2028 | 89.92-99.38 | 94.65 | 44.7% |
| July 2028 | 86.61-95.73 | 91.17 | 39.4% |
| August 2028 | 91.17-101.66 | 96.82 | 48% |
| September 2028 | 96.82-107.61 | 102.49 | 56.7% |
| October 2028 | 102.49-114.28 | 108.84 | 66.4% |
| November 2028 | 101.58-112.28 | 106.93 | 63.5% |
| December 2028 | 97.5-107.76 | 102.63 | 56.9% |
Source: LongForecast.com (19.06.2026)
Silver price forecast for 2029
Technology sector demand expands as technology applications consume a growing share of silver production. Electronics and semiconductors require silver for conductivity properties, while emerging technologies create new demand categories, including AI infrastructure and data centres. The evolution of investment demand shows silver ETF holdings reflect investor sentiment toward precious metals, while retail investment fluctuates based on price momentum and gold correlation. Long-term investors accumulate physical silver as a monetary hedge.
According to LongForecast, the 2029 silver forecast ranges between $90.38 and $111.31, with a potential peak of $106.01 in March. The year is expected to close near $97.63, representing an annual change of approximately +0.3%.
| Month | Low-High (USD) | Close (USD) | Total Change % |
| January 2029 | 92.47-102.63 | 97.34 | 48.8% |
| February 2029 | 97.34-108.55 | 103.38 | 58.1% |
| March 2029 | 100.71-111.31 | 106.01 | 62.1% |
| April 2029 | 94.47-106.01 | 99.44 | 52% |
| May 2029 | 94.18-104.1 | 99.14 | 51.6% |
| June 2029 | 99.14-110.55 | 105.29 | 61% |
| July 2029 | 96.36-106.5 | 101.43 | 55.1% |
| August 2029 | 90.38-101.43 | 95.14 | 45.5% |
| September 2029 | 94.49-104.43 | 99.46 | 52.1% |
| October 2029 | 99.46-110.91 | 105.63 | 61.5% |
| November 2029 | 94.13-105.63 | 99.08 | 51.5% |
| December 2029 | 92.75-102.51 | 97.63 | 49.3% |
Source: LongForecast (19.06.2026)
Long-term silver price prediction for 2030-2035
Peak silver supply concerns emerge as global silver production may plateau during the 2030s due to resource constraints, with declining ore grades increasing extraction costs substantially over time. Green technology demand accelerates as net-zero commitments require massive silver consumption by the 2030s, while solar and EV markets reach maturity, driving sustained demand. Silver intensity per unit may decrease through efficiency gains, but volume growth offsets these improvements. Monetary system evolution considerations include currency diversification, benefiting precious metals, including silver, while debt sustainability concerns drive interest in hard assets. Silver historically served as a monetary metal alongside gold.
According to CoinPriceForecast, long-term silver price prediction suggests prices could reach $249.98 by 2030, with continued growth to $414.55 by 2035.
| Year | Mid-Year (USD) | Year-End (USD) | Price % |
| 2030 | 229.34 | 249.98 | 283 % |
| 2031 | 270.43 | 272.18 | 317 % |
| 2032 | 291.02 | 309.73 | 375 % |
| 2033 | 327.39 | 342.58 | 425 % |
| 2034 | 360.72 | 378.76 | 481 % |
| 2035 | 396.7 | 414.55 | 536 % |
Source: CoinPriceForecast (19.06.2026)
Technical analysis of silver's price
Technical analysis identifies key support and resistance levels for silver. Moving averages signal trend direction, while RSI and MACD indicate overbought or oversold conditions. Chart patterns and price formations suggest potential future movements, with historical patterns providing context for current technical setups. Price cycles help identify potential turning points, while breakout levels serve as triggers for trend continuation or reversal. Current signals from Investing.com show market dynamics.
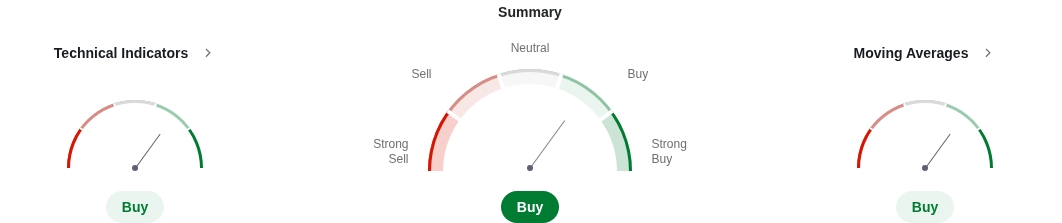
Technical Indicators:
| Name | Value | Action |
| RSI(14) | 60.14 | Buy |
| STOCH(9,6) | 46.24 | Neutral |
| STOCHRSI(14) | 0 | Oversold |
| MACD(12,26) | 12.62 | Buy |
| ADX(14) | 64.84 | Buy |
| Williams %R | -62.92 | Sell |
| CCI(14) | 39.45 | Neutral |
| ATR(14) | 16.61 | High Volatility |
| Highs/Lows(14) | 0 | Neutral |
| Ultimate Oscillator | 42.77 | Sell |
| ROC | 98.45 | Buy |
| Bull/Bear Power(13) | 12.59 | Buy |
Source: Investing (19.06.2026)
Moving Averages:
| Name | Simple | Exponential | ||
| MA5 | 76.65 | Sell | 70.7 | Sell |
| MA10 | 68.49 | Sell | 66.46 | Sell |
| MA20 | 51.19 | Buy | 56.16 | Buy |
| MA50 | 35.12 | Buy | 41.16 | Buy |
| MA100 | 27.51 | Buy | 33 | Buy |
| MA200 | 24.88 | Buy | 25.44 | Buy |
Source: Investing (19.06.2026)
Pivot Points:
| Name | S3 | S2 | S1 | Pivot Points | R1 | R2 | R3 |
| Classic | 50.44 | 61.22 | 68.55 | 79.33 | 86.65 | 97.43 | 104.76 |
| Fibonacci | 61.22 | 68.14 | 72.41 | 79.33 | 86.24 | 90.52 | 97.43 |
| Camarilla | 70.9 | 72.56 | 74.22 | 79.33 | 77.54 | 79.19 | 80.85 |
| Woodie's | 48.72 | 60.36 | 66.82 | 78.46 | 84.93 | 96.57 | 103.03 |
| DeMark's | - | - | 73.94 | 82.02 | 92.04 | - | - |
Source: Investing (19.06.2026)
Factors influencing silver's price

Silver price drivers encompass both industrial and investment demand factors, creating complex price dynamics. Understanding these drivers makes it possible to make better investment decisions. Key price drivers include:
Monetary factors:
- Federal Reserve policy and interest rate decisions
- US dollar strength, which affects precious metals' valuations
- Real interest rates, which impact opportunity costs
Industrial demand factors:
- Solar photovoltaics, which consume over 230 million ounces annually
- Electric vehicles, which use 25-50 grams per vehicle
- Electronics and semiconductors, which require conductivity
- 5G infrastructure and data centres
- Medical applications, which continue to see steady demand
Investment demand factors:
- Gold price movements, which influence silver flows
- ETF holdings, which reflect institutional positioning
- Retail investors, who drive physical purchases during uncertainty
- The gold-silver ratio historically averages between 60 and 80
Supply-side factors:
- Approximately 70% of silver is a result of byproduct production
- Geographic concentration in Mexico, Peru, China and Poland
- Limited ability to rapidly increase output
Traders can use MetaTrader 5 to implement strategies considering these diverse factors.
Silver supply and demand dynamics: A fundamental analysis
Silver supply and demand determine fundamental price equilibrium. The market structure shows unique characteristics that distinguish silver from other commodities.
Demand breakdown:
- Industrial uses: ~50% of total demand (record 680.5 million ounces in 2024)
- Investment: ~25% (ETFs, coins and bars)
- Jewellery and silverware: ~20%
- Other applications: ~5%
Supply sources:
- Mine production: 800-850 million ounces annually (70% as byproduct)
- Primary silver mines: Concentrated in Mexico, Peru, China and Poland
- Recycling: Reached 193.9 million ounces in 2024
- Government sales: Variable contributor
Market balance: The silver market faces its fifth consecutive deficit year, with a cumulative shortfall of 820 million ounces from 2021 to 2026. Mine production remains flat at approximately 813 million ounces, as silver production responds more to base metal economics than silver prices. Structural demand from green technologies continues to grow as industrial applications expand.
The Silver Institute: Market authority and investment resources
The Silver Institute serves as an international association representing the silver industry, publishing the World Silver Survey annually with comprehensive market data. The organisation provides authoritative research on supply, demand and investment trends, functioning as the definitive source of silver market intelligence. The Institute's research emphasises silver as an investment vehicle, highlighting its unique characteristics compared to other precious metals.
The Institute documented an ongoing structural deficit for 2026, with industrial demand remaining at record levels. Silver investment offers exposure to precious metals with industrial upside, while silver allocation complements gold holdings in diversified portfolios. Their resources help investors understand silver's dual nature as both a precious and an industrial metal.
Silver price history for the last 10 years
Historical silver prices provide context for current valuations and demonstrate the metal's characteristic volatility patterns.

Key historical periods:
- 2011: All-time high near $50 per ounce
- 2015-2016: Lows around $14 marked the bottom of the bear market
- 2020: COVID rally pushed prices to $28
- 2021: A Reddit squeeze attempt briefly reached $30
- 2024: New rally began, rising from $24 to $35
- 2025: Historic surge to over $62, reaching record $64.30 on 14 December
Market Characteristics: Silver bull markets typically feature explosive moves that outperform gold, while bear markets see sharper declines than gold. The metal tends to lag gold initially, then outperform late in cycles. The 2025 surge represented a 120% annual gain, marking the strongest performance since 1979. The gold-silver ratio fell below 67, reaching its lowest level since June 2021, driven by tight market conditions, low Chinese inventories and declining Comex stocks.
How is silver performing now?
Silver is currently trading near $63.68 per ounce following 2025's historical rally. Recent performance reflects robust industrial demand, strong ETF inflows exceeding 95 million ounces, and tight physical market conditions. Investor sentiment influences short-term movements, with positioning data revealing trader expectations. Sentiment extremes often precede price reversals. Lease rates for physical silver rose to record levels, indicating genuine delivery stress. The Federal Reserve's December 2025 rate cut, with signals for further cuts in 2026-2027, supports precious metals. A weaker dollar and lower real rates reduce opportunity costs for holding metal, while structural industrial demand from solar, EVs and data infrastructure continues to expand.
Silver investment vehicles: Physical, ETFs and mining stocks
Investors and traders can access silver exposure through multiple vehicles, each offering distinct characteristics.
Physical silver:
- Forms: Coins (American Eagles, Canadian Maples), bars (1-100 oz), rounds
- Advantages: No counterparty risk, tangible ownership
- Considerations: Premiums over spot, storage requirements, insurance costs
Silver ETFs:
- Major options: iShares Silver Trust (SLV), Sprott Physical Silver Trust (PSLV)
- Advantages: High liquidity, low costs, easy trading, no storage needs
- Considerations: Management fees, no physical possession, tracking error
- Structural differences: SLV (paper-backed) vs PSLV (fully allocated physical)
Mining stocks:
- Individual stocks: First Majestic Silver, Pan American Silver and Wheaton Precious Metals
- ETF options: SIL, SILJ provide diversified mining exposure
- Leverage characteristics: Typically amplify silver price moves in both directions
- Additional risks: Operational issues, management quality, geopolitical factors, capital allocation
What to do with silver: Trade or invest?
Silver suits both trading and long-term investment strategies, depending on individual goals and timeframes.
Silver trading approach:
- Suitable for: Active participants seeking volatility exposure
- Advantages: Higher volatility than gold (2-5% daily moves), leverage to gold movements (beta >1), clear technical trading opportunities
- Timeframes: Intraday to several weeks
- Risk management: Stop-loss orders, position sizing, understanding leverage products. Successful silver trading strategies require understanding both technical indicators and fundamental market drivers
- Tools: CFDs on silver enable profit from price movements
Long-term silver investing:
- Investment thesis: Supply constraints, industrial demand growth from solar/EVs/technology, portfolio diversification benefits
- Portfolio allocation: Typically, 5-15% in precious metals
- Holding period: Minimum 3-5 years to capture full market cycles
- Benefits: Inflation hedge, lower correlation to equities, exposure to green energy megatrend. Physical silver investment through coins and bars provides direct exposure without counterparty risk
- Considerations: Personal risk tolerance, portfolio goals, combination of physical metal or ETFs
FAQ
How much will silver be worth in 2026?
Silver price forecasts for 2026 indicate a range between $53.90 and $97.30 according to LongForecast, with a projected year-end price of $64.04. Bank of America predicts an average of $56 with potential spikes to $65. Actual development depends on technological advancement, partnerships, and market sentiment.
Is silver expected to go up or down?
Most analysts expect rising silver prices due to structural factors: supply deficits, growing industrial demand from solar and electric vehicles, and monetary support through Fed rate cuts. The Silver Institute projects ongoing deficits through 2026.
What is the 5-year forecast for silver prices?
Long-term predictions suggest prices between $249.98 and $309.73 by 2030-2032 according to CoinPriceForecast, depending on market cycles, technological advances and regulatory developments. Experts like Larry Lepard see potential for silver to push significantly higher by mid-2026.
Will silver go to $100 an ounce?
Several analysts consider $100 silver possible, including Keith Neumeyer of First Majestic Silver and Larry Lepard. Bank of America sees potential for the price to reach $65. Reaching $100 requires continued supply deficits, robust industrial demand and positive monetary conditions
Disclaimer: The information in this article is not intended to be and does not constitute investment advice or any other form of advice or recommendation of any sort offered or endorsed by Libertex. Past performance does not guarantee future results.
Why trade with Libertex?
- Get access to a free demo account free of charge.
- Enjoy technical support from an operator 5 days a week, from 9 a.m. to 9 p.m. (Central European Standard Time).
- Use a multiplier of up to 1:30 (for retail clients).
- Operate on a platform for any device: Libertex and MetaTrader.