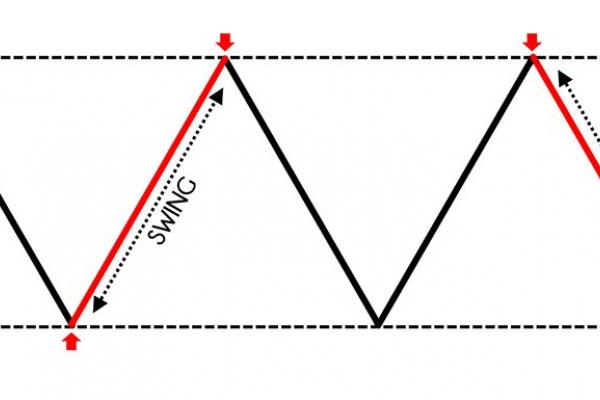

What is Swing Trading?
The term swing trading is derived from the fact that this trading method involves technical analysis of the historical price movements and their tendency to repeat to a certain degree. In short, the market is judged only on its merit, the movement it represents and its volatility. As such, it's one of the oldest trading methods around.
What swing trading is and how it works
The goal is always to trade the swing corresponding to the big picture market trend to increase one's win rate.
What is swing trading, you ask? This forex trading methodology relies wholly on technical analysis to forecast the next price movement and take advantage of it to gain some profits.
The primary purpose of swing trading is to consistently make small profits without having to keep on looking at one's trading screen every minute. You do a market analysis using your preferred tool, enter into a position and then monitor it for profits over the next few days or even weeks.
Some of the most popular indicators used to analyse the market for swing trading are:
- Fibonacci levels
- Supports and Resistance
- MACD crossover
- Channels
How to swing trade
Just like the name suggests, when swing trading, a trader seeks to exploit the cyclical price movement to make profits. These movements can either be upwards, downwards or sideways. It's a trading strategy that, when mastered, can be used to trade in all market types: bull, bear and ranging markets.
The trick in swing trading is learning to get in on the action early enough and ride the market momentum long enough to make a profit.
For this to happen, a trader must ensure that their strategy has these key elements:
- An entry point and trigger
- A Stop-Loss
- A Take-Profit point
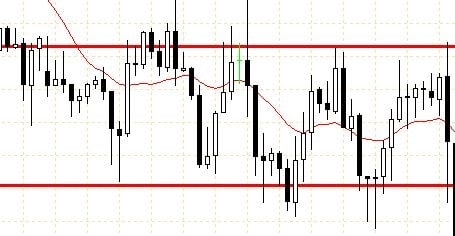
For example, a swing trader using support and resistance levels as their main trading tool will have their Stop-Loss 5-10 pips below the support level —usually the previous low for an uptrend and the previous high for a downtrend. The entry point would be around 50-100pips from this support. The Take-Profit would be 80% to 95% of the movement to the previous resistance level. In this example, the price action around the support level will dictate whether to enter a position. Profits can also be taken partially where market volatility or momentum decreases, allowing the rest to go to the Take-Profit point. This is a strategy used to ensure that a trader always has something to take home even if the market reverses.
In the chart above, the support level price is 71.624, while the resistance is 72.085. If one decided to take a bullish position right now, the Stop-Loss would be at 71.630 while the Take-Profit level would be at 72.000.
Advantages and disadvantages of swing trading
Swing trading comes with both potential benefits if used wisely and also shortcomings as a trading strategy.
The major merits of this popular trading methodology include:
Advantages
- Clear trading boundaries. The swing system outlines precisely when to enter into a position, the most strategic Stop-Loss, and the best Take-Profit point. Following this religiously ensures losses are cut short early enough, and winning trades are left to run.
- Natural market movement. One of the major reasons why people lose in forex trading is trying to fight the market and its flow. Swing trading, at its core, exploits the natural flow and movements of the market to get into profitable positions. It's all about identifying where the market has been, where it currently is, and its probability of revisiting a previously identified position and then taking advantage of this.
- Smaller Stop-Losses. Except for intra-day trading strategies, swing trading has the lowest Stop-Losses. This means that the risk associated with every position taken is relatively lower, so one's investments are better protected. The ideal swing strategy also advocates for a minimum 3:1 profit-to-loss ratio: Every position taken should have the potential to bear three times the earnings compared to the trade risk.
- Ability to trade often. As a medium-term trading strategy, swing trading allows for the discovery of trading options as they arise because one is in and out of trades relatively quickly. Due to its roots in the cyclical movement, it also allows for trading with the trend and trading the counter-trend. Hence more trading opportunities.
Disadvantages:
Swing trading exposes you to greater risks. Swing traders are involved in many markets at the same time. This can be a disadvantage and put too much capital at risk in the markets if the swing trading strategy fails to deliver.
- Opening gaps. Swing trading involves holding positions over many trading days. Sometimes, markets may open with considerable price gaps, and if the gap is against a position, it means instant losses.
- High Stop-Loss hit rate. Swing trading has tiny Stop-Loss margins, which sometimes aren't enough to allow the market time to pull back to get the required momentum. This means that the potential for a position to hit its Stop-Loss is high, and every hit leads to lost funds.
- Market unpredictability. Swing trading is about probabilities. As such, the market doesn't always behave the way technical analysis suggests it will. If you don't adhere to proper risk profiles, you can lose a great portion of your trading account.
- Overnight risks. Your trades are subject to overnight price swings. Irrespective of market trends, the market remains unpredictable, and your market analysis is at best a prediction since nothing is certain in the financial market. Getting caught in a congested market with violent swings in each direction can stop you out repeatedly, causing many losses.
- Not all stocks qualify for swing trading. It is possible to do swing trading in all stocks. However, blue chip stocks of established companies that are usually rock-steady may not be the best candidates.
Swing trading strategies
All strategies for swing trading can be traced to specific technical indicators because this is a methodology rooted in market movement analysis. The most popular swing trading strategies are:
MACD Crossover
This is one of the most widely recognised and used swing trading strategies because it shows both a trend direction and reversal. The MACD indicator has two lines: A signal line set at zero and a moving average line. Any time the moving average crosses the signal line suggests the potential for a trade. A cross on the upside for a bullish position, while a cross to the downside indicates a bearish position.
A crossover in the opposite direction given the position held signals for an exit point for that position.
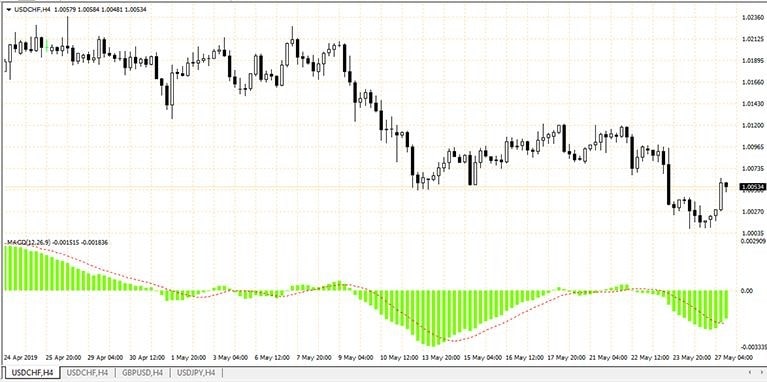
In this chart, the moving average is in red, while the white bars represent market volatility. The more significant the bars are, the higher the market volatility. From the chart, it's clear that anytime the moving average crosses over, we're in a downtrend or uptrend, depending on the direction of the cross. However, the major disadvantage of this, as can be seen, is that by the time the crossover happens, the trend has been going for quite some time, meaning entry is delayed.
Fibonacci Retracement
This is a forex technical analysis tool used to identify support and resistance levels. Over time, it has been observed that forex markets tend to pull back to some set levels before continuing in whichever long-term trend the market currently is in. These levels came to be known as the Fibonacci levels and are in the form of a percentage of the overall market movement: 61.8%, 23.6% and 38.2%. Recently, traders have also added a 50% level because of the high probability observed of a trade retracing after moving half of its former distance.
Swing trading uses these levels to define a position entry point and to set Stop-Loss and Take-Profit levels.
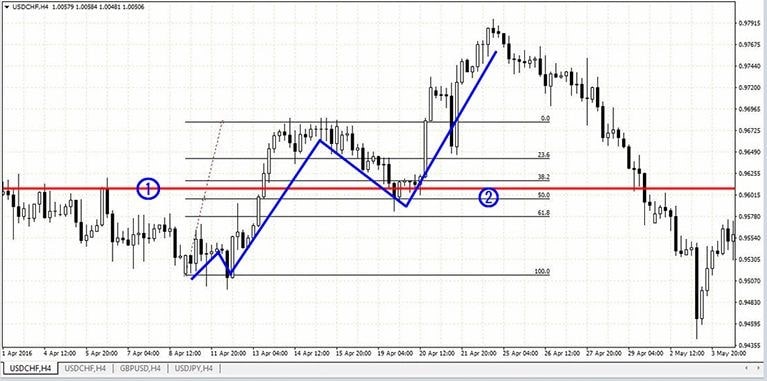
Looking at this image, for this uptrend, the Fibonacci drawing point is the lowest price of the last bearish candle. The second drawing point is the last swing high. From there, any time the price retraces to any of the levels, you can take a bullish position to trend with the trend.
Supports and resistance
This has long been regarded as the foundation of technical analysis for forex trading. A support level refers to a price level where buying pressure has already overcome selling pressure causing a change in trend. A resistance level, on the other hand, refers to a price level that has previously demonstrated selling pressure overcoming buying pressure leading to a bullish trend turning bearish.
Swing traders use these points to map their entry, Stop-Loss and Take-Profit. In a bullish position, a trader waits for the prices to bounce off the support level and enters a buy position with the Stop-Loss a few pips below the support. Traders can then set their take profit within sight of the previous resistance level. The reverse is also true for bearish positions.
A considerable breach in either support or resistance level converts the level breached to its opposite: support that has been broken becomes a resistance level while a resistance level broken becomes support.
Channel trading
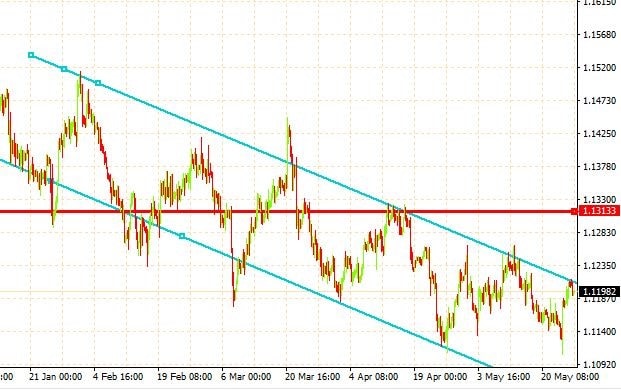
This is a strategy that works best with market conditions that are clearly defined as either bullish or bearish. The trick here is to always trade with the trend. When you plot a channel on a bullish trend, you enter into a buy position when the price bounces off the bottom of the channel, and you use the previous bounce of the channel top as your take profit level. The last bounce off the bottom is now used as the Stop-Loss level. For a bearish position, the opposite is the way to go. On the chart below, the blue diagonal lines represent the channel for trade in this bearish market. Every time the price hits the channel, it bounces back off it.
Caveat: the best risk management method is to always trade with the trend. In the case below, the best trades would have taken bearish positions after a channel bounce at the top.
For example, the moment the price hits the channel at 1.13152, channel trading dictates that the price will bounce downwards. As a result, one should place a sell order a few pips below the channel hit, in this case, 1.12797. The Stop-Loss should be a few pips above the previous channel hit, 1.13841, while the take profit is within the previous channel hit at the channel bottom, 1.11273. This is a trade that had 150 pips movement, a very profitable trade with the trend using channels.
Day trading vs swing trading
The major difference between day trading and swing trading is the time frames that are analysed and the time a position is held. The other differences include:
|
Day trading |
Swing trading |
|
Positions closed at the end of the trading day |
Positions usually held overnight and longer |
|
Larger position size |
Relatively smaller position size |
|
Use both fundamental and technical analysis |
Can exclusively rely on technical analysis |
|
More time on the screen required to monitor trades |
Less on-screen trading time required |
Which financial instruments are the best for swing trading?
This is a question that is as old as trading itself. It would be of no help to anyone to know a winning strategy like swing trading but not to know what instruments to apply it to. Historically, swing trading was mostly used for large-cap stocks trading: Stocks of firms with large market capitalisation, $10 billion and above. However, the opening up of forex markets has seen almost all the forex instruments conform to the market dynamics of supply and demand. All one needs to do is identify if an instrument displays the tell-tale signs of normal market behaviour, up and down, and voilà! You have an instrument to use for swing trading.
Conclusion
With this article, you're on your way to becoming an excellent swing trader. All that remains now is for you to pick a CFD broker that'll give you not only all the instruments to use with your swing strategies but the fast market executions.
That broker is Libertex. It'll ease your swing strategy by offering you the best tools for trading. Apart from the fast market execution times, you get to enjoy an array of technical indicators to help you make all the analyses.
If you're keen to get started with swing trading,Libertex is the platform for you. Libertex is a broker which offers CFDs stocks, commodities, indices, ETFs and cryptocurrencies with leverage. But please note that trading CFDs with leverage can be risky and can lead to losing all of your invested capital.You can learn more about swing trading without risking any capital by opening a demo account with Libertex today.
Disclaimer: The information in this article is not intended to be and does not constitute investment advice or any other form of advice or recommendation of any sort offered or endorsed by Libertex. Past performance does not guarantee future results.
Why trade with Libertex?
- Get access to a free demo account free of charge.
- Enjoy technical support from an operator 5 days a week, from 9 a.m. to 9 p.m. (Central European Standard Time).
- Use a multiplier of up to 1:30 (for retail clients).
- Operate on a platform for any device: Libertex and MetaTrader.