Bull Flag Pattern in Trading. Open Long Trades
Prepared by the Libertex team
Content reviewed internally in accordance with regulatory standards.
In the world of technical indicators and patterns, finding a reliable, workable tool that would help you predict price direction is challenging. Flag patterns are one of the key short-term continuation patterns you should be equipped with.
There are two types of flag patterns: Bull and bear. This article is about the bull flag pattern that alludes to an uptrend continuation. It isn't as simple as it looks. So we gathered tips to help you manage this technical tool effectively.
What Is the Bull Flag, and How Does It Work?
Before we take an in-depth look at the bull flag, let us remind you what the flag pattern is.
A flag is a short-term continuation chart pattern that predicts the existing trend will stay in force. It's loved by investors worldwide for providing strong signals and can be found on any timeframe and any asset.
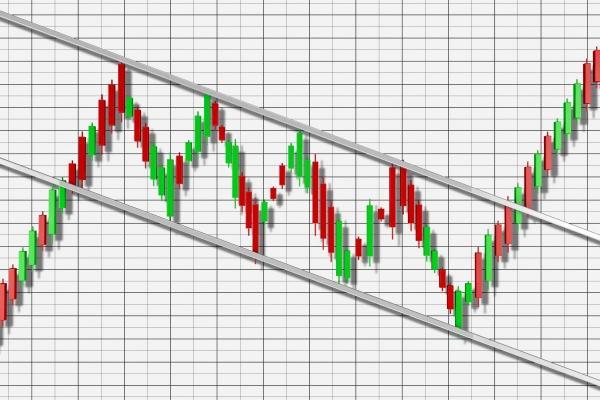
There are two types of flag patterns: Bearish and bullish. Both of them look like a sloping rectangle framed by two trend lines that serve as resistance and support levels.
A bull flag represents a bullish type of flag pattern. It occurs due to the weakness of bulls pushing the price up before.
A sharp uptrend should always precede the pattern followed by a correction. The pattern is short-term because it's just a consolidation within the overall trend. The correction or the pattern term depends on the timeframe.
A bull flag represents a bullish type of flag pattern. It occurs due to the weakness of bulls who were pushing the price up before. As a result, there's a correction, a pattern that signals the price will keep rising.
In common words, the bull flag pattern appears due to a pause in the uptrend. It's the time of price consolidation, after which the price continues to move up.
Look at the picture below.
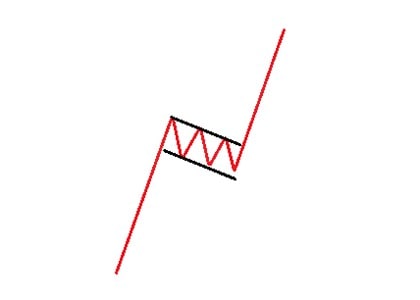
The bull flag is a sloping rectangle moving downward formed by two parallel trend lines that serve as support and resistance levels. The main idea is to trade in the overall trend direction and never against it. A trader should place an order above the resistance when the breakout occurs.
The idea of the bull flag pattern is to trade in the overall trend direction and never against it. A trader should place an order above the resistance when the breakout occurs.
Bull Flag Pattern in Trading: Example on the Forex Market
What about real examples?
We have a daily trading chart of the EUR/USD pair. The price corrected for three weeks during the strong uptrend but continued its upward movement later.
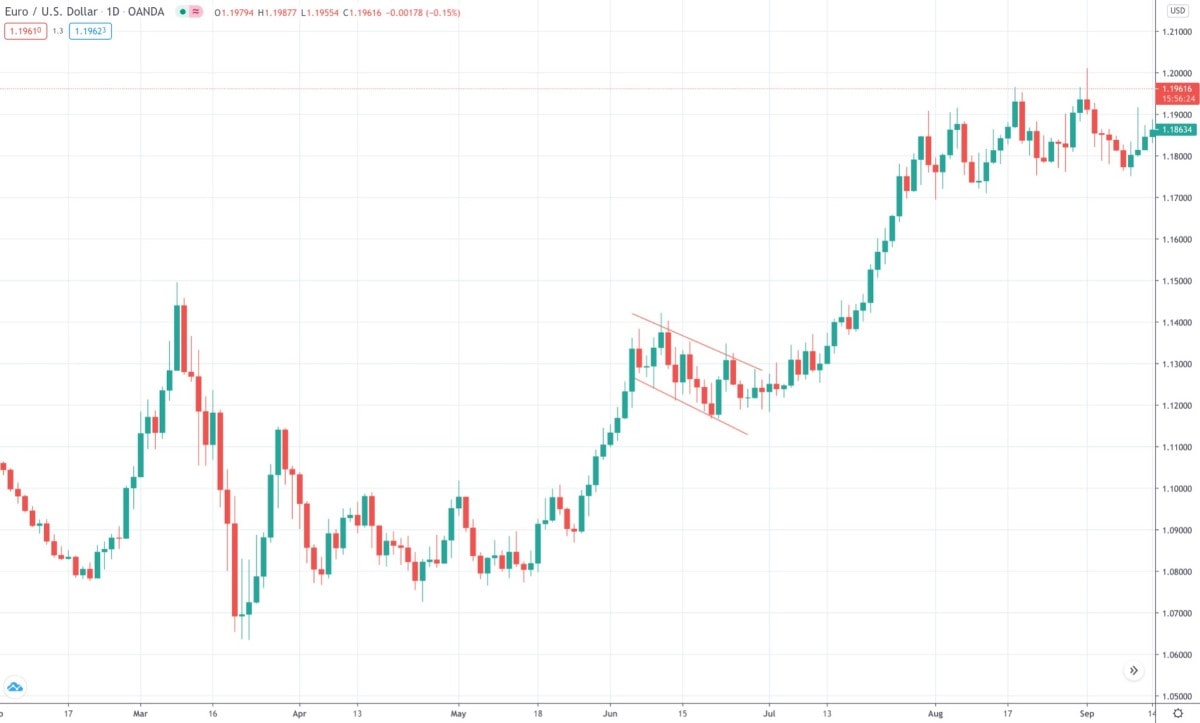
The pattern can be applied to the Forex market, stock, cryptocurrencies, commodities, etc.
Advantages and Disadvantages of Trading the Bull Flag Pattern
Any technical tool has benefits and limitations. The bull flag is no exception.
|
Benefits |
Limitations |
|
Can be found for any asset, including stocks |
Not easy for beginners |
|
Can be found on any timeframe |
Rare |
|
Provides an entry level |
Not all signals work |
|
Provides a limit level |
Difficult to distinguish from the rectangle pattern |
|
Provides traders with a signal on the uptrend continuation |
The bull pattern is a key element of many trading strategies. It's helpful as a sign of the trend continuation and a tool that provides entry and limit levels.
The pattern can be used on different time frames and any security, including currencies, CFDs, futures and stocks. Still, it's more common for fx and stock markets.
The pattern is difficult for beginners as it resembles the rectangle chart pattern. Also, it doesn't occur on the price chart often and may provide fake signals.
The pattern has limitations and is difficult for beginners as it resembles the rectangle chart pattern. It doesn't occur on the price chart often and may provide fake signals.
Bull Flag and Rectangle Patterns in Trading
Sometimes, it's hard to distinguish the trading flag pattern from the rectangle one.
|
Similarities |
Differences |
|
Trend lines frame both |
The rectangle pattern is formed horizontally. At the same time, the bull flag is a rectangle that moves down |
|
Both are formed during a pause in the trend |
|
|
Both are rectangles |
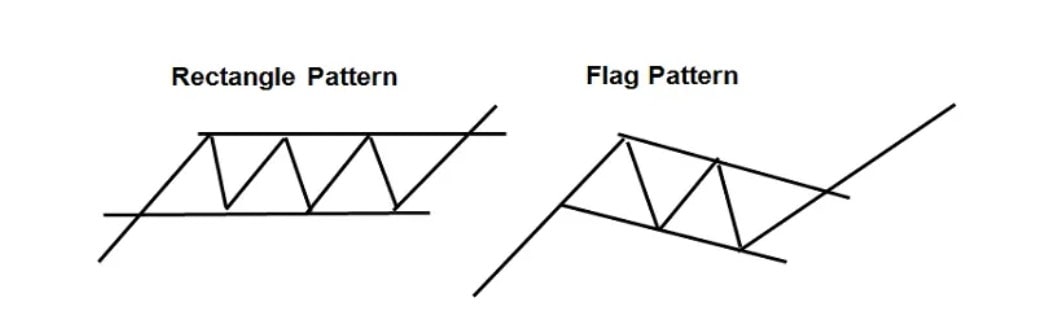
The rectangle pattern is formed horizontally, while the bull flag is a rectangle that moves down.
Look at the picture below to see the difference.
How to Identify the Bull Flag Chart Pattern
The flag pattern resembles a rectangular pattern. A trader should be careful when defining the bull flag candlestick pattern.
Here are some steps to help you determine the bull flag pattern.
- Step 1. There should be an uptrend as the bull flag is a continuation pattern, not a reversal.
- Step 2. The correction should start, and the price should drop. It's supposed to be a bull flag.
- Step 3. If the retracement is below 50%, it's not a flag pattern. The retracement shouldn't be lower than 38% of the trend.
- Step 4. Draw parallel trend lines of the pattern.
- Step 5. In the end, the price should break above the upper boundary of the pattern.
Trading Volumes for the Bull Flag
To validate the formation of the bull flag in your trading, you can use the Volume indicator. The bull flag is a chart pattern formed within a sharp upside movement. High trading volumes accompany the sharp rise.
When the price consolidates, the Volume indicator is anticipated to decrease as bulls aren't strong anymore.
When the price consolidates, the Volume indicator is expected to decrease as bulls aren't strong anymore. Simultaneously, the upward breakout of the flag's resistance will signal the strength of bulls, so the trading volumes should increase. It'll confirm the uptrend continuation.
Bull Flag vs Bear Flag
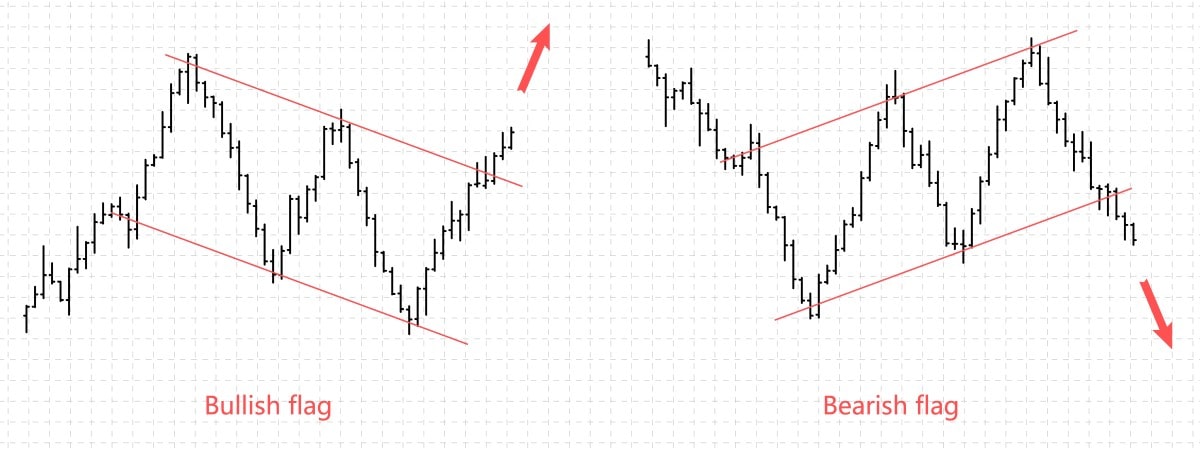
Bull and bear flags are just two types of flag patterns mirroring each other.
The key difference is that the bull flag occurs in the uptrend. The bear flag is a downtrend continuation pattern.
- If the bull flag occurs in the uptrend, the bear flag continues the downtrend.
- The bull flag pattern works if only the price breaks above the upper boundary. The bear pattern succeeds when the price breaks below the bottom line.
- The bull and bear flags define the Take-Profit target regarding the flagpole's length.
The picture below reflects the main differences.
How to Use a Bull Flag in Trading. Top Strategy
The bull flag pattern isn't complicated. That's why it's used in many trading strategies.
Strategy 1
It's the main trading strategy of the bull flag pattern.
- Step 1. As the pattern is formed within the uptrend, find a strong upward movement and wait until the price consolidates. It should move downwards but not more than 35%.
- Step 2. To define key levels, measure the difference between the start and end points of the uptrend (preceding the consolidation). The Take-Profit target should proportionate this distance.
- Step 3. The strategy will work only if the pattern is fully formed. The formation is confirmed when the price breaks above the flag's upper boundary (or so-called resistance).
- Step 4. Open a buy position on the breakout. Place stop loss below the bottom line (the distance of 3-10 pips depending on the timeframe is highly recommended).
- Step 5. Now, it's time to define the Take-Profit level. It should be similar to the length you measured at the second step. The pips should be counted from the breakout.
Volatility is a crucial part of any trading. Thus, the Take-Profit order can be too far in the highly liquid market. We would recommend using trailing take profit.
Strategy 2: Bull Flag and Trading Volumes
In this strategy, we'll confirm the bull flag signal with the Volume indicator.
- Step 1. The price should form the bull flag pattern. Although it's confirmed only when the price breaks above the flag's resistance, you can apply the strategy if you see a formation that resembles the bull flag pattern.
- Step 2. Apply the Volume indicator on the price chart. The trading volume is anticipated to decrease during the price correction.
- Step 3. If the trading volumes rise after the correction and the price breaks above the bull flag's upper boundary, it's a sign of the trend's continuation.
- Step 4. The Stop-Loss order should be placed below the support line of the bull flag.
- Step 5. The Take-Profit level can be defined by the risk/reward ratio. We always recommend using a 1:2 ratio. Thus, if you risk 10 pips, your profit should be 20 pips above the entry point.
Strategy 3: The Bull Flag Pattern and Fibonacci Retracements
Fibonacci retracements are used as support and resistance levels. The price is expected to retrace at those, so there'll be a pullback.
A bull flag is a pattern of market consolidation. Fibo levels will help define the level from which the price will rebound.
- Step 1. First of all, find an upward trend.
- Step 2. Next, find consolidation. It's supposed to be a bull flag pattern.
- Step 3. Implement the Fibonacci levels to the chart. The Fibo levels determine reversal points. They'll be used to define when the price will turn around and continue moving up.
- Step 4. Then wait for the price to reach the Fibonacci level. It'll signal a possible price reversal and the uptrend's continuation.
- Step 5. When the price breaks the bull flag pattern's upper boundary, you should expect the trend to keep rising.
- Step 6. The stop loss can be placed below the bottom line of the bull flag.
- Step 7. This strategy hardly defines the Take-Profit level. Still, you can use the rule applied in Strategy 1. Measure the distance between the start of the trend and the consolidation.
Key Tips About the Bull Flag Chart Pattern
Although the bull flag seems simple, there are some tips for trading this continuation pattern.
You should remember that the uptrend's decline of more than 38% can be the first alert of the downtrend. Still, if the price doesn't decline by more than 38%, there's a higher chance the major trend will continue.
- Wait for the pattern to be formed. It's not formed until the price breaks above the upper boundary. Before that, it's just a consolidation that can lead to a price reversal.
- Signal confirmation. Every signal should be double-confirmed. We've mentioned the Volume indicator that can confirm the upward trend continuation and the bull flag's effectiveness.
- The bull flag is a period of trend correction. The price goes slightly down during the pattern. As a result, traders may consider this slide the start of the downtrend. You should remember that the uptrend's decline of more than 38% can be the first alert of the downtrend. Still, if the price doesn't decline by more than 38%, there's a high chance the major trend will continue.
Conclusion. Use or Avoid the Bull Flag Pattern
The bull flag isn't a difficult pattern that can occur at any time and for any asset. It provides a signal of the uptrend's continuation. The bull flag is a well-known pattern worldwide.
At the same time, this pattern can provide fake signals. Consider using a Libertex demo account that allows traders to practise without any risk for their funds. The account provides real-time trading conditions and a wide range of CFDs trading underlying assets.
Let's sum up.
FAQ
What Is a Bull Flag Pattern?
A bull flag pattern is a short-term consolidation chart pattern formed within a sharp upward movement that signals the uptrend continuation.
Is a Bull Flag Bullish?
Yes, the bull flag is bullish as it signals the uptrend will continue.
How to Trade a Bull Flag?
A trader should wait for the pattern to be formed. It's formed when the price breaks above the flag's upper line. After that, the trader can open a buying position.
How Do You Identify a Flag Pattern?
A flag pattern is a correction within a strong trend. During the correction, the price should move slightly opposite to the main trend. If the price doesn't exceed a 50% deviation from the overall trend, there's a high chance it's a flag pattern.
How to Measure the Bull Flag?
To measure the Take-Profit target of the bull flag, you need to count the distance between the start of the trend and the correction. This distance should be counted from the breakout of the upper boundary of the bull flag.
Disclaimer: The information in this article is not intended to be and does not constitute investment advice or any other form of advice or recommendation of any sort offered or endorsed by Libertex. Past performance does not guarantee future results.
Why trade with Libertex?
- Get access to a free demo account free of charge.
- Enjoy technical support from an operator 5 days a week, from 9 a.m. to 9 p.m. (Central European Standard Time).
- Use a multiplier of up to 1:30 (for retail clients).
- Operate on a platform for any device: Libertex and MetaTrader.