Ethereum Price Prediction 2026–2037: Expert Forecast and Technical Analysis
Prepared by the Libertex team
Content reviewed internally in accordance with regulatory standards.
Ethereum (ETH) is the world's second-largest cryptocurrency by market capitalisation and the dominant smart contract platform globally. Its price reflects demand for decentralised computing infrastructure across DeFi, NFTs, stablecoins, and Web3 applications.
Proposed in 2013 by Vitalik Buterin and co-founded by Gavin Wood, Joseph Lubin, Charles Hoskinson, and Anthony Di Iorio, Ethereum launched in July 2015 and has since grown into the primary settlement layer for decentralised finance. From under $1 at launch to an all-time high above $4,800 in 2021, ETH has demonstrated both the potential and the volatility inherent to programmable blockchain assets. Traders seeking exposure to ETH price movements can sign up with Libertex and trade Ethereum CFDs on a regulated platform without managing a crypto wallet.
Ethereum price predictions vary widely because they use different methodologies and time horizons. The algorithmic sources used in this article — CoinPriceForecast and DigitalCoinPrice — use quantitative models based on historical price data, trend extrapolation, and cycle analysis. Forecasting accuracy decreases sharply with time horizon: treat monthly forecasts as directional signals and long-term 2030+ figures as scenario illustrations, not price targets. All forecasts are third-party estimates and do not constitute financial advice.
This guide brings together short-term ETH forecasts, monthly and annual predictions, technical analysis, and long-term scenarios from CoinPriceForecast and DigitalCoinPrice, alongside expert institutional views, to give a complete picture of where ETH may be headed through 2030 and beyond.
Key Takeaways
- ETH is currently trading at approximately $2,292, with a market cap of $273 billion and 24h volume of $17.5 billion as of 15.05.2026.
- CoinPriceForecast projects ETH reaching $2,589 by mid-2026 and $2,751 by year-end, approximately +20% from current levels.
- DigitalCoinPrice forecasts ETH averaging $3,307 in 2026, with a range of $1,997–$5,117 across monthly projections.
- For 2027, CoinPriceForecast anticipates ETH at $2,658 by year-end, supported by continued DeFi adoption and post-Merge supply contraction.
- Long-term 2030 scenarios range from $3,850 to $6,843, depending on adoption trajectory. Treat these as directional scenarios, not price targets.
Key Updates
- ETH is currently priced at $2,292. The price changed by 1.34% over the past 30 days. Daily trading volume stands at approximately $17.5 billion; market capitalisation approximately $273 billion (15.05.2026).
- Over 37 million ETH — approximately 30% of circulating supply — is currently staked, generating ~3.3% annualised yield (15.05.2026).
- Total Value Locked across Ethereum-based DeFi protocols stands at approximately $45.4 billion as of 15.05.2026, with Uniswap remaining the leading DEX by volume.
- Since EIP-1559 activation in August 2021, over 4.6 million ETH have been permanently burned via the base fee mechanism, contributing to deflationary supply pressure.
Ethereum (ETH) Live Price
Ethereum Price Prediction 2026 – DigitalCoinPrice
DigitalCoinPrice forecasts ETH trading between $1,997 and $5,117 across 2026, with a monthly average of $3,307. The projected year-end price of $3,839 implies approximately +68% growth from current levels, driven by continued DeFi adoption and EIP-1559 burn dynamics.
|
Month |
Min ($) |
Avg ($) |
Max ($) |
Change (%) |
|
May 2026 |
2,236.67 |
2,236.67 |
2,236.67 |
-2.46 |
|
June 2026 |
2,243.77 |
2,279.76 |
2,315.75 |
-0.58 |
|
July 2026 |
2,584.69 |
2,743.25 |
2,901.8 |
19.64 |
|
August 2026 |
3,227.31 |
3,482.38 |
3,737.46 |
51.87 |
|
September 2026 |
4,861.81 |
4,861.81 |
4,861.81 |
112.03 |
|
October 2026 |
4,704.19 |
4,910.7 |
5,117.21 |
114.16 |
|
November 2026 |
4,266.55 |
4,455.66 |
4,644.77 |
94.32 |
|
December 2026 |
3,838.93 |
3,838.93 |
3,838.93 |
67.42 |
Source: DigitalCoinPrice (15.05.2026)
Ethereum Price Prediction 2027 – DigitalCoinPrice
For 2027, DigitalCoinPrice projects ETH in a range of $2,303–$3,811 with an average of $3,277, representing a year-on-year change of approximately −18% relative to the 2026 year-end close as Layer-2 scaling matures and institutional participation deepens.
|
Month |
Min ($) |
Avg ($) |
Max ($) |
Change (%) |
|
January 2027 |
3,299.8 |
3,432.48 |
3,565.16 |
49.7 |
|
February 2027 |
3,140.88 |
3,244.72 |
3,348.56 |
41.51 |
|
March 2027 |
3,502.26 |
3,502.26 |
3,502.26 |
52.74 |
|
April 2027 |
3,312.33 |
3,407.74 |
3,503.14 |
48.62 |
|
May 2027 |
2,426.38 |
2,654.94 |
2,883.49 |
15.79 |
|
June 2027 |
2,547.88 |
2,547.88 |
2,547.88 |
11.12 |
|
July 2027 |
3,121.12 |
3,255.25 |
3,389.37 |
41.97 |
|
August 2027 |
3,324.33 |
3,394.55 |
3,464.77 |
48.04 |
|
September 2027 |
3,786.21 |
3,798.4 |
3,810.59 |
65.65 |
|
October 2027 |
3,644.85 |
3,644.85 |
3,644.85 |
58.96 |
|
November 2027 |
3,256.05 |
3,306.85 |
3,357.66 |
44.22 |
|
December 2027 |
3,091.74 |
3,130.16 |
3,168.57 |
36.51 |
Source: DigitalCoinPrice (15.05.2026)
Ethereum Price Prediction 2028 – DigitalCoinPrice
DigitalCoinPrice's 2028 model projects ETH averaging $2,415–$4,947, with peak values potentially exceeding $4,947. By this point, Ethereum's ecosystem maturity, stablecoin activity, and Web3 adoption are expected to be primary demand drivers.
|
Month |
Min ($) |
Avg ($) |
Max ($) |
Change (%) |
|
January 2028 |
3,140.66 |
3,140.66 |
3,140.66 |
36.97 |
|
February 2028 |
3,526.36 |
3,552.73 |
3,579.11 |
54.94 |
|
March 2028 |
3,523.9 |
3,894.04 |
4,264.17 |
69.83 |
|
April 2028 |
4,459.36 |
4,459.36 |
4,459.36 |
94.48 |
|
May 2028 |
3,698.83 |
4,322.68 |
4,946.53 |
88.52 |
|
June 2028 |
3,224.28 |
3,447.04 |
3,669.81 |
50.33 |
|
July 2028 |
3,282.06 |
3,282.06 |
3,282.06 |
43.14 |
|
August 2028 |
2,940.99 |
2,971.69 |
3,002.39 |
29.6 |
|
September 2028 |
2,929.38 |
3,065.81 |
3,202.25 |
33.71 |
|
October 2028 |
2,799.19 |
2,887.68 |
2,976.18 |
25.94 |
|
November 2028 |
2,704.98 |
2,704.98 |
2,704.98 |
17.97 |
|
December 2028 |
2,475.8 |
2,571.01 |
2,666.23 |
12.13 |
Source: DigitalCoinPrice (15.05.2026)
Ethereum Long-Term Price Prediction 2029–2037 – CoinPriceForecast
CoinPriceForecast's long-term model projects ETH reaching $4,215 by 2030 year-end, and $5,307 by 2037. These are scenario-based extrapolations built on historical CAGR and adoption curve modelling; treat them as directional guidance only, not scheduled price targets.
|
Year |
Mid-Year ($) |
Year-End ($) |
vs Today (%) |
|
2029 |
3,818 |
4,245 |
85 |
|
2030 |
3,867 |
4,215 |
84 |
|
2031 |
4,414 |
4,083 |
78 |
|
2032 |
4,362 |
4,642 |
102 |
|
2033 |
4,921 |
5,198 |
126 |
|
2034 |
4,923 |
4,876 |
112 |
|
2035 |
5,015 |
5,241 |
128 |
|
2036 |
5,466 |
5,306 |
131 |
|
2037 |
5,514 |
5,307 |
131 |
Source: CoinPriceForecast (15.05.2026)
Ethereum Technical Analysis
Technical analysis is a core component of any rigorous ETH price assessment, providing data-driven signals about market momentum, trend direction, and probable price zones. The indicators, moving averages, and pivot points below are sourced from Investing.com and reflect current 2026 ETH/USD conditions.
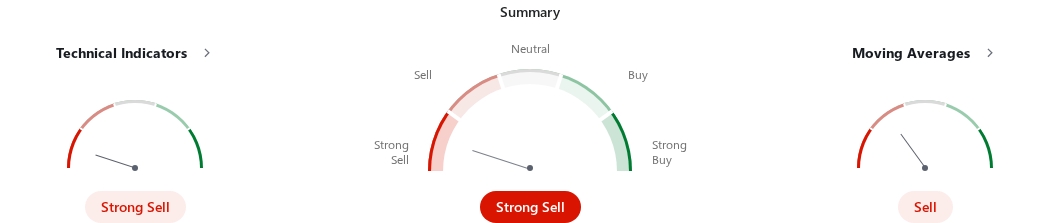
Technical Indicators
|
Indicator |
Value |
Signal |
|
RSI(14) |
56.81 |
Buy |
|
STOCH(9,6) |
79.7 |
Buy |
|
STOCHRSI(14) |
61.75 |
Buy |
|
MACD(12,26) |
7.76 |
Buy |
|
ADX(14) |
28.37 |
Sell |
|
Williams %R |
-31.65 |
Buy |
|
CCI(14) |
52.25 |
Buy |
|
ATR(14) |
16.25 |
High Volatility |
|
Highs/Lows(14) |
7.0785 |
Buy |
|
Ultimate Oscillator |
63.22 |
Buy |
|
ROC |
1.37 |
Buy |
|
Bull/Bear Power(13) |
12.85 |
Buy |
Source: Investing (15.05.2026)
Moving Averages
|
Period |
Simple Value |
Simple Signal |
Exponential Value |
Exponential Signal |
|
MA5 |
2,302.19 |
Sell |
2,297.35 |
Sell |
|
MA10 |
2,292.11 |
Buy |
2,292.43 |
Buy |
|
MA20 |
2,275.69 |
Buy |
2,284.31 |
Buy |
|
MA50 |
2,278.23 |
Buy |
2,283.94 |
Buy |
|
MA100 |
2,299.35 |
Sell |
2,291.16 |
Buy |
|
MA200 |
2,308.07 |
Sell |
2,301.52 |
Sell |
Source: Investing (15.05.2026)
Pivot Points
|
Name |
S3 |
S2 |
S1 |
Pivot |
R1 |
R2 |
R3 |
|
Classic |
2,277.88 |
2,283.27 |
2,290.5 |
2,295.9 |
2,303.13 |
2,308.53 |
2,315.76 |
|
Fibonacci |
2,283.27 |
2,288.1 |
2,291.08 |
2,295.9 |
2,300.72 |
2,303.7 |
2,308.53 |
|
Camarilla |
2,294.27 |
2,295.43 |
2,296.58 |
2,295.9 |
2,298.9 |
2,300.06 |
2,301.21 |
|
Woodie |
2,278.8 |
2,283.73 |
2,291.42 |
2,296.36 |
2,304.05 |
2,308.99 |
2,316.68 |
|
Demark |
- |
- |
2,286.89 |
2,294.09 |
2,299.52 |
- |
- |
Source: Investing (15.05.2026)
What Is Ethereum, and Why Does Its Price Matter?
Ethereum is a global programmable blockchain platform launched in July 2015, designed by Vitalik Buterin and co-founded by Gavin Wood, Joseph Lubin, Charles Hoskinson, and Anthony Di Iorio. Where Bitcoin introduced digital scarcity, Ethereum introduced programmability, which enables smart contracts, decentralised applications, and an entirely new financial infrastructure layer. ETH's price, therefore, reflects aggregate demand for decentralised computing power across the global ecosystem, not merely speculative sentiment.
ETH as a Programmable Blockchain Asset
Ethereum is a global computing platform enabling programmable transactions through smart contracts — self-executing agreements that run automatically when pre-defined conditions are met, without any intermediary. The Ethereum Virtual Machine (EVM) processes every smart contract execution across the network. Every interaction — a DeFi loan on Aave, an NFT mint on OpenSea, a token swap on Uniswap — requires ETH as gas (the fee paid for computation), directly linking ecosystem activity to ETH price demand.
How Ethereum Differs From Bitcoin in Price Behaviour
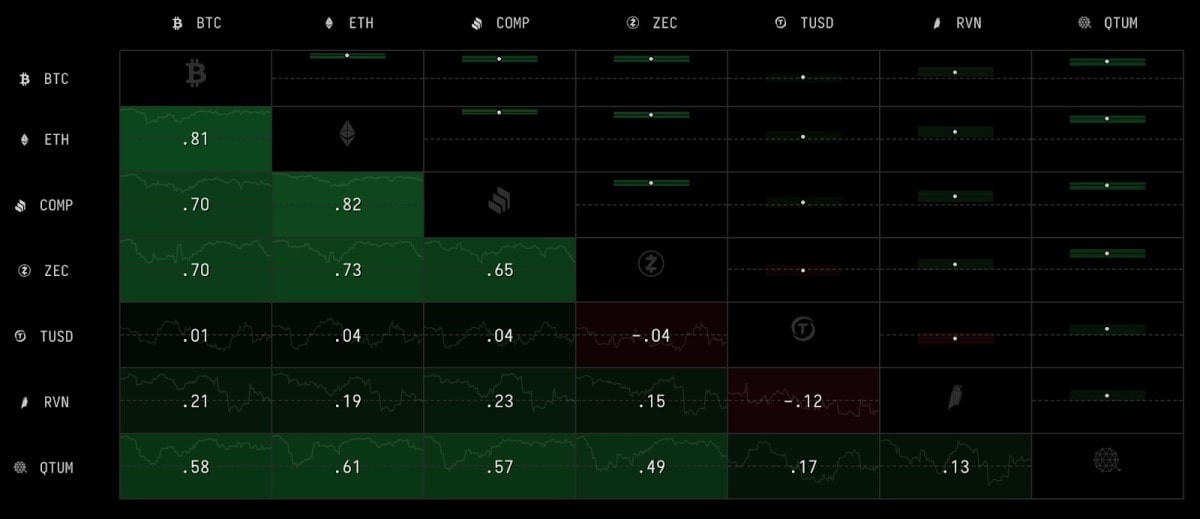
Bitcoin and Ethereum share positive price correlation (historically 0.81), but are structurally distinct assets with different price drivers:
- Supply model: Bitcoin has a hard cap of 21 million coins; Ethereum uses EIP-1559 burn to create activity-dependent conditional deflation: no fixed cap, but supply contracts under high demand.
- Consensus mechanism: Bitcoin uses Proof of Work; Ethereum shifted to Proof of Stake in September 2022 (The Merge), reducing issuance by approximately 90%.
- Primary price driver: Bitcoin's price is driven by store-of-value demand and coded scarcity; Ethereum's is driven by network utility demand: gas fees, DeFi TVL, NFT activity, and stablecoin volume.
- Programmability: Bitcoin is a ledger; Ethereum is programmable infrastructure: smart contracts and dApps are exclusive to Ethereum's architecture among major Layer-1s.
- Sell pressure: Bitcoin miners must sell regularly to cover energy costs; Ethereum validators have far lower operational overhead, reducing forced selling pressure.
Ethereum Name Service (ENS) and Ecosystem Adoption
The Ethereum Name Service (ENS) is the domain name system for Ethereum. It converts complex wallet addresses into human-readable names (e.g., "alice.eth"), making Web3 interaction accessible to mainstream users. ENS registration volume is a concrete adoption proxy: each registration is an on-chain Ethereum transaction consuming ETH gas. Growing ENS activity translates directly into measurable ETH demand and functions as a leading indicator of broader Web3 ecosystem expansion beyond DeFi and NFTs.
Ethereum Price Overview: Where ETH Stands Right Now
Before projecting where ETH is headed, this section establishes the current market baseline — price, market statistics, sentiment indicators, and recent performance — as the objective foundation for all forward-looking predictions. All data reflects 15.05.2026.
|
Metric |
Value |
|
Current Price |
$2,263 |
|
Market Capitalisation |
$273 billion |
|
24h Trading Volume |
$17.5 billion |
|
Circulating Supply |
120.69 million ETH |
|
All-Time High |
$4,891.70 (16 Nov 2021) |
|
All-Time Low |
$0.43 (Oct 2015) |
At the current market cap of approximately $273 billion, ETH is trading at roughly 47% of its all-time high market capitalisation of ~$580 billion reached in November 2021.
Ethereum Price Prediction 2027–2030
The four-year Bitcoin halving cycle is the primary macro organising principle for ETH's medium-term trajectory: Year 2 (2026) and Year 3 (2027) represent the historically strongest appreciation windows; Year 4 (2028) typically sees correction and consolidation. All projections below should be interpreted as scenario analysis, not scheduled outcomes.
ETH Price Target for 2027
2027 historically represents the peak appreciation window in the Bitcoin halving cycle. CoinPriceForecast projects ETH at $2,479–$2,658 for 2027, consistent with this cyclical pattern. Historical cycle patterns are not guarantees; regulatory and macro conditions could materially alter this trajectory.
Ethereum Price Prediction for 2028 and 2029
2028 is positioned as a likely post-peak correction year: based on historical cycle behaviour, ETH could retrace to a range of $3,082–$5,332, representing a −32.8% drawdown from a projected 2027 high. 2029 is forecast as a re-accumulation phase ahead of the next Bitcoin halving, with ETH trading in a range of $4,657–$7,588. Uncertainty bands for 2028–2029 are materially wider than for near-term forecasts.
Can ETH Reach New All-Time Highs by 2030?
Reaching a new ETH all-time high above $4,891 by 2030 is the base-case scenario for CoinPriceForecast, which projects $4,215 by 2030 year-end. The $10,000 milestone requires approximately +336% growth from current levels and a market cap of approximately $1.2 trillion. The $20,000+ scenario (ARK Invest bull case) requires a $2.4 trillion market cap and is a high-conviction tail scenario, not a central projection.
Ethereum Price Prediction 2031–2040 and Beyond
Decade-range ETH forecasts carry fundamentally wide uncertainty bands. The variables that will determine ETH's price in 2035 or 2040 — regulatory frameworks, competitive landscape, macroeconomic regimes, and Ethereum's own technical evolution — are not modellable with precision. The projections below are explicitly scenario illustrations grounded in historical CAGR analysis.
Long-Term ETH Forecast: 2031–2040
Based on CoinPriceForecast's algorithmic model — the primary long-term source used in this article — ETH is projected to reach $5,307 by 2037 year-end. This is the extent of available model data; projections beyond 2037 carry uncertainty bands too wide to be analytically useful. Scenarios where competing platforms significantly erode Ethereum's market share would compress even these near-decade estimates.
Why Long-Term Predictions Carry Wide Uncertainty Ranges
Well-constructed algorithmic forecasting models demonstrate the compound effect of uncertainty through increasing min/max spread as the forecast horizon extends. A one-year ETH forecast might show a $1,000 range; a five-year forecast shows $10,000+; a ten-year forecast may span $50,000+. This widening is a feature of methodological honesty, not a model weakness. Long-range ETH forecasts are best used as scenario-planning tools for directional thinking, not as trading schedules.
Fundamental Factors Driving the Ethereum Price
Technical indicators reflect what the market is doing; fundamental factors explain why. This section covers the structural forces determining Ethereum's long-term price direction beyond what chart patterns alone can capture.
EIP-1559 and ETH's Deflationary Supply Mechanism
Before EIP-1559 (August 2021), all transaction fees were paid to miners. After EIP-1559, each transaction permanently burns the base fee — removing ETH from circulation — while validators receive only the priority tip. This makes ETH conditionally deflationary: during high network activity, ETH issuance turns net negative. Cumulative ETH burned since August 2021: over 4.6 million ETH. EIP-1559 is the single most important structural change to Ethereum's economic model, equivalent to a permanent automated share buyback programme.
The Merge, Staking and Reduced ETH Issuance
The Merge (September 2022) reduced ETH issuance by approximately 90% by replacing Proof of Work with Proof of Stake validation. Combined with EIP-1559 burn, this is often described as the "triple halving." Currently, over 37 million ETH (~30% of supply) is staked, earning approximately 3–5% annualised yield and effectively removed from liquid circulation. Reduced liquid supply combined with sustained or growing demand creates structural price support.
Ethereum Upgrade History: Key Milestones
- Constantinople (Feb 2019): Reduced block rewards, improved EVM efficiency.
- Istanbul (Dec 2019): Improved Zcash interoperability, lower DeFi gas costs.
- London / EIP-1559 (Aug 2021): Base fee burn — most significant economic model change in Ethereum's history.
- The Merge (Sep 2022): Proof of Stake transition — 99%+ energy reduction, ~90% issuance reduction.
- Shanghai / Shapella (Apr 2023): Enabled staked ETH withdrawals — completing the PoS transition.
- Dencun / EIP-4844 (Mar 2024): Proto-danksharding (blobs) — dramatically reduced Layer-2 transaction costs.
- Pectra (2025): Validator improvements and account abstraction enhancements.
Ethereum Upgrades Roadmap: What's Coming Next
Ethereum's forward roadmap through 2026 and 2027 is centred on Fusaka — introducing full Danksharding (PeerDAS), which will massively expand blob capacity and reduce Layer-2 fees toward near-zero. Improved scalability expands the addressable user base for Ethereum dApps, increasing gas demand and ETH utility. Each upgrade announcement historically generates renewed network interest and a positive price signal.
Ethereum 2.0: The Broader Vision and Price Implications
The Ethereum Foundation has officially retired "Ethereum 1.0/2.0" terminology in favour of "execution layer" (transaction processing) and "consensus layer" (PoS block validation). The multi-year vision combines sharding, Layer-2 scaling, and account abstraction to make Ethereum capable of millions of transactions per second at near-zero cost, while maintaining the security and decentralisation that distinguish it from faster-but-centralised alternatives. As scalability improves and fees fall, the barrier to entry for new users drops — a demand multiplier with direct price implications.
What Is an Ethereum Killer? Competition and Price Impact
An "Ethereum Killer" is a blockchain designed to compete with Ethereum's smart contract platform position by offering higher speed, lower fees, or improved developer experience. The leading candidates are Solana (65,000+ TPS, sub-cent fees, but greater validator centralisation) and Cardano (peer-reviewed academic methodology, PoS, but lower DeFi adoption). Competitors have captured meaningful market share in specific DeFi and NFT niches. Ethereum's counter-thesis: $40B+ in TVL, the largest developer ecosystem globally, and Layer-2 scaling as its primary competitive response to the fee problem. In 2026, Ethereum retains approximately 55–60% of total DeFi TVL across all chains.
Institutional Adoption, DeFi and NFT Ecosystem Impact
Spot Ethereum ETF approval in the United States (2024) opened direct institutional access to ETH. ETF inflow data represents long-duration locked demand — fundamentally different from speculative trading flows. DeFi TVL (approximately $45.4 billion on Ethereum as of 15.05.2026) measures organic, utilisation-driven demand. NFT activity, while significantly lower than its 2021 peak, contributes to baseline gas demand. Consensys — developer of MetaMask and Infura — continues to expand Ethereum's enterprise and institutional tooling.
Bitcoin Halving Cycles and Their Effect on ETH Price
Bitcoin halving events — occurring approximately every four years — halve the BTC block reward and historically trigger a broad crypto bull cycle. Ethereum has historically followed Bitcoin higher with a 3–9 month lag post-halving, and has outperformed BTC in percentage terms during peak post-halving phases. This is observed historical behaviour, not a guaranteed template. The 2024 Bitcoin halving positions 2026 and 2027 within what has historically been the strongest ETH appreciation window.
Ethereum vs Bitcoin: Price Behaviour Compared
This section presents an objective, data-driven comparison of Ethereum and Bitcoin across price behaviour, supply models, consensus mechanisms, and investment characteristics. Neither asset is advocated for; both are assessed on structural merits to support informed decision-making.
Supply Caps, Issuance Models and Price Implications
Bitcoin's 21 million hard cap is guaranteed in code — scarcity is absolute and scheduled. Ethereum has no fixed supply cap, but EIP-1559 creates activity-dependent conditional deflation: under high network load, ETH issuance turns net negative. Over 4.6 million ETH has been burned to date, and approximately 37 million ETH is staked. The key investment distinction: Bitcoin offers guaranteed coded scarcity; Ethereum offers demand-responsive scarcity that strengthens precisely when network usage is highest.
Consensus Mechanisms and Market Impact Compared
Bitcoin's Proof of Work requires miners to sell BTC regularly to cover electricity and hardware costs — creating continuous structural selling pressure. Ethereum's Proof of Stake validators have minimal operational overhead, significantly reducing forced selling of ETH rewards. A comparison at a glance:
- Supply: BTC — fixed 21M cap | ETH — dynamic, conditionally deflationary under EIP-1559
- Consensus: BTC — Proof of Work | ETH — Proof of Stake (since Sep 2022)
- Primary use: BTC — store of value, digital gold | ETH — programmable infrastructure, gas for dApps
- Scalability: BTC — Lightning Network (limited adoption) | ETH — L2 ecosystem (Arbitrum, Base, Optimism)
- Environmental impact: BTC — high energy consumption | ETH — over 99% reduction post-Merge
- Staking yield: BTC — none | ETH — approximately 3–5% annualised
- Sell pressure: BTC — regular miner selling | ETH — minimal validator overhead
Is Ethereum a Good Investment Right Now?
This section synthesises the technical and fundamental evidence above into an objective assessment of the current 2026 ETH investment landscape. All content is informational and does not constitute personalised financial advice.
The Bullish Case for ETH
- Supply contraction: Over 4.6 million ETH burned since EIP-1559; over 37 million ETH staked — structural supply reduction at a historically significant scale.
- Post-halving cycle tailwinds:2026 sits within the historically strongest ETH appreciation window, two years post the 2024 Bitcoin halving.
- Institutional ETF demand: Spot ETH ETF approval opens the asset to institutionally managed capital; inflows represent long-duration locked demand.
- Dominant platform position: Ethereum retains approximately 55–60% of total DeFi TVL — structural moat from developer tooling, liquidity, and network effects.
- Staking yield: Approximately 3–5% annualised yield converts ETH from a pure growth asset to a yield-bearing asset, expanding the addressable investor base.
Understanding the Bearish Risks
- Regulatory headwinds: Ongoing SEC ambiguity about ETH's security status remains a meaningful overhang on US institutional adoption.
- Competitive market share loss: Solana has captured meaningful DeFi and NFT activity; continued competitor outperformance could structurally reduce Ethereum's share.
- ETF underperformance vs BTC: If spot ETH ETF inflows significantly underperform BTC ETF inflows, the institutional demand narrative weakens.
- Macro rate environment: ETH remains a risk asset — elevated interest rates reduce institutional appetite for speculative exposures.
- Technical breakdown risk: Failure to maintain the 200-day SMA as support would constitute a structural bearish signal.
Ethereum's Historical ROI: What Past Returns Indicate
|
Entry Point |
Approximate Entry Price |
ROI to Current 2026 Price |
|
ICO (2014) |
~$0.30 |
+754,233% |
|
2018 bear low |
~$85 |
+2,562% |
|
2022 bear low |
~$880 |
+157% |
Past returns do not guarantee future performance. Historical ROI data is presented for contextual position-sizing assessment only.
Analytical Assessment of ETH's Current Investment Profile
In 2026, the balance of evidence for ETH presents a constructive analytical outlook: structural supply reduction through burn and staking, post-halving cycle positioning, and institutional ETF access represent meaningful fundamental tailwinds; however, current neutral technical positioning and competitive pressure from Solana warrant monitoring. The most prudent framework is continuous market monitoring against the key technical levels and catalyst events identified in this article. This reflects an analytical perspective, not personalised financial advice.
Ethereum Price History
- 22 July – 2 September 2014. Public crowdsale: ETH purchasable with BTC for 42 days.
- 20 July 2015. Network launch; 72 million pre-mined coins. Price: ~$1.
- 7 September 2015. Frontier Thawing fork; 5,000 gas/block limit lifted. Price: $1.24.
- 20 July 2016. The DAO hack (3.6 million ETH drained). Hard fork to reverse stolen transactions — minority maintained original chain as Ethereum Classic (ETC). Price: $12.54 → $8.
- 22 November 2016. Spurious Dragon fork; DoS defence improvements. Price: $9.84.
- 13 June 2017. The price reached $391.89. Bancor Foundation raised $153M in ETH in 3 hours — the ICO boom was underway.
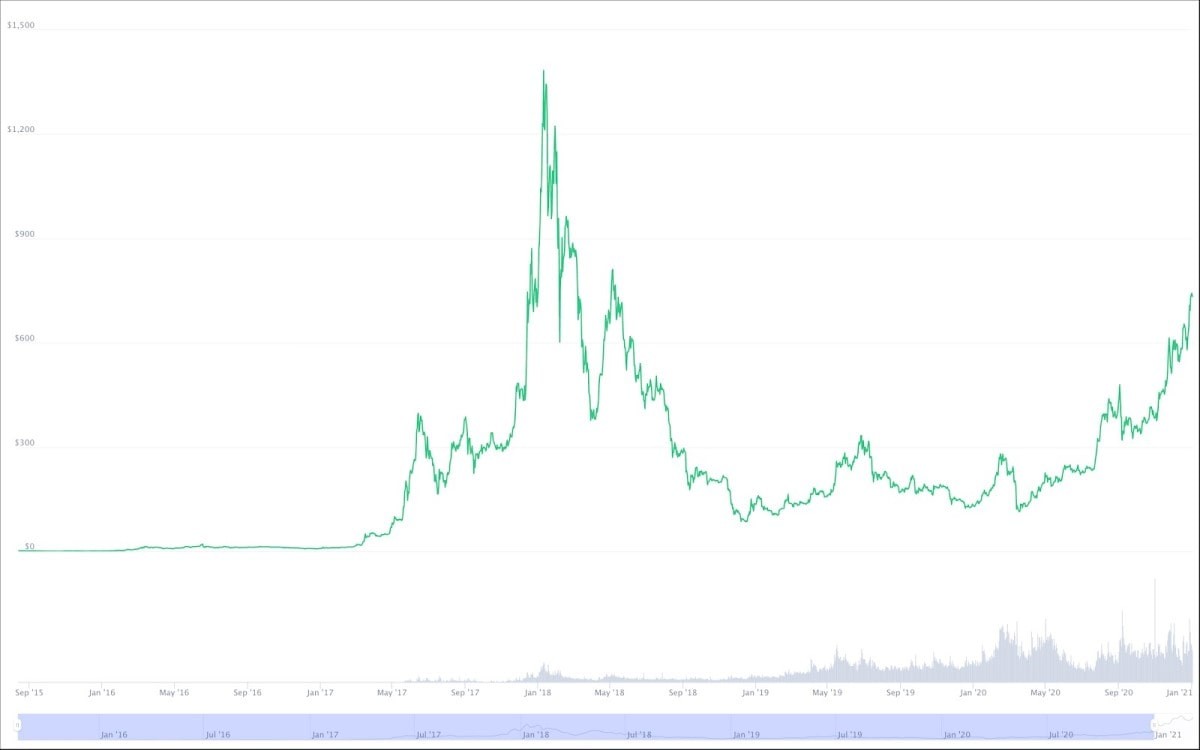
- 2017 ICO Boom. Hundreds of projects raised billions in ETH via smart contract-based ICOs; ETH rose from under $10 (early 2017) to $1,417 (January 2018).
- 14 January 2018. ATH: $1,417.11 — driven by the "flippening" narrative.
- 6 April 2018. Year low: $368.69. ICO bubble burst.
- 18 March 2020. Post-COVID low of $112.94; slow, consistent recovery begins.
Ethereum vs Ethereum Classic: The 2016 Fork Explained
When the community voted to reverse the 2016 DAO hack via hard fork, those who opposed "code is law" principles continued the original chain as Ethereum Classic (ETC). All modern Ethereum upgrades (The Merge, EIP-1559, Layer-2) apply exclusively to ETH. When any analyst or forecast platform says "Ethereum price prediction," they mean ETH, never ETC.
|
Feature |
Ethereum (ETH) |
Ethereum Classic (ETC) |
|
Chain |
Forked in 2016 |
Original chain |
|
Philosophy |
Community welfare; upgradeability |
Code is law; immutability |
|
Key upgrades |
The Merge, EIP-1559, Layer-2 |
Minimal; retains PoW |
|
Ticker |
ETH |
ETC |
How Was Ethereum Doing in 2021 and 2022?
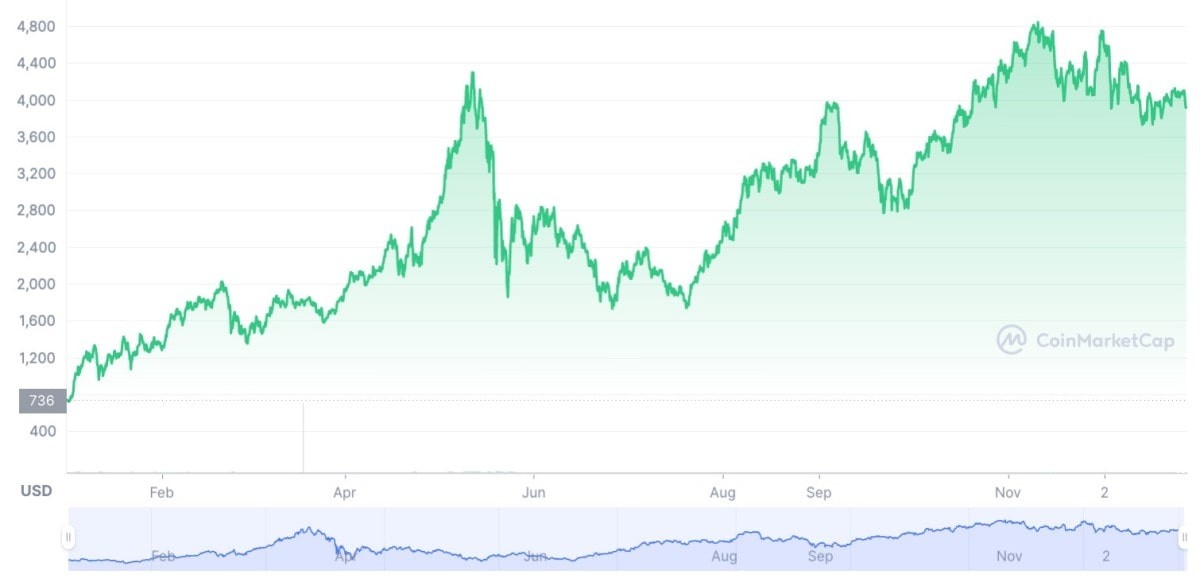
ETH opened 2021 at $738.73, reaching $4,293 (12 May), $4,843 (November), and $4,736 (December). Five drivers:
- ETH 2.0 upgrade progress.
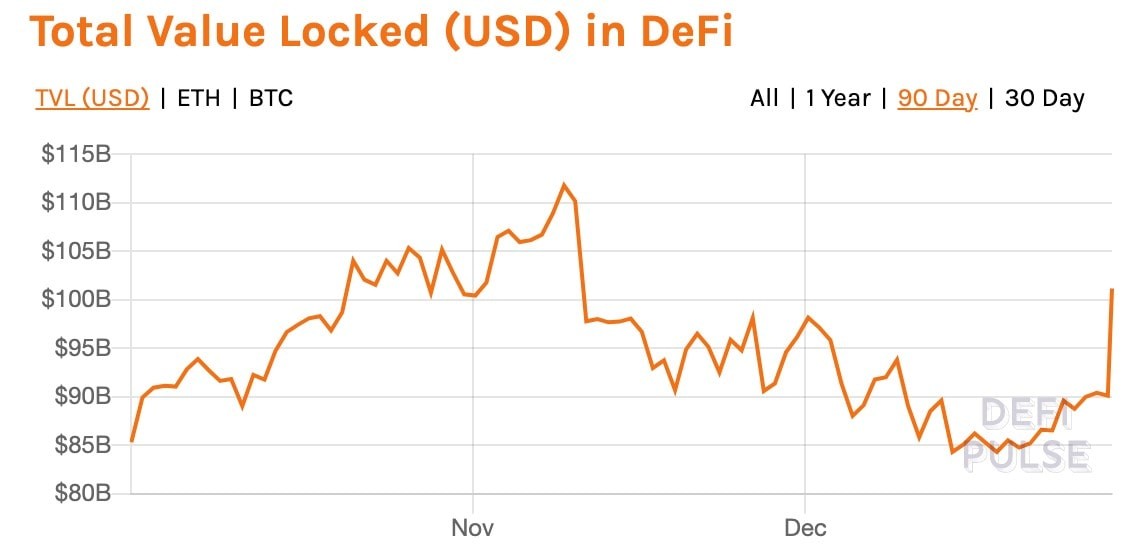
- Rising DeFi adoption; TVL exceeded $100B.
- NFT boom — OpenSea generated billions in ETH volume, driving record gas fees.
- Ethereum as a retail Bitcoin alternative.
- US fiscal stimulus is providing macro tailwinds for risk assets.
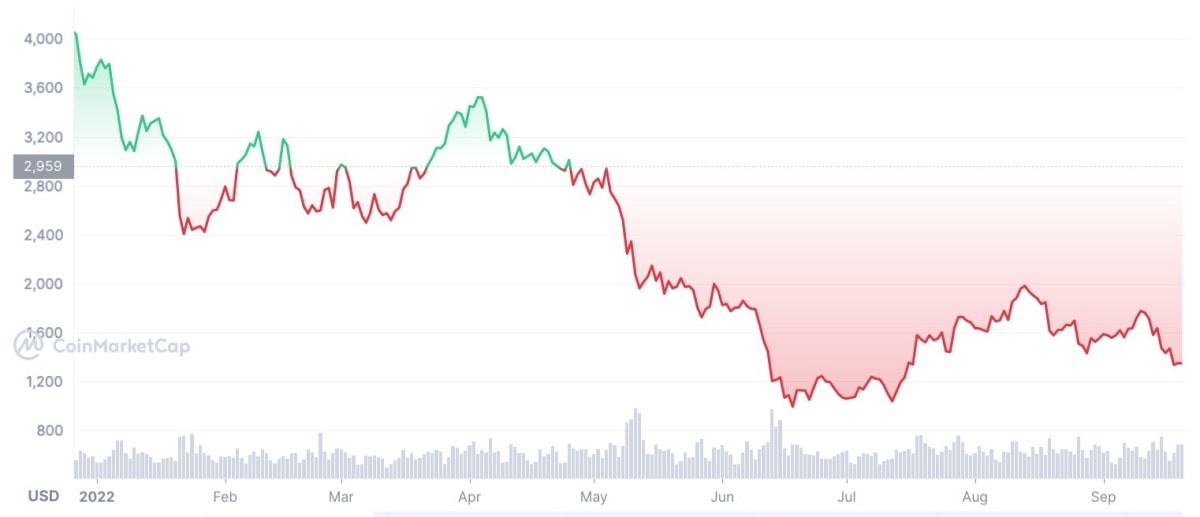
In 2022, Fed rate hikes from 0% to over 4% reversed the picture sharply. By September 2022, ETH's average price was approximately $1,350 — a 70%+ drawdown from its $4,843 peak. Market cap: $165B. Daily volume: $21B+.
Ethereum Price Predictions from Industry Experts
Real Vision / Raoul Pal: Argues ETH offers the best risk-adjusted returns among major crypto assets, citing utility foundation and developer ecosystem.
Goldman Sachs: Highlighted Ethereum as programmable financial infrastructure while noting Bitcoin's evolution as a store-of-value asset.
JP Morgan / Jamie Dimon: Cited elevated borrowing costs and geopolitical instability — including Russia's 2022 Ukraine invasion — as persistent macro risks for risk assets, including ETH.
Pantera Capital / Dan Morehead: Projects ETH could surpass $100,000 over the next decade, driven by DeFi, Web3, and institutional adoption.
ARK Invest / Cathie Wood: Projects Ethereum's market cap reaching or exceeding $20 trillion by 2030 — implying $170,000–$180,000 per ETH and approximately 120x growth from 2022 levels. This is explicitly a bull-case scenario.
Standard Chartered: Set a price target of $35,000 for ETH within their forecast window.
Winklevoss Capital Management: Forecast ETH potentially reaching $40,000, with a near-term target of $5,000–$10,000.
Vitalik Buterin: Acknowledged market cycle volatility without surprise, emphasising that the foundational technical and adoption groundwork for Ethereum's long-term trajectory has been firmly established.
How to Buy Ethereum: A Practical Guide
This section covers the practical steps for readers moving from research to execution — from exchange selection through first purchase and security best practices.
Choosing the Right Cryptocurrency Exchange
Five criteria for selecting a suitable ETH exchange in 2026:
- Regulatory compliance: Choose exchanges registered with FCA (UK), FinCEN/SEC (US), or MiCA-compliant (EU) regulators.
- Security track record: Review history for hacks or withdrawal freezes. Two-factor authentication and cold storage are baseline requirements.
- Fee structure: Compare maker/taker fees, fiat deposit fees, and withdrawal fees — these compound significantly for active traders.
- Interface complexity: First-time buyers benefit from simpler onboarding; experienced traders may prefer advanced order types.
- Fiat on-ramp options: Confirm supported fiat currencies, deposit methods, and regional restrictions.
Centralised vs Decentralised Exchanges for ETH
Centralised exchanges (CEX) provide regulated custodial services — familiar onboarding, customer support, and fiat integration — but require trusting a third party with your ETH. "Not your keys, not your coins" is the core principle. Decentralised exchanges (DEX) such as Uniswap are non-custodial, powered by smart contracts running on Ethereum. For first-time ETH buyers, a regulated CEX is the recommended starting point.
Step-by-step guide — buying ETH for the first time:
- Select a regulated cryptocurrency exchange based on the five criteria above.
- Create an account and complete identity verification (KYC).
- Deposit fiat currency via bank transfer or card.
- Place a market or limit order for ETH/USD.
- Confirm purchase; ETH appears in your exchange wallet.
- For long-term holdings, transfer ETH to a hardware wallet (Ledger, Trezor) for self-custody.
- Record your seed phrase offline in a secure physical location — it is the only wallet recovery mechanism.
Trading ETH CFDs with Libertex
A Contract for Difference (CFD) allows speculation on ETH price movement — upward or downward — without owning ETH. CFDs use leverage to amplify both gains and losses. 84% of retail investor accounts lose money when trading CFDs with Libertex. Key risk management principles: never risk more than 1–2% of total capital per trade; set stop-loss orders before entering; treat ETH as part of a diversified portfolio, not a sole holding.
|
Feature |
Spot Purchase (Exchange) |
CFD Trading (Libertex) |
|
Asset ownership |
Yes — you hold ETH |
No — price exposure only |
|
Staking yield |
Yes (~3–5% p.a.) |
No |
|
Short selling |
No |
Yes |
|
Leverage |
No |
Yes (amplifies risk) |
|
Best for |
Long-term investors |
Active traders with a risk management framework |
|
Risk disclosure |
High — full price exposure |
Very high — 84% of retail accounts lose money |
Frequently Asked Questions
Who are the founders of Ethereum?
Ethereum was co-founded by five primary contributors: Vitalik Buterin (lead architect), Gavin Wood (developed the Ethereum Yellow Paper and co-created Solidity), Joseph Lubin (founded ConsenSys, the primary Ethereum infrastructure firm), Charles Hoskinson (later founded Cardano), and Anthony Di Iorio (early backer and co-founder). The project was proposed in 2013 and launched on 30 July 2015.
Where can I trade Ethereum?
Ethereum can be traded on regulated centralised exchanges — select platforms based on regulatory compliance (FCA, FinCEN, MiCA), security track record, fee structure, interface complexity, and fiat on-ramp availability for your jurisdiction. Decentralised exchanges such as Uniswap offer non-custodial on-chain trading. Traders seeking leveraged or short exposure can access ETH CFDs via regulated brokers such as Libertex, noting that 84% of retail CFD accounts lose money.
What is Proof of Stake, and why does it matter for Ethereum?
Proof of Stake (PoS) replaced Proof of Work mining on Ethereum in September 2022 via The Merge, reducing ETH issuance by approximately 90% and energy consumption by over 99%. Under PoS, validators stake 32 ETH as collateral to propose and validate blocks, earning approximately 3–5% annualised staking yield. The resulting combination of reduced issuance and increased staking demand creates structural supply contraction — a fundamental long-term bullish dynamic for the ETH price.
Disclaimer: The information in this article is not intended to be and does not constitute investment advice or any other form of advice or recommendation of any sort offered or endorsed by Libertex. Past performance does not guarantee future results.
Why trade with Libertex?
- Get access to a free demo account free of charge.
- Enjoy technical support from an operator 5 days a week, from 9 a.m. to 9 p.m. (Central European Standard Time).
- Use a multiplier of up to 1:30 (for retail clients).
- Operate on a platform for any device: Libertex and MetaTrader.