
Forex Trading Patterns: Different Shapes, Common Signals
Prepared by the Libertex team
Content reviewed internally in accordance with regulatory standards.
What do traders use to predict the price direction? Technical indicators, candlesticks and, of course, chart patterns.
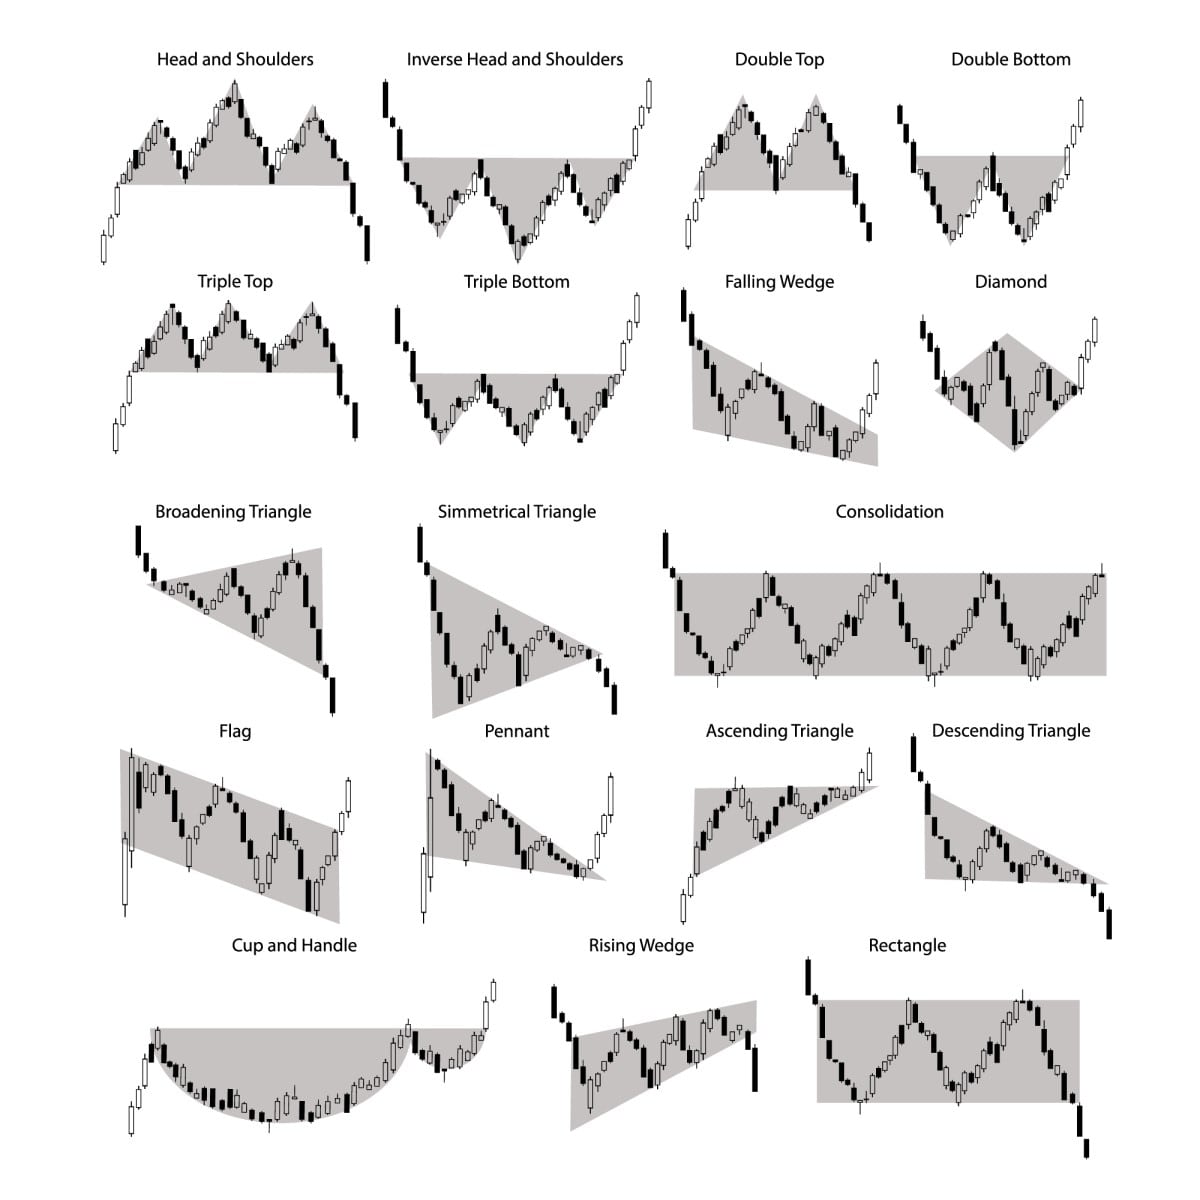
Overall, there are many trading patterns that occur on the price chart daily. That's why they were divided into three groups. What are these groups? How do you remember all these patterns? Read our guide to get comprehensive knowledge about chart patterns.
Forex Trading Chart Patterns: Meaning
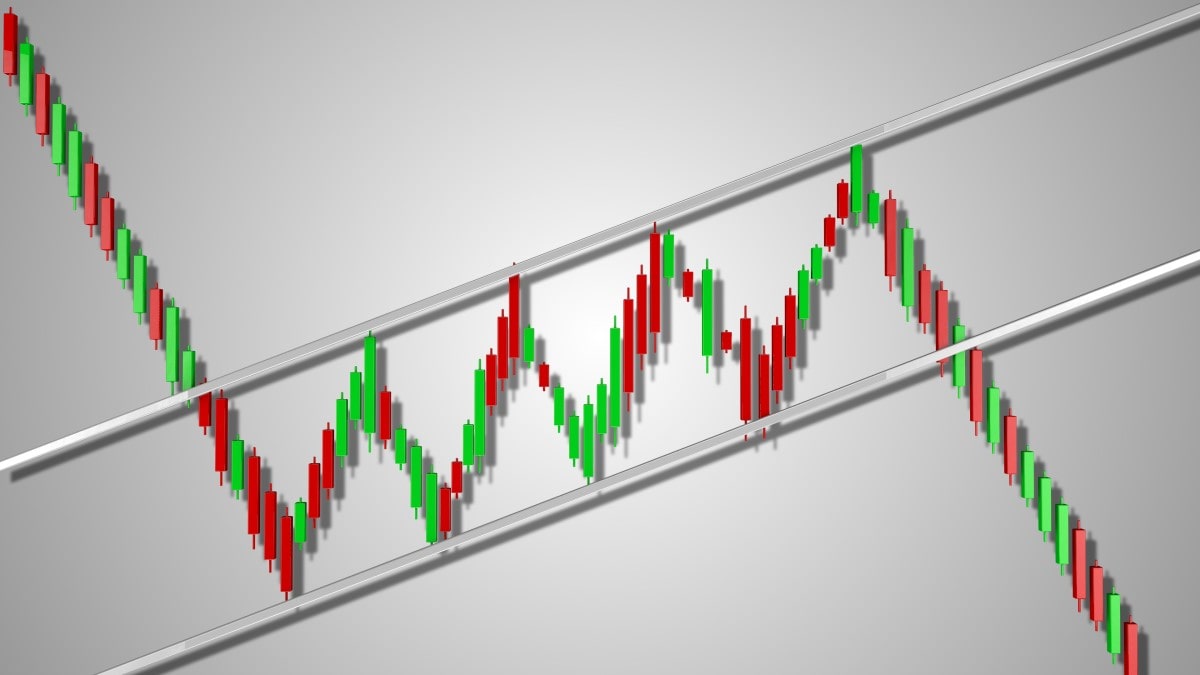
A chart pattern is a combination of support and resistance levels formed by candlesticks in a specific shape that helps to define whether the market will move in the same direction or turn around. There are three types of technical analysis patterns: reversal, continuation and bilateral.
A chart pattern is a combination of support and resistance levels formed by candlesticks in a specific shape.
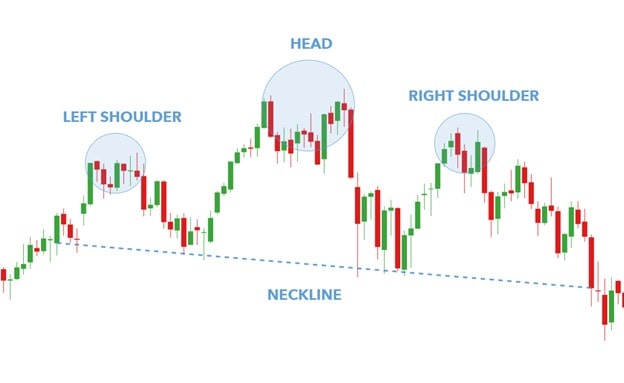
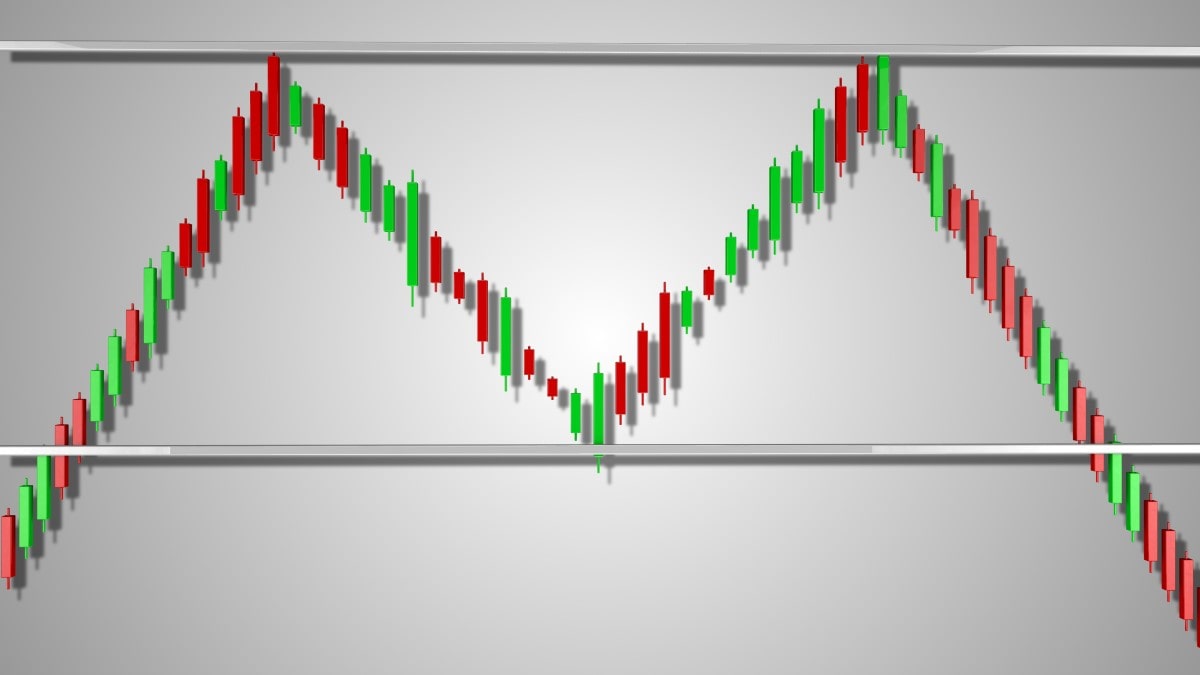
Look at the picture below. Here's one of the most famous trade patterns: head and shoulders. As you can see, candlesticks are placed so that the pattern resembles a head and shoulders. Based on the candlesticks' location, we can define the support level. Later, we'll explain how to read this pattern's signal.
Trading Chart Patterns: Types
There are two major types of chart patterns: reversal and continuation. However, there is a third one that combines both types called bilateral patterns. Let's learn how to identify all types on the price chart and what patterns each type contains.
There are two major types of chart patterns: reversal and continuation. However, there is a third one that combines both types called bilateral patterns.
Reversal Chart Patterns
The name of the type explains the idea of the reversal patterns. These patterns predict the trend will turn in the opposite direction after their formation. If the price declines, a reversal chart pattern says the market will go up soon. Conversely, if the market rises, a reversal pattern sends you an alert that you should close a long trade and be ready for the market to decline soon.
Reversal chart patterns predict the trend will turn in the opposite direction soon.
Let's list the most effective and famous reversal chart patterns:
- Head and Shoulders and Inverse Head and Shoulders
- Double Top and Double Bottom
- Triple Top and Triple Bottom
Although chart patterns look different, we can highlight a key rule for reading their signals. To define a take-profit level, measure the distance between the support and resistance levels at the point where the pattern starts forming. This will be the distance between the entry point and the take-profit level. The entry point is the place where the price breaks either the support or resistance level, depending on the trend.
As for the stop-loss level, the idea is to measure the distance between the support and resistance levels and divide it by two. The concept suits the best risk/reward ratio of 1:2. However, we would advise you to evaluate the market conditions and use a trailing stop-loss if the situation is uncertain.
Continuation Chart Patterns
Continuation chart patterns appear when the current trend pauses. That's why they're sometimes called consolidation patterns. Trendlines serve as support and resistance levels. They occur on the chart when buyers and sellers can't beat each other, and the price consolidates for a while. Such patterns show the market will keep moving in the same direction.
Continuation chart patterns appear when the current trend pauses but keeps moving in the same direction later.
Here's a list of the most famous continuation chart patterns:
- Pennants or flags
- Rectangles
- Wedges: rising and falling
- Triangles: ascending, descending and symmetrical
For most of these patterns, the trading idea is similar. You should draw support and resistance lines and measure the distance between them at the point where the pattern starts forming. This is the size of the area between the entry point and the take-profit level.
The same rules apply as with reversal patterns: the entry point occurs when the price breaks either the support or resistance level for the prevailing trend.
The stop-loss level differs. To define the size of the risk you're prepared to take, place the stop-loss above the resistance level for bearish patterns and below the support level for bullish patterns.
Bilateral Chart Patterns
A bilateral chart pattern is a pattern that doesn't predict a certain market direction. It sounds strange because the idea of the pattern is to predict the price direction. Still, the pattern will show you where the market will move. However, it won't happen during the formation of the pattern but after either the support or resistance level is broken.
Bilateral chart patterns don't predict a certain market direction.
Ascending, descending and symmetrical triangles are bilateral patterns. Although ascending and descending triangles usually signal a continuation of the trend, there's an odd price that will move in the opposite direction. Thus, you should always evaluate market conditions (for instance, whether the market is volatile) before opening a trade.
The Most Efficient Chart Patterns
We mentioned chart patterns above, but we can't just throw them at you without explaining how they look and work.
Head and Shoulders
A head-and-shoulders pattern is one of the easiest and most common patterns known even to newbies.
It's a reversal bearish chart pattern that forms at the end of the uptrend. Why is it head and shoulders? Because the pattern has three tops: the second is higher than the first one, but the third peak is lower than the second one. Thus, we have the highest peak, called the head, and two lower peaks, which are called shoulders. The perfect pattern has two shoulders that are similar in height and width.
As we said above, the third top is lower than the second one, which signals a weakening of the current trend.
Also, the pattern has a neckline. That's the line drawn through the lowest points of the two troughs that serves as a support level. The neckline can be drawn horizontally or moving down/up. The signal is stronger if the neckline declines.
The pattern works when the price breaks below the neckline (support level) after the formation of the second shoulder. You can open a short position at the breakout. A take-profit order can be placed at a distance equal to the distance between the top of the head and the neckline.
Remember the stop-loss point. You can always apply a 1:2 risk/reward ratio. So, a stop-loss order will be half of the take-profit distance and placed above the breakout point.
Hint: We should warn you that the price can return to the neckline after the breakout point. So, the neckline will turn into resistance.
Inverse Head and Shoulders
An inverse head and shoulders or head and shoulders bottom is a reversal bullish chart pattern.
The inverse head and shoulders pattern mirrors the standard one. It consists of three lows, with the head as the lowest bottom, while the shoulders are almost the same size.
The pattern begins when the price forms two lower lows that signal a downtrend. However, the third low is higher, which means bears lose their strength, and there are odds of an uptrend occurring.
The reversal is confirmed when the price breaks above the neckline. Take-profit and stop-loss orders are defined as in the standard head and shoulders pattern.
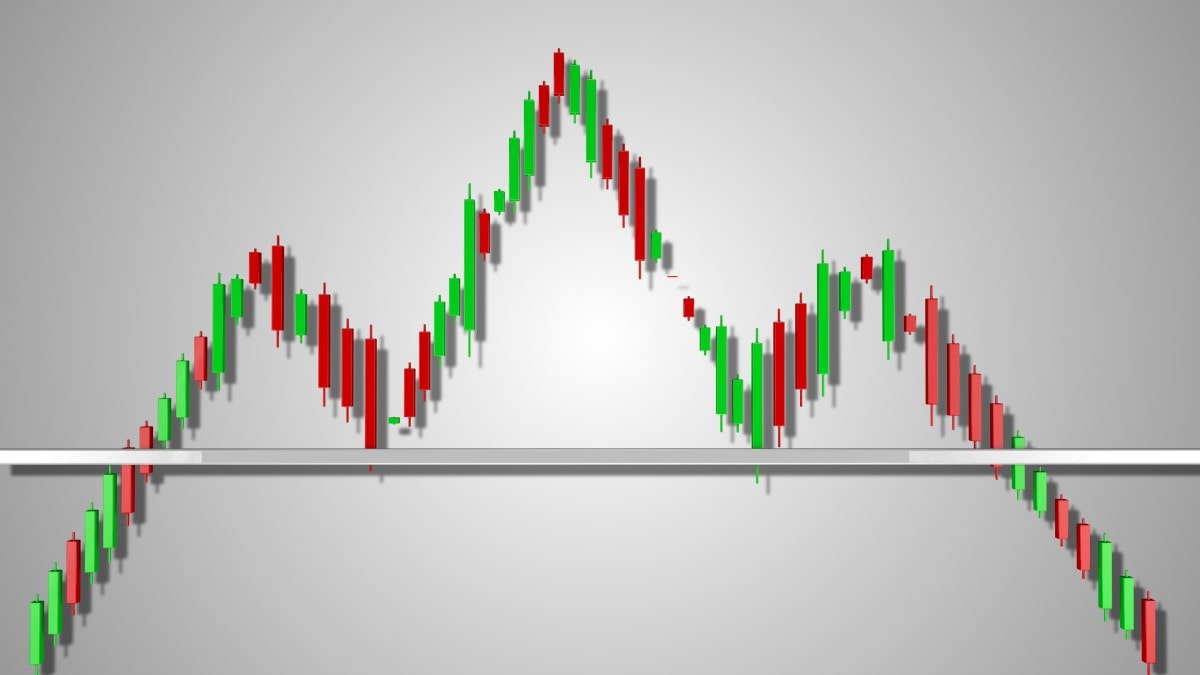
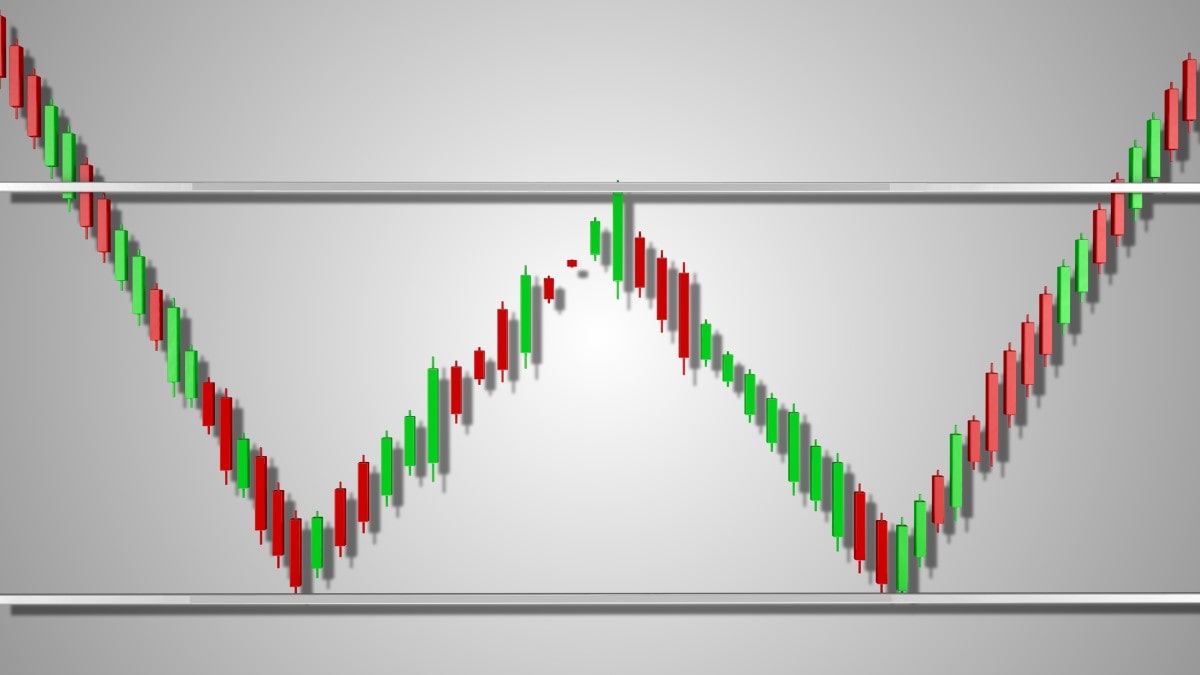
Double Top
A double top is a bearish reversal pattern that occurs at the end of upward movement. This pattern is as famous as the head and shoulders one because it's easy and frequent.
The name of the pattern explains its idea. If you find two consecutive tops of similar or nearly similar height with a moderate trough between them, it's a double top pattern. The neckline should go through the lowest point of the trough.
The pattern works when the price falls below the neckline after the second top is formed. A trader can open a sell trade after the breakout point.
To measure the take-profit level, measure the distance between the tops and the neckline and put it down from the neckline.
The stop-loss level can be measured according to the risk/reward ratio. Divide the take-profit distance by two and place this number of pips up from the neckline.
After the breakout, the neckline becomes a resistance. Like in the head and shoulders pattern, the price can turn back and test the neckline again.
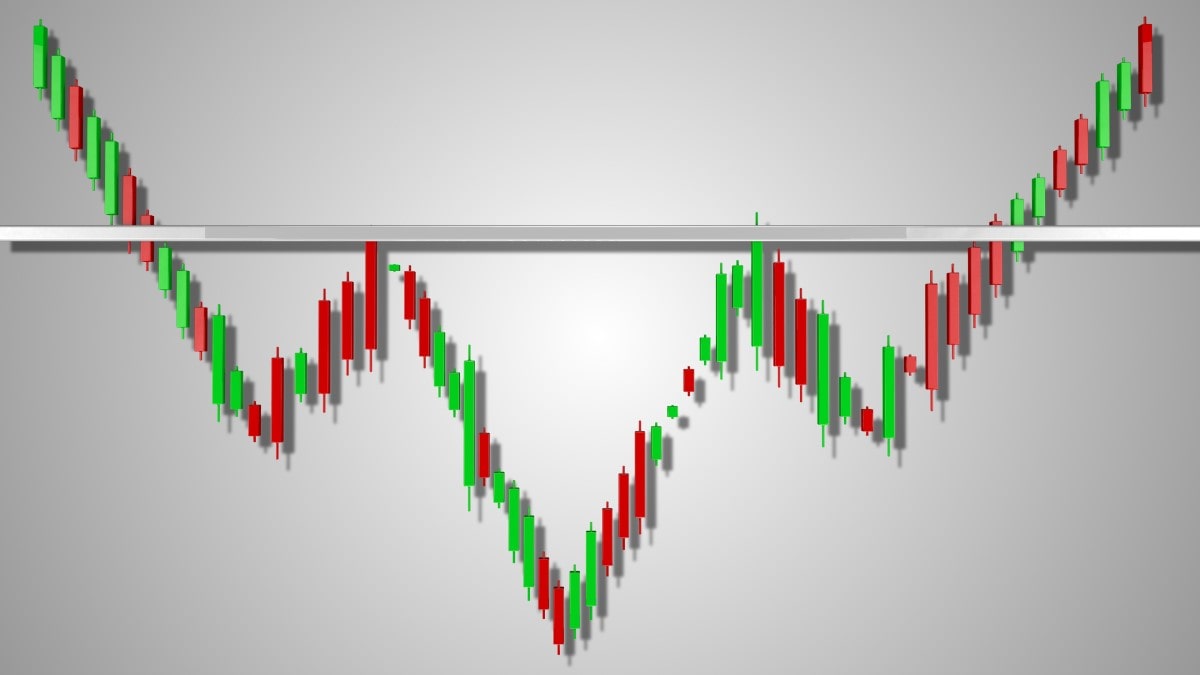
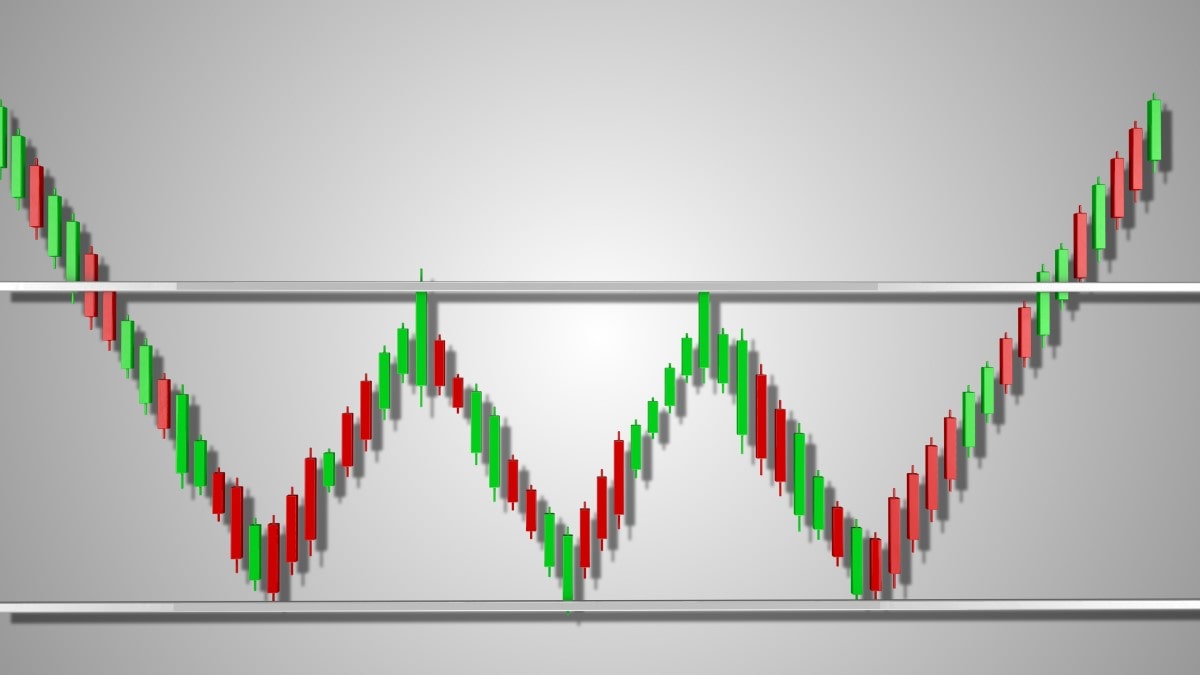
Double Bottom
As you might have guessed, the double bottom is a mirror pattern of the double top. It's also a reversal pattern, but it occurs at the end of the downtrend.
The double bottom consists of two consecutive bottoms which have similar or nearly similar length. Also, there's a high between them. The neckline is drawn through the highest point of the trough.
The pattern works if the price breaks above the neckline after the formation of the second bottom. The take-profit and stop-loss levels are measured the same way as in the double top pattern.
The price can retest the neckline after the breakout. However, it's anticipated to rise after the pattern's formation.
Triple Top and Bottom
These patterns are rarer, but we should tell you about them so you know they can appear on the price chart.
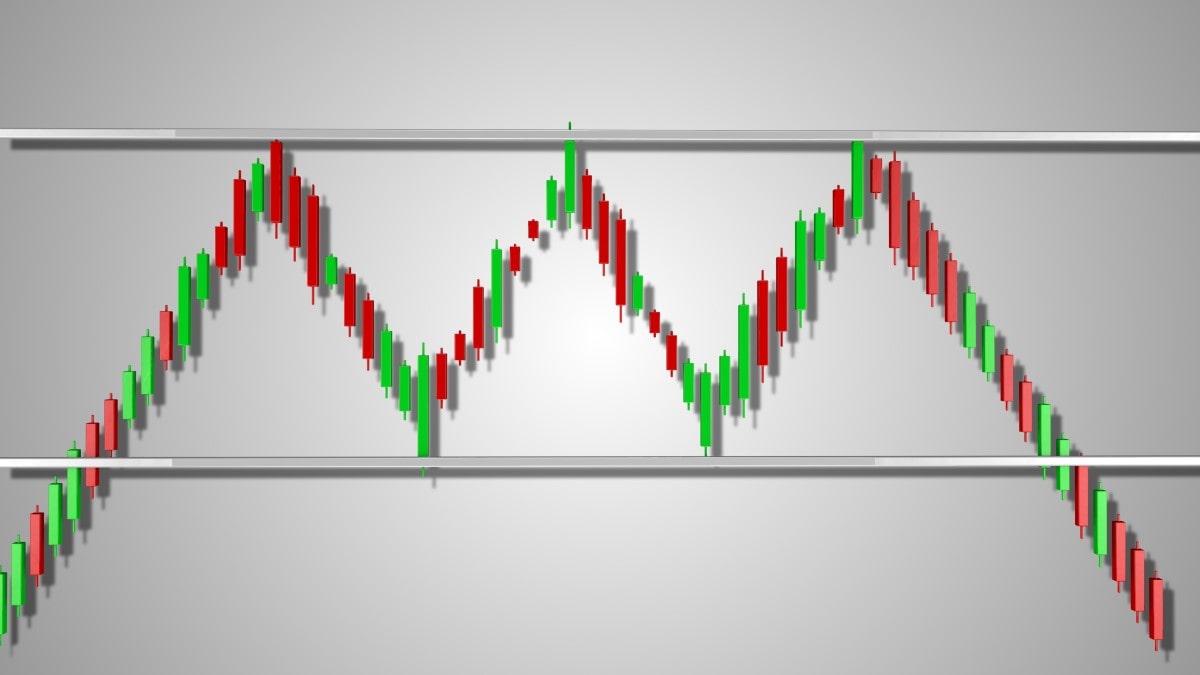
The patterns resemble double top/bottom patterns and work similarly. The only difference is that triple bottom/top come into play after a third peak/low is formed.
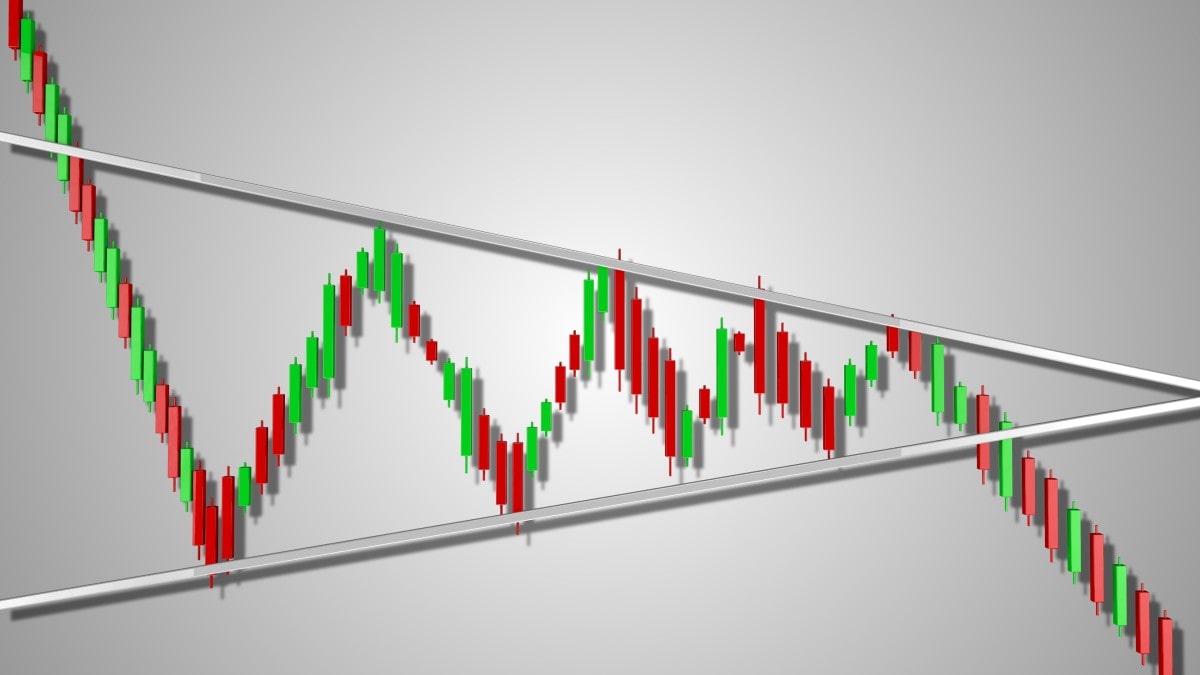
Symmetrical Triangle
There are three variations of triangle patterns, all of which are easily recognisable. To define a triangle pattern on the price chart, you should draw the support and resistance levels. The idea of triangle trading is to open a trade when a breakout occurs. It's risky to trade within the triangle.
Triangles are traded when a breakout occurs. It's risky to trade within the triangle.
A take-profit order for any type of triangle can be defined by measuring the distance of the widest part of the pattern. This distance should be measured from the entry point. To define a stop-loss order, use a 1:2 risk/reward ratio.
The symmetrical triangle is neither bullish nor bearish. The signal depends on the direction of the breakout.
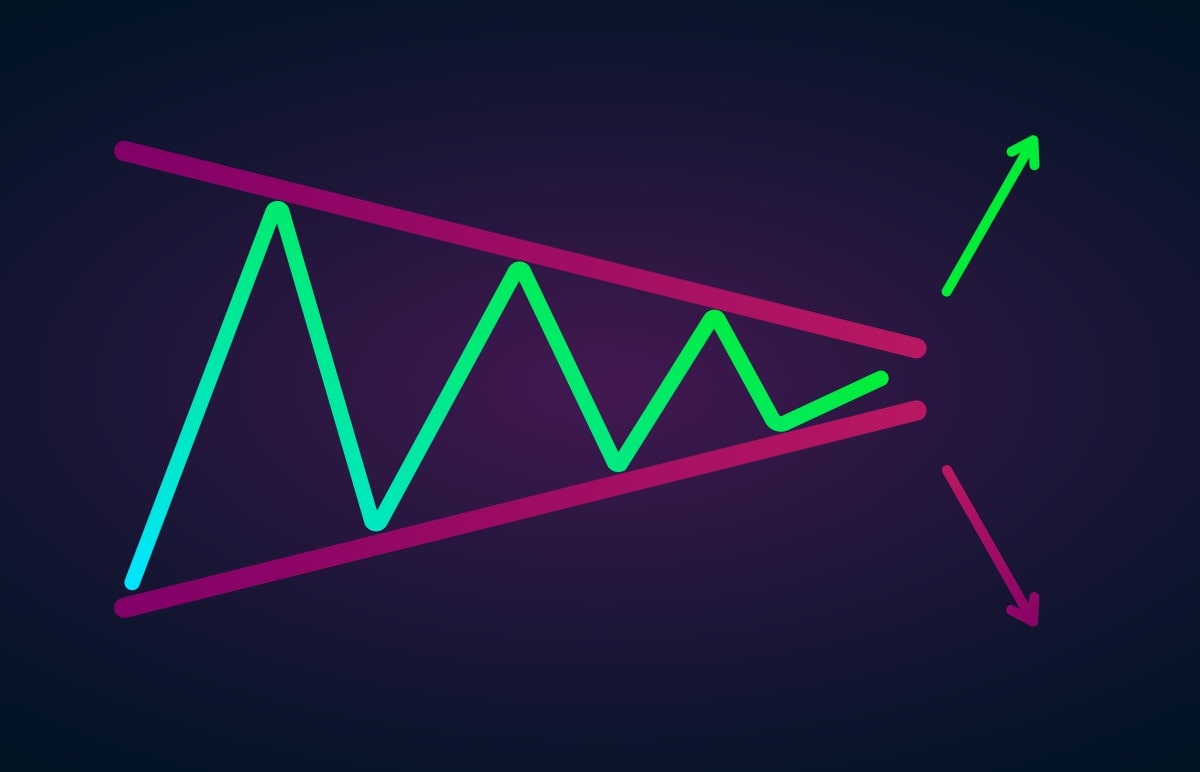
The support and resistance levels move towards one point. The support goes up, and the resistance slopes down, so they meet at one point and form one angle.
You can use two different approaches to trading a symmetrical triangle. You can wait until the price breaks either a support or a resistance level and open a trade after the breakout. Or, another way is to place a One-Cancels-the-Other Order. So, when one order works, the other will be cancelled automatically.
Descending Triangle
A descending triangle is considered a continuation pattern that signals that the downtrend will continue. Still, it's tricky and can be called a bilateral pattern as the price may turn in the opposite direction to the prevailing trend.
In common concept, the descending triangle shows that bears are strong enough to pull the price further down.
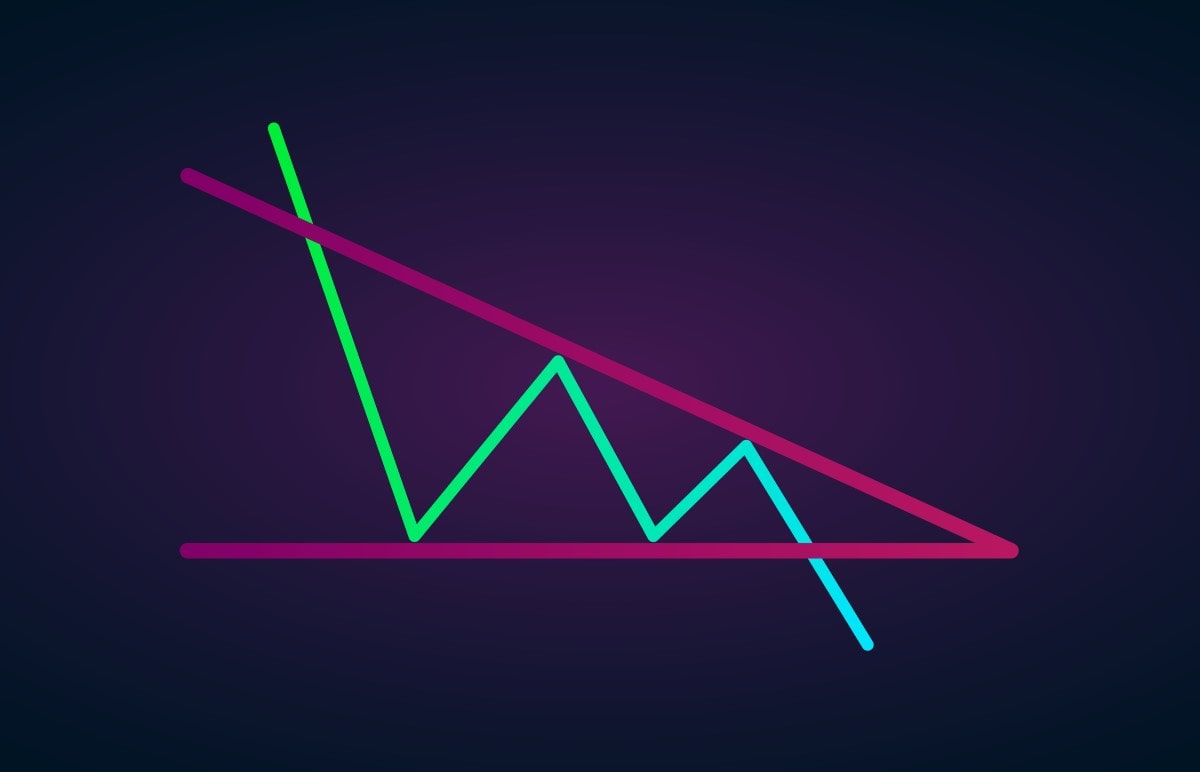
In a descending triangle, the resistance line slopes down, while the support is almost horizontal. The price is expected to break the support level and keep falling. So, as soon as the breakout occurs, you can open a short position.
We don't recommend opening a trade before the breakout as the price could break the resistance, and the trend could change.
Ascending Triangle
An ascending triangle is also a bilateral chart pattern. Still, the main idea of the ascending triangle is a trend continuation. The pattern depicts the strength of bulls, so they are ready to push the price further up.
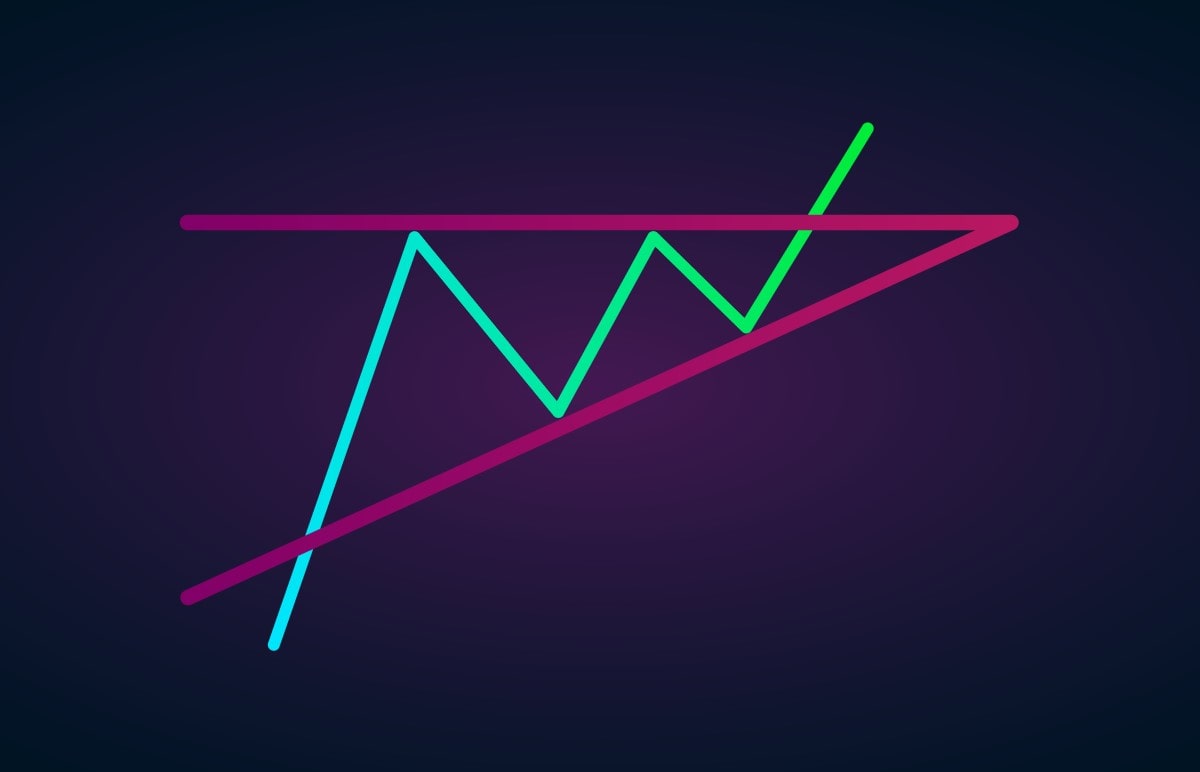
Opposite to the descending triangle, the resistance of the ascending triangle is relatively flat, while the support level slopes up. Although the price can break both the support and resistance levels, the more common case is that the upward trend continues, so the price breaks above the resistance.
You should wait for the breakout to occur before opening a trade since any bilateral pattern includes risks.
Pennants
A pennant is a continuation chart pattern that occurs after a strong move. The pennant reflects a pause in the strong market direction no matter if it's an uptrend or downtrend. There are two types of pennants: bearish and bullish.
As the market moves in the same direction, forming an almost vertical trend, it needs to pause. This short-term pause when the price consolidates is called a pennant.
Traders enter the market on the breakout in the trend's direction. The take-profit level can equal the distance of the move ahead of the pennant formation. A stop-loss order should be placed above/below the beginning of the pattern.
Pennants and triangles look similar. Still, the pennant is a short-term pattern that happens when the market moves strongly up or down. The triangle is a medium- or long-term pattern that occurs independently of the previous trend.
You may be confused because pennants and triangles look similar. The difference is in their timeframes. A pennant is a short-term pattern that happens when the market moves strongly up or down. A triangle is a medium- or long-term pattern that occurs independently of the previous trend.
Flags
Flags are considered more reliable than triangles or wedges because they're less frequent. There are two types of flag patterns: bull and bear. Although the price may break in any direction, in most cases, the flags are continuation patterns.

The flag pattern resembles a flag and looks like a small channel after a strong movement. The flag moves in the opposite direction to the prior trend. After an upward movement, it slopes down. After a downward movement, it has an upward slope.
Traders should enter the market after the breakout. A take-profit order should equal the size of the flagpole (the distance of the movement before the flag's formation). A stop-loss can be placed above/below the beginning of the flag.
Wedges
A wedge is a chart pattern that predicts a trend continuation. There are two types of wedge patterns: rising and falling.
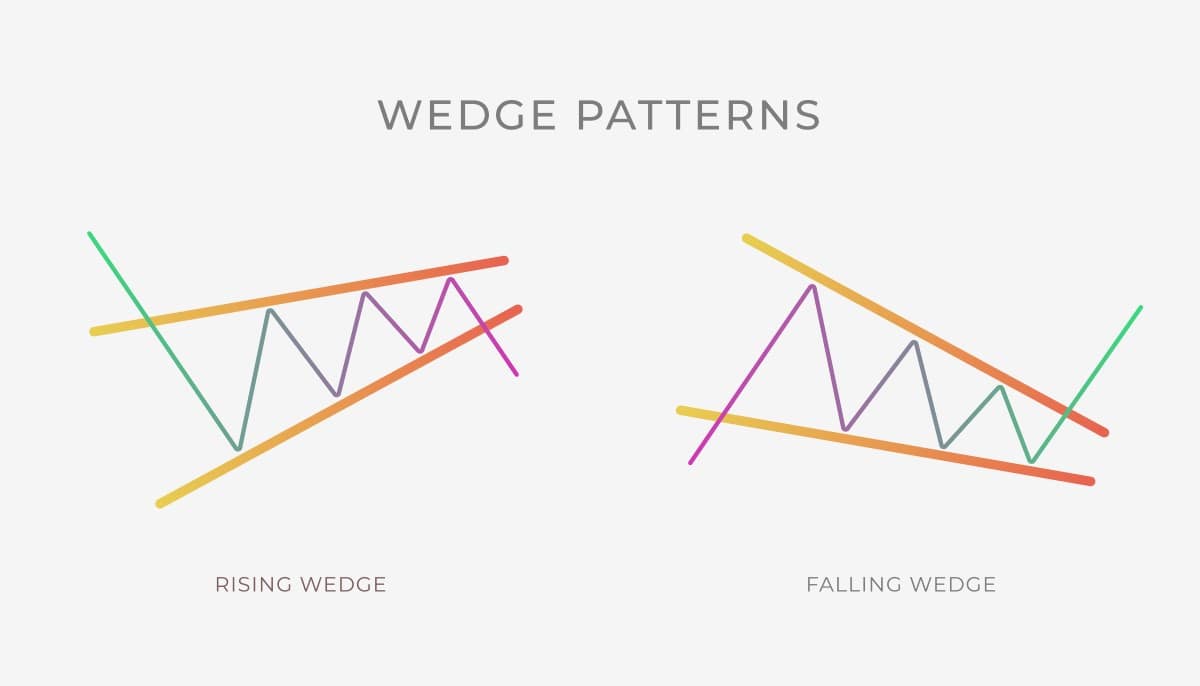
The pattern's support and resistance levels move in one direction, so the channel narrows until the price breaks any of the levels. During an ascending (rising) wedge, the support and resistance lines move up. However, the rising wedge is a bearish pattern that signals the price will keep moving down. In a descending (falling) wedge, the support and resistance levels decline.
When the price breaks below the support level, a trader can enter the market. To measure the take-profit level, calculate the distance of the widest area of the pattern. A stop-loss order can be placed above the resistance in the rising wedge and below the support in the falling wedge.
Rectangles
A rectangle is a continuation chart pattern that occurs due to a pause in the trend. There are bearish and bullish rectangles. The pattern consists of flat support and resistance lines that the price tests several times before breaking out.
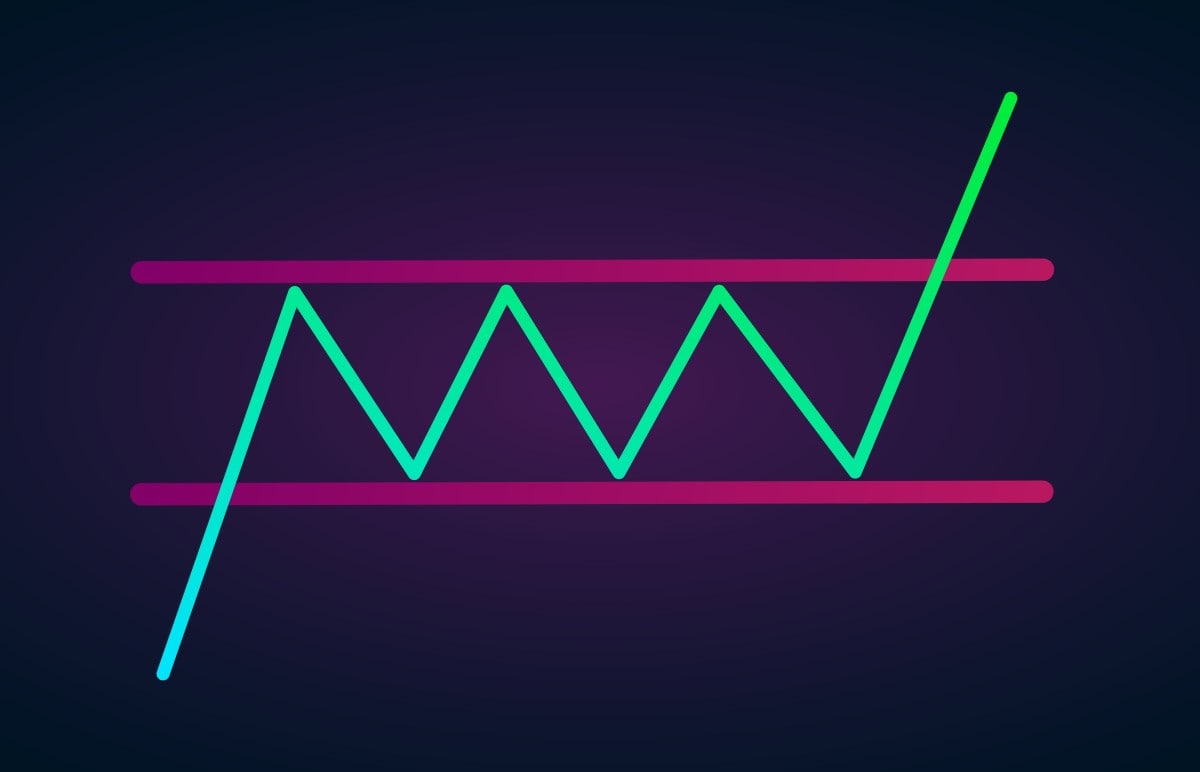
The rectangle's signal depends on the trend. If the rectangle happens during an uptrend, it signals that the price will keep rising. If the rectangle occurs during a downtrend, the odds are that the market will fall.
To enter the market, wait for the price to break either the support or the resistance. The take-profit should equal the distance between the support and resistance lines. A stop-loss order can be placed above the resistance in a downtrend and below the support in an uptrend.
Reading Forex Chart Patterns
Follow these steps to read forex chart patterns:
- Step 1. Try to define the shape of any of the top patterns we mentioned above.
- Step 2. Define whether it's a continuation, reversal or bilateral chart pattern.
- Step 3. Draw support and resistance levels.
- Step 4. Wait for the price to break the support/resistance to enter the market. Don't open trade before the breakout because it could be a fake breakout. That's why you should get confirmation from other technical tools.
- Step 5. Define your take-profit and stop-loss levels in advance to avoid losses.
Tips for Traders: Everything About Chart Patterns
We've prepared a few simple rules that will make your trading more effective:
- There's no perfect chart pattern that will provide 100% accurate signals and can be applied to any market condition. Some patterns occur during high volatility, while others are workable for calm markets. Also, you should remember that the chart's timeframe affects the strength of chart patterns. That's why any chart pattern needs confirmation of the signals, which you can get by applying technical indicators.
- Chart patterns are divided into several groups: reversal, continuation and bilateral. All you need to do is learn the signals of the top chart patterns and apply them when you encounter the pattern on the chart.
- The support and resistance concept is key to any pattern's signal. All you need to do is to draw these levels, and you'll catch the signal.
- Chart patterns provide perfect entry, stop-loss and take-profit levels.
- Although chart patterns have different shapes, each type has common rules for how to read signals.
Conclusion
"Why do traders use chart patterns? Isn't it complicated to remember all the shapes and signals they provide?" If you still think this, you should do more practice looking for chart patterns in the real market.
However, we don't recommend training in a real account since an incorrect read on chart patterns can lead to losses. Use a Libertex demo account, which allows you to practise in real-market conditions on a wide range of trading instruments, on CFDs.
To round up, see our answers to the most frequently asked questions below.
FAQ
Do Forex Patterns Work?
Forex chart patterns definitely work. If they didn't, traders all over the world wouldn't use them. Still, you should remember that there's no perfect chart pattern, and each signal should be confirmed by other measures.
Where Can I Find Patterns in Forex?
You can find chart patterns on any timeframe and for any trading instrument.
How Do You Trade Chart Patterns?
Chart patterns are useful trading tools because they provide entry, take-profit and stop-loss levels. All you need to do is to draw the support and resistance lines that will tell you where to place all these three levels.
How Do I Read Forex Charts?
A forex chart consists of chart and candlestick patterns. To read a chart and find trading signals, you need to have comprehensive knowledge of patterns.
How Do You Learn Chart Patterns?
Fortunately, all types of chart patterns have common rules for reading their signals. Learn the main concept and practise in a Libertex demo account to strengthen your knowledge.
What Is the Most Bullish Chart Pattern?
There's no such thing as a pattern that's the 'most bullish' or 'most bearish'. Such factors as market volatility, timeframe and market conditions affect the strength of the chart pattern.
Disclaimer: The information in this article is not intended to be and does not constitute investment advice or any other form of advice or recommendation of any sort offered or endorsed by Libertex. Past performance does not guarantee future results.
Why trade with Libertex?
- Get access to a free demo account free of charge.
- Enjoy technical support from an operator 5 days a week, from 9 a.m. to 9 p.m. (Central European Standard Time).
- Use a multiplier of up to 1:30 (for retail clients).
- Operate on a platform for any device: Libertex and MetaTrader.