Elliott Waves: Surf the Market
Prepared by the Libertex team
Content reviewed internally in accordance with regulatory standards.
The Elliott Waves' approach is one of the most popular among traders and investors all over the world. However, it's not easy. Ralph Nelson Elliott invented plenty of wave patterns that need to be drawn correctly. In this tutorial, we'll help you create a simple system to use while trading.
Elliott Wave Theory: A Piece of History
Although the Elliott Wave principle was created in the 1930s, it continues to gain popularity. The economist Ralph Nelson Elliott developed this theory in retirement. His approach became famous when he managed to foresee a plunge in the stock market.
Elliott based his approach on traders' behaviour. He believed that traders and investors repeat the same actions. Thus, market tops and bottoms can be easily predicted.
Elliott Wave Theory is based on traders' behaviour. The developer, Mr Elliott, believed traders and investors repeat the same actions.
Lots of Elliott Wave traders and analysts have used this theory since Mr Elliott passed away. Plenty of books and articles have been published to describe the principles of the Elliott Waves strategy. There is even a school of traders called Elliotticians.
We'll summarise and provide you with the most relevant information to help you 'ride a wave'.
What Is an Elliott Wave?
Elliott Wave Theory is an instrument of technical analysis, which reflects traders' psychology. This method differs from standard technical indicators, such as the RSI, MACD, etc. It's a theory that doesn't include calculations. As we mentioned above, Elliott Wave analysis assumes that market movements repeat. And waves just help a trader predict the future price direction based on the historical trends.
When you determine the waves on the chart based on the previous price, you'll be able to identify the future price direction.
There are plenty of types of Elliott Waves. Still, the idea is the same: when you determine the waves on the chart based on the previous price, you'll be able to define the further price direction.
Look at an example below.
Motive Waves
There are two essential terms: motive and corrective waves. Both include unique Elliott Wave patterns. A motive wave reflects the price movement in the direction of the significant trend. Each motive wave consists of five small waves built according to different rules. Look at the motive patterns below.
Basic terms of the Elliott Wave strategy are corrective and motive waves.
Impulse
Like any other pattern, it consists of five waves. Three of them are motive waves, so they move in the direction of the prevailing trend; the other two are corrective waves, which move in the opposite direction of the primary trend.
Each of the patterns has specific rules. Look at the rules of the impulse wave:
- An impulse wave consists of five waves.
- Wave 2 never outperforms the point where Wave 1 starts.
- Wave 3 always crosses the high of Wave 1.
- Wave 4 never exceeds the endpoint of Wave 1.
- Wave 3 is never the shortest of the waves.
- Wave 3 is an impulse wave.
- Wave 1 can be either a motive or leading diagonal pattern.
- Wave 5 can be a motive or an ending diagonal pattern.
- Wave 2 shouldn't be a triangle or a triple three structure.
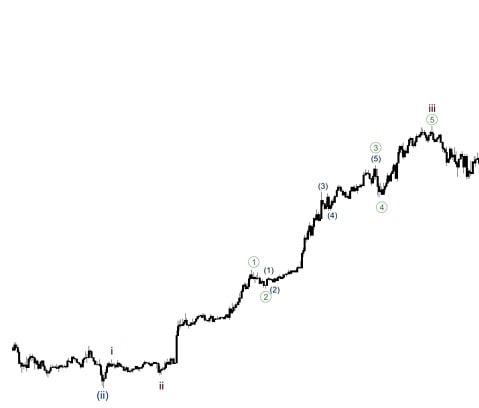
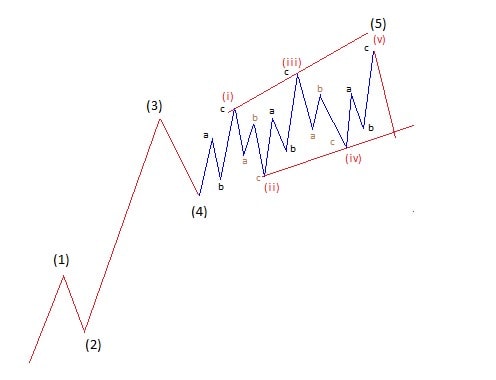
An impulse wave signals a correction or even a trend reversal. We can find many impulse waves within one trend. Look at the example below. Green waves 1-2-3-4-5 are an impulse pattern. Blue waves 1-2-3-4-5 are also an impulse pattern.
The Leading Diagonal Pattern
This pattern is considered the beginning (Wave 1) of an impulse or a zigzag.
Check the rules below:
- A leading diagonal has five waves inside.
- Wave 2 never exceeds the beginning of Wave 1.
- Wave 3 always crosses the end of Wave 1.
- Wave 4 usually outperforms the endpoint of Wave 1.
- Wave 5 usually passes the ending point of Wave 3.
- Wave 3 shouldn't be the shortest one.
- Wave 2 shouldn't be a triangle or a triple three structure.
- Waves 1, 3 and 5 can be impulses or zigzags.
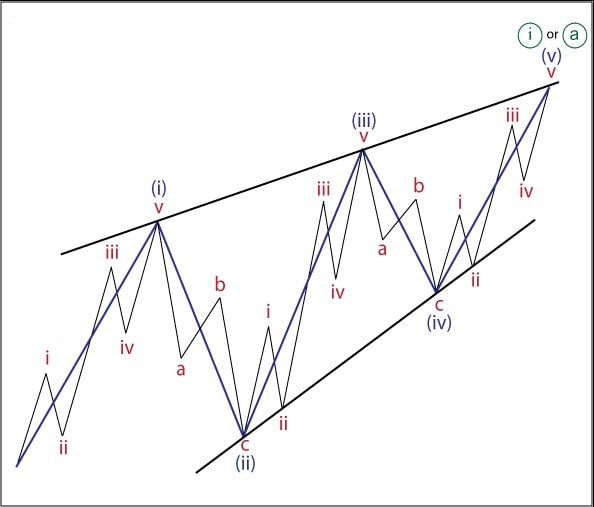
The Ending Diagonal Pattern
As the leading diagonal is the beginning of an impulse or a zigzag, the ending diagonal pattern is the end of them. The pattern includes different correction formations, such as zigzag.
- This pattern includes five waves.
- Wave 2 never outperforms the starting point of Wave 1.
- Wave 3 always crosses the end of Wave 1.
- Wave 4 usually exceeds the endpoint of Wave 1.
- Wave 5 usually breaks the end of Wave 3.
- Wave 3 shouldn't be the shortest.
- Wave 2 shouldn't be a triangle or a triple three structure.
- Waves 1, 3 and 5 look like zigzags.
Corrective Waves
Corrective waves follow motive waves and are more complicated. A corrective wave is a step backwards in a trend. Corrective waves also have several patterns.
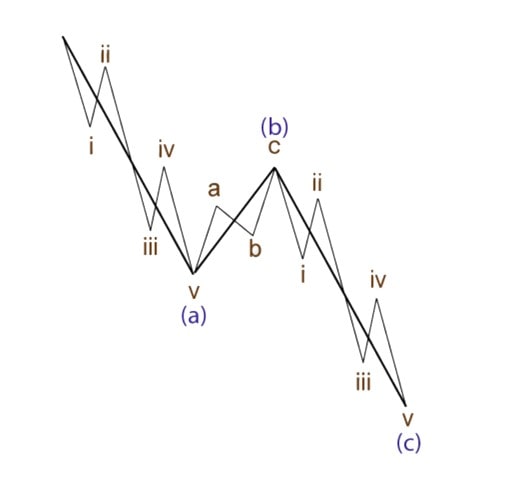
The Zigzag Pattern
Along with the flat pattern, a zigzag is a simple corrective formation.
The common rules:
- A zigzag has three waves.
- Wave A should be an impulse or a leading diagonal pattern.
- Wave B can be any correction pattern.
- The wave should be an impulse or an ending diagonal pattern.
- Wave B is supposed to be shorter than Wave A.\
- Wave C should be longer than Wave B.
- Waves A and C are expected to be motives, but Wave B should be corrective.
The Flat Pattern
There are three different types of the flat pattern.
Follow the rules:
- Just like with a zigzag, it consists of three waves.
- Wave A can be a correction pattern besides triangles.
- Wave B can be any correction pattern, but a zigzag is the most common one.
- Wave C is supposed to be an impulse or an ending diagonal pattern.
- Wave B should be 90% longer than Wave A.
- Wave C should be equal to or longer than Wave B.
- Waves A and C are considered motives, while Wave B should be corrective.
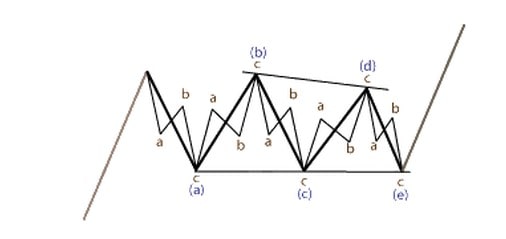
The Triangle Pattern
A triangle is also a correction pattern, but it includes five waves, not three. There are many types of triangles, with rules for each one:
- Impulse Wave 2 isn't a triangle.
- Waves A, B and C should be zigzag, double zigzag, triple zigzag (not too often) or double/triple three.
- Waves D and E can be a triangle.
The Double/Triple Three Pattern
We've mentioned the double/triple three patterns. Let's clarify what they are. The pattern itself includes flat, zigzag, triangle and double/triple zigzags. Three correction patterns form a double three pattern.
The general rules for Double Threes trading:
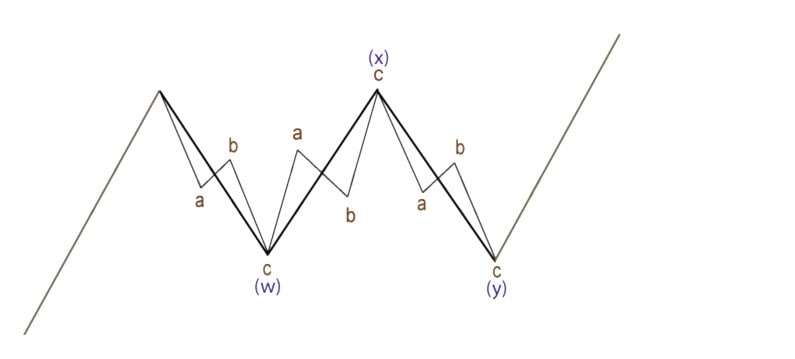
- The pattern has three waves, which are named W-X-Y.
- Wave W can be any correction pattern but not a triangle.
- Waves X and Y can be any correction pattern.
- A double three pattern is located horizontally or lower than the primary trend.
- A double three pattern isn't considered a deep correction.
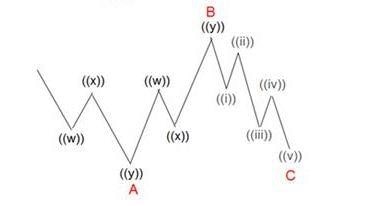
The Triple Three Pattern
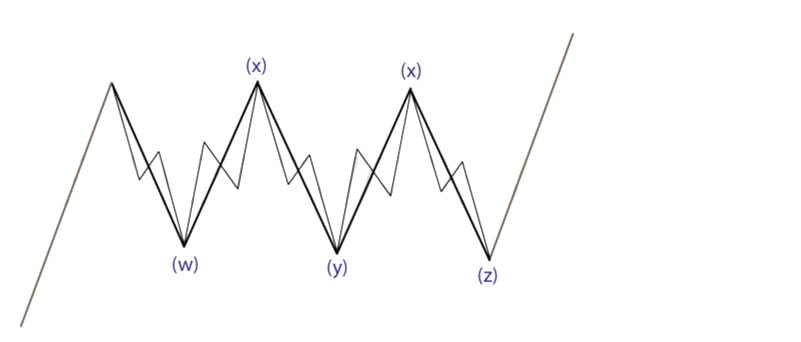
As you can see from the name of the pattern, it's supposed to be longer than the double three pattern. So, it has five waves (usually marked as W-X-Y-X-Z) that move horizontally against the prevailing trend.
Some rules of the triple three pattern:
- Waves W, X and Y are any correction pattern but not a triangle.
- Wave 2 — X and Z — can be any correction pattern.
- The triple three pattern is placed horizontally or lower than the major trend.
- The same as the double three pattern, the triple three pattern is a deep correction.
- This pattern rarely occurs. It's not the best pattern to look at the chart.
The Double Zigzag Pattern
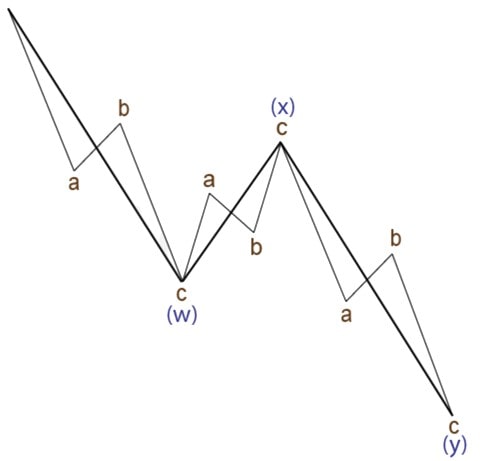
As you can see from the name of the pattern, it includes two zigzags. This pattern appears if only the first zigzag is too small to signal a proper correction.
Look at the rules:
- The Double Zigzag pattern has three waves (W, X and Y).
- Waves W and Y are supposed to be zigzags.
- Wave X can be a correction pattern.
- Wave W should be bigger than Wave X.
- Wave X is smaller than Wave Y.
- A Double Zigzag is considered a deep correction.
We considered the most frequent patterns that may occur on the price chart.
Elliott Wave Degree
You may have noticed when we talked about patterns that we mentioned that they consist of a different number of waves. But patterns are a part of bigger waves. So, each primary wave has several small waves inside.
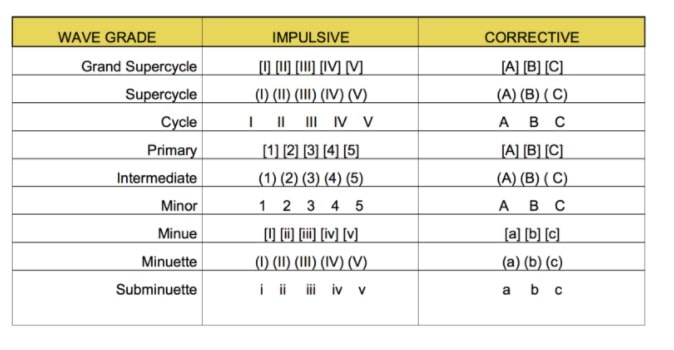
There are nine degrees that are counted from the smallest timeframe, which is hourly, to the largest available. They all have unique names: Grand Supercycle, Supercycle, Cycle, Primary, Intermediate, Minor, Minute, Minuette and Subminuette.
Look at the example below. We have two waves: i and ii. Wave ii consists of smaller waves. We can mark them as W-X-Y. Still, each of the W-X-Y waves consists of smaller waves, for example, a-b-c.
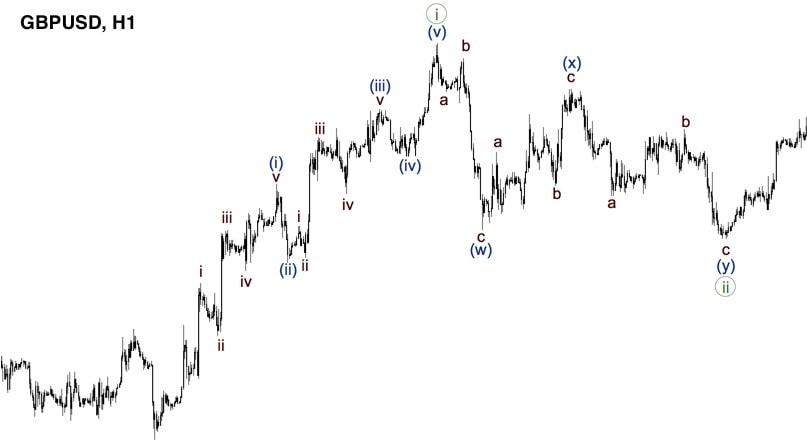
The rule means that we can find smaller waves in any wave until we get the smallest ones.
How to Name Waves
We're sure you've noticed that waves have different names that can be called i, ii, w, x, y, a, b, c, etc. How can you understand what name suits our wave?
Wave notation is used to simplify the understanding of wave count between traders.
Wave notation is used to simplify the understanding of the wave count. Motive waves are named with three Roman and Arabic numbers that go one by one. Corrective waves are named with capital and lowercase letters. In the case of a one-wave degree, Roman numerals and lower case letters or Arabic numbers and capital letters are used.
Cycles
The cycle is the central term in Elliott Wave Theory. Mr Elliott assumed that the market consists of cycles that always repeat. The primary cycle has three waves forward and two waves backwards. This means that the market takes three steps in the direction of the primary trend, and then a correction happens.
The cycle is the central term in Elliott Wave Theory. Any cycle has both impulse and corrective waves.
You should remember that any cycle has both impulse and corrective waves. Impulse waves are always bigger than corrective ones. Impulse waves are always followed by corrective waves. A cycle can be divided into 3- and 5-wave patterns.
The basic cycle is a set of eight waves, where five are impulse, and three are corrective. In general, there can be an infinitive number of cycles in one wave.
The complete cycle is made of 34 waves. Such a cycle can include a basic cycle. It's worth remembering that a basic cycle forms in the direction of the prevailing trend.
The number of waves in one cycle is based on Fibonacci numbers. These numbers help a trader determine the waves' strength and even their duration. Usually, a complete cycle includes 2, 8 or 34 waves.
Degrees and cycles are interconnected and have the same names.
The Waves Themselves
We mentioned waves 1-5 and A-C but haven't said what they stand for. Let's clarify a little bit.
- Wave 1 is the beginning of any cycle. It's hard to identify on the price chart, but it moves in the direction of the prevailing trend.
- Wave 2 corrects the first wave. It moves in the opposite direction but never breaks the starting point of Wave 1.
- Wave 3 moves in the direction of Wave 1 and is supposed to break the endpoint of the first wave. Some analysts consider Wave 3 to be the most powerful wave in the cycle.
- Wave 4 is a correction of Wave 3. It's an uncertain wave as traders have a hard time determining its potential.
- Wave 5 is the end of the primary trend. This wave signals a small potential for traders and means the market will reverse soon.
- Wave A is the first corrective wave. It's always more complicated to define corrective waves than impulse ones because they are much smaller.
- Wave B may create a false impression of a trend's recovery. Still, its volume should be lower than the volume of Wave A.
- Wave C confirms that the opposite trend is taking place. Wave C should either be equal to Wave A or outperform it by not less than 1.618 times.
Elliott Waves: To Use Them or Not to Use Them
Any chart pattern or indicator has advantages and disadvantages. If a pattern has limitations, it doesn't mean you shouldn't use it anymore. It just means you should know about them and use them in your favour.
|
Benefits |
Limitations |
|
|
|
|
|
How to Use Elliott Waves in Trading
Elliott Waves can be drawn on any trading platform. You can do it yourself or by using a technical indicator. However, the indicator is not set by default in trading platforms, for example, MetaTrader 4. That means you'll have to download it from the internet and implement it in MetaTrader.
Here are the general rules on how to draw waves.
- Step 1. Determine the dominant trend.
- Step 2. Try to identify the impulsive waves. See the rules above to do so. The length of the waves should correlate with the major rules.
- Step 3. Mark waves correctly.
- Step 4. Determine the upcoming waves.
- Step 5. Enter the market regarding the waves.
Elliott Waves Signals
We talked a lot about waves and how to draw them. But why do we need these waves for anything other than to identify the trend direction?
- Signal 1. A formation of five impulse waves means there will be a market reversal soon. Thus, if you're already in the market, you can simply close your trade.
- Signal 2. If you haven't opened a position, you can open it on the market reversal. But wait for confirmation. It's dangerous to open the trade on Wave 5 or Wave A. Sometimes, corrective waves are flat. So, it's too early to open a trade in the direction opposite to the previous trend.
- Signal 3. You can also open positions within a pattern. We mentioned above that there are 3- and 5-wave patterns. That means you can open a trade for the current wave.
Elliott Waves: Combination
It's essential to confirm the signals the Elliott Waves provide. To do that, you can use different technical indicators. As waves determine the trend reversal, you should use the tools that serve the same aim. You can apply the trend indicators such as Parabolic SAR, Ichimoku Kinko Hyo and MACD, along with such oscillators as RSI, Stochastic Oscillator and Awesome Oscillator. Oscillators that determine oversold and overbought zones will be highly useful to confirm a price reversal.
Elliott Waves and Fibonacci Retracements
Elliott Wave Theory and the Fibonacci Retracement indicator are interconnected. Fibonacci levels are used to determine the targets of Elliott Waves. Traders and investors can easily use their interconnection to define entry and exit points.
Fibonacci levels are used to determine the targets of Elliott Waves.
How an impulse wave correlates with the Fibonacci ratios:
- The impulse Wave 2 relates to 50%, 61.8%, 76.4% or 85.4% of Wave 1.
- Wave 3 can be 161.8% of Wave 1.
- 14.6%, 23.6%, or 38.2% of Wave 3 relate to Wave 4.
- A range of 1.236–1.618% of Wave 4 is the inverse of Wave 5. Wave 5 can also be the same as Wave 1, or 61.8% ratio of the sum of Waves 1 and 3.
If we take a flat pattern, we can get the following Fibonacci levels:
- Wave B equals 90% of Wave A.
- Wave C is the same as 61.8%, 100% or 123.6% of Wave A-B.
Some rules for the Fibonacci ratios in case of double three patterns:
- 50%, 61.8%, 76.4% or 85.4% of Wave W equal Wave X.
- Wave Y is 61.8%, 100% or 123.6% of Wave W.
- Wave Y shouldn't cross 161.8% of Wave W.
What about triple threes?
- 50%, 61.8%, 76.4% or 85.4% of Wave W equal Wave X.
- 61.8%, 100% or 123.6% of Wave W are the same as Wave Z.
- Wave Y shouldn't cross 161.8% of Wave W. It also can be an impulsive wave (3).
Now, you know how to combine the Elliott Wave Theory and the Fibonacci Retracements indicator.
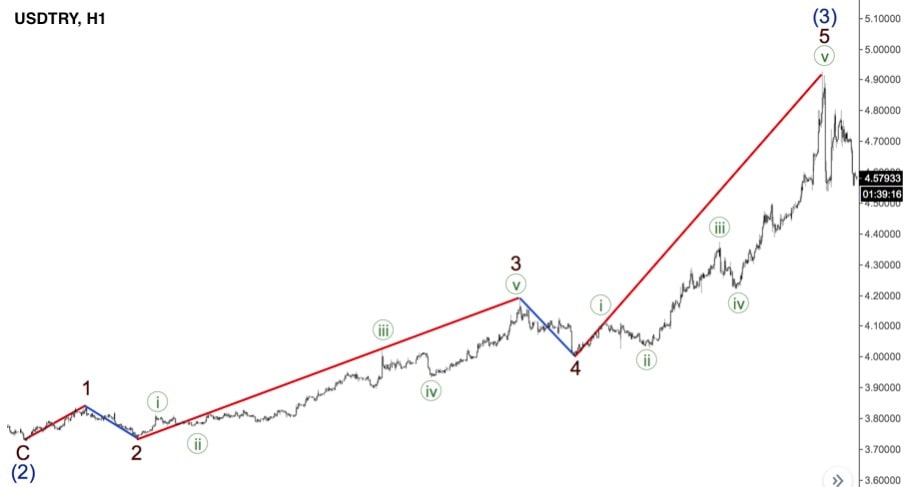
How to Use Elliott Waves in Forex
It's impossible to consider each pattern we mentioned above. However, we can consider at least one example. It's an hourly chart of the USD/TRY pair. Here, we have a formation of an impulse wave that consists of three motive waves and two corrective ones.
As you can see, there are smaller waves inside the big wave. After Wave 5, we can expect a correction.

Strategy
We'd like to share a strategy that may help you start trading waves before you invent your own trading programme.
- Step 1. Any Elliott Wave strategy starts with wave counting. We should enter the trade only in Waves 1, 3 or 5.
- Step 2. Draw a trend line. If you trade in the bullish trend, draw a support line. If you trade in the bearish trend, draw a resistance line.
- Step 3. We're considering the bullish trend. We draw a support level of Wave 1.
- Step 4. We need confirmation of the formation of Wave 2. To do that, we can look at the Awesome Oscillator and Stochastic Oscillator. There should be a bearish divergence between the price chart and the Awesome Oscillator. The Stochastic Oscillator should provide a sell signal.
- Step 5. As soon as the price breaks below the support, we can determine an entry point. It should be located below the level where the previous reversal happened.
- Step 6. The stop-loss level is placed at the beginning of the second wave.
- Step 7. The take-profit should be placed at the next support level, where the market may turn around.
Tips for Traders: Avoid Mistakes
Investors always make mistakes, and we'd like to help you avoid them.
Expert advice. It's better to apply the Elliott Wave Theory on bigger timeframes. The process of wave drawing is quite complicated. Also, small aims will bring small rewards, which is not the aim of a trader.
Expert advice. You can find instruments to draw waves on the platform. There are at least Fibonacci Retracements.
Expert advice. There are combinations between Elliott Wave Theory and indicators to determine entry points. You can also use the approach and graphical analysis to form different patterns in correction waves.
Expert advice. The most effective trades will be in Waves 1, 3 and 5 waves. It's recommended to enter corrective waves only if there is confirmation from other indicators. For instance, there is a divergence with the Awesome Oscillator indicator.
Expert advice. Making deals in impulse Waves 1, 3 and 5, the risk-reward ratio should be at least 1/3.

Expert advice. Before you start drawing waves, read the rules carefully. It's vital to understand the process of drawing. Otherwise, you may build the wrong waves that will provide false signals.
Conclusion
To conclude, Elliott Wave Theory provides strong signals that predict a trend reversal. A trader can use the waves both to enter and exit the market at the perfect points.
However, it's not easy to remember all the rules and identify waves on the price chart. To do that, a trader needs to practice a lot. It's better to do that in a demo account, such as Libertex's free demo account that fully resembles a real account. You can try to draw waves on different timeframes and charts of a wide range of securities.
Let's answer the most frequently asked questions.
FAQ
Does Elliott Wave Really Work?
Yes, this theory is widely used by traders all around the world. If you apply it correctly, you will get strong signals of the market direction.
How Many Waves Are There in Elliott Wave Theory?
The basic pattern consists of five impulse waves and three corrective ones.
What Is Elliott Wave Analysis?
It's a method of analysis that counts the waves of the price movement and identifies the future market direction based on the pattern and basic rules of the wave principle.
What Is Wave 3 of the Elliot Wave Cycle?
It's one of the impulse waves that move in the direction of the primary trend.
What Is Wave 5 of the Elliot Wave Cycle?
It's the last impulse wave of the cycle that moves in the direction of the trend. However, it's supposed to have the smallest volume as not many traders believe in the trend continuation.
Where Do I Start the Elliott Wave Count?
As soon as you see the formation of waves on the price chart, you can start counting regarding the picks where the market changes its direction. If you apply major rules, you'll understand what wave is on the market now.
How Do You Trade on Elliott Waves?
As Elliott Waves define a market reversal, a trader can open positions to trade in the new trend or close the previous position as soon as the wave signals a reversal.
Disclaimer: The information in this article is not intended to be and does not constitute investment advice or any other form of advice or recommendation of any sort offered or endorsed by Libertex. Past performance does not guarantee future results.
Why trade with Libertex?
- Get access to a free demo account free of charge.
- Enjoy technical support from an operator 5 days a week, from 9 a.m. to 9 p.m. (Central European Standard Time).
- Use a multiplier of up to 1:30 (for retail clients).
- Operate on a platform for any device: Libertex and MetaTrader.