How to Deal With Market Volatility in Your Favour
Prepared by the Libertex team
Content reviewed internally in accordance with regulatory standards.
No matter what market you want to invest in, you'll definitely encounter volatility. It's an essential part of financial markets. The most common mistake newbie investors make is that they believe that volatility can appear and disappear.
Volatility always exists. The only difference that determines the success of your investment is its strength. Let's clarify how to use the power of price volatility in your favour.
What Is Volatility?
In basic words, volatility is a measure that determines the rate at which the price of the security changes for the set of returns. Volatility is used to determine the market fluctuation and understand whether the asset is risky or not. It's calculated using a standard deviation.
As we said above, volatility has different degrees: high, medium and low. The higher the volatility is, the riskier the security is.
Volatility is used to determine market fluctuation and understand whether an asset is risky.
There are well-known examples of markets and securities that relate to a specific degree of volatility. For instance, the oil market is considered a highly volatile one. The silver market is known for having low volatility. If we talk about forex, the Australian dollar and New Zealand dollar are generally considered to be highly volatile. However, the degree of volatility will also depend on the timeframe you consider.
The stock market, in general, is a subject of high fluctuations. At the same time, the degree of volatility may differ depending on the stock you trade. For example, Microsoft stocks have medium volatility because Microsoft is a blue-chip company. In contrast, the shares of a new, barely-known company in the market will be highly volatile.
It's crucial to understand that the same asset can frequently be considered risky (i.e., subject to high volatility). Still, its volatility will depend on the period you consider.
Types of Volatility
Although there is a general term for volatility, it's essential to understand the difference in its types.
Historical Volatility
This type of volatility is also known as backward-looking. To calculate historical volatility, you need to determine the asset's standard deviation from its average price for a particular period. You can use both intraday prices and close prices to do so. The average period for intraday calculation varies from 10 to 180 days.
Historical volatility is backward-looking.
For example, if the price of a stock has an average volatility of 20% within the past 100 days and 30% within the past 10 days, it means volatility has increased.
When historical volatility rises, it's more likely that the asset's volatility will deviate from the standard. That means it's either something that will affect the market that has happened or will happen soon. At the same time, if historical volatility declines, the market will return to normal conditions.
Implied Volatility
Unlike historical volatility, implied volatility is forward-looking. This type of volatility is mostly used for options trading. Historical data can't be used to calculate implied volatility. Instead, the option's potential in the market must be evaluated.
To do that, traders gauge supply and demand. When seeing a significant deviation in them, a trader can expect changes in the asset's price (mostly for stocks) they plan to consider. The option's premium serves as a barometer. It rises in price when there is a sharp deviation in either supply or demand and falls when the value is near equilibrium.
Implied volatility can't predict the direction of the security's price but can predict where volatility will be in the future.
Traders can combine historical and implied volatility to determine whether an asset is overvalued or undervalued. If both types show the same values, the security is thought to be reasonably priced. After that, traders consider deviation from the equilibrium to define whether the security is undervalued or overvalued.
Intraday Volatility
Aside from the two major volatility types is another one: intraday volatility. Its name clearly indicates what's at the root of this type of volatility.
Intraday volatility depicts asset fluctuations between open and close prices within one day.
To calculate intraday volatility, you need to measure the range of the previous trading day. The range is measured by the difference between the highest and lowest prices. Afterwards, traders decide what percentage will be comfortable for them to enter into a position. They generally use 70%. A higher percentage is considered less risky to enter the market.
To make it easier, let's look at an example. Let's assume a day before an asset trades in the range of $6.50-$7.50. That means the range is $1, or 100 cents. If you want to enter the trade at 70%, wait until the price is 70 cents above the open price (buy position) or 70 cents below the price (sell position).
How to Calculate Volatility
There are two main methods to calculate volatility, variance and standard deviation, but they're interconnected. The standard deviation is measured as the square root of the variance. Look at the steps below to see how they work:
- Let's imagine you count volatility for the past 10 days. To do that, you need to take the close prices for those days. Excel or a spreadsheet makes it easier to do the calculations.
- The second step is to calculate the average of these figures by adding each number, then dividing the sum by the number of values.
- Let's imagine that the close prices went from $10 to $100. So, on the first day, we had $10, on the second, $20, etc. As a result, we have $550. After that, we divide 550 by 10 and end up with $55.
- The third step is to find the deviation. All you need to do is to take each figure and subtract the average from it. For example, $100-$55 = $45, $90-$55 = $35, etc. It's likely that you'll have negative averages, which is acceptable.
- To remove the negative values, just square the deviations.
- Add the squared deviations together. In our example, we end up with 825.
- The next step is to divide the previous sum by the number of figures (10). That gives us $82.50.
- And the final step to get the standard deviation is to calculate the square root of $82.50. As a result, our standard deviation is approximately $28.70. This number shows how far the price can deviate from the average.
What Can Affect Volatility?
Volatility always exists in the market. However, it's essential to know how to predict it. It's much easier to forecast volatility than to calculate it. High volatility exists when a number of bulls or bears enter the market. Why do they enter the market? Because an event has affected or will affect an asset.
If you've read anything about financial markets, you know that the factors that impact them differ. We can still group them into broad categories.
News
No matter what market you trade in, the news is a vital driver. It can be predictable and unpredictable. For example, when you know that there will be a presidential election in a country, you can expect that the domestic currency's volatility will occur well in advance, during and after the results are known.
News can be predictable and unpredictable. Both types create high market fluctuations.
However, there are also unpredictable news events. For example, oil prices suffered a collapse after Russia and Saudi Arabia couldn't agree on oil production cuts. The oil-price war led to a plunge in WTI prices, which caused negative price levels for the first time in history.
Economic Events
Macroeconomic and microeconomic factors influence each financial market. These events are predictable, so you can easily forecast volatility strength. Economic events include the economic data of a country, an industry or a company (which is important for the stock and bond markets) and show these entities' economic health. The events are always listed in the economic calendar.
Economic events are predictable and listed in the economic calendar.
However, not all of the economic data mentioned in the calendar causes high volatility. Every calendar marks events as 'not important', 'important' and 'highly important'. Highly important events are supposed to lead to big market fluctuations.
There are two main stages when high volatility can be found in the market. The first one is ahead of a report's release. Almost every economic event has a forecast made by analysts. If there's a large gap between the previous data and the estimates, the asset is likely to experience huge fluctuation several hours before the actual data are released.
The next stage is the time when the actual figures are published. If there's a vast difference from analysts' forecasts, volatility will increase even more. This event has the most significant effect on the market from 30 minutes to 2 hours after the actual data is released. As such, traders should expect volatility to decrease a minimum of two hours after economic data are published.
Lack of Interest
We mostly talked about wide market fluctuations, but it's also important to mention low volatility. Low volatility appears when traders or investors don't want to put their money in an asset. This may be because of holidays, the asset's risk grade or the fact that the asset isn't highly used or has low demand.
Volatility: Pros and Cons
Although it seems that volatility may negatively affect a trade's chances, it can also have benefits. Let's look at them.
|
Benefits |
Limitations |
|
High volatility, high rewards. Always remember this rule: the higher the risk is, the bigger reward you may reap. High volatility causes substantial market moves. |
High risks. High volatility creates the risk of losing money as it's almost impossible to predict how the market will behave. However, if you trade with a reliable broker, your losses will be limited. Libertex, for example, uses a margin call that will warn you when your budget is approaching a limit you can't exceed to keep your funds. In addition, a broker can close your position to prevent you from entering a negative balance. |
|
Exciting market. Did you come to the market to sit and wait until the price moves just a bit? We're sure that's not the case. Only significant market moves create a place for big rewards and breathtaking trades. |
Low volatility, low rewards. Because volatility can be both high and low, it's essential to understand that low volatility signals that traders aren't interested in the asset. As a result, it's unlikely that you'll end up with a significant reward for your trading. |
|
Difficult to predict. Although there are predictable factors that affect the degree of volatility in the market, it's not as easy to forecast the strength of volatility. The inability to predict volatility creates challenges for investors. |
Why Volatility Matters to Investors and Traders
The degree of volatility is crucial for traders and investors because their profit depends on the ability to predict the market's direction. High volatility makes market moves significantly. As such, it's complicated to predict which way the price will go.
Volatility and liquidity are interconnected. Low liquidity increases the risk of high volatility.
Volatility also relates to liquidity. Every trader and investor knows that market liquidity weakens during the holidays and is always low in exotic markets. Low liquidity causes high volatility because there aren't enough market players to smooth out market moves.
Volatility Indicators
We've talked a lot about volatility and its effect on markets but haven't said anything about indicators that will help to determine its degree. Here are a few.
Bollinger Bands
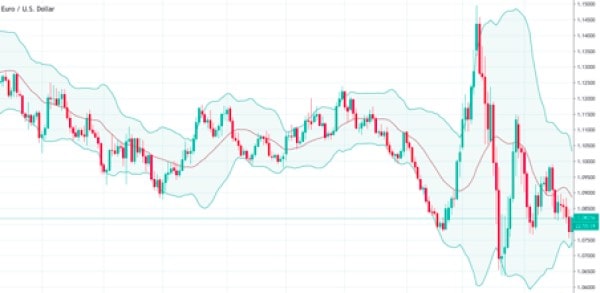
Bollinger Bands are a standard indicator on most trading platforms, including MetaTrader. The indicator consists of three lines, with the middle one being the 20-day Simple Moving Average 20 and the two outer lines representing the deviation from the middle one.
The standard setting is 20 for the middle line, but you can change it based on your trading strategy. It's recommended to use a period from 13 to 24. At the same time, the deviations should range from 2 to 5.
This indicator is used to define how significant the deviation from the average price is. The distance between the lines shows the strength of volatility. Thus, when they're close to each other, volatility is low. When they sharply diverge, the volatility increases. Look at the example.
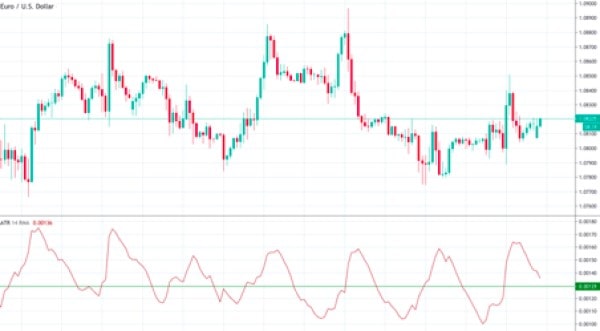
Average True Range (ATR)
Unlike the Bollinger Bands indicator, ATR is placed in a window below the chart. The index shows a moving average of true ranges. True ranges are calculated as the absolute value of the current high minus the previous close or the absolute value of the current low minus the previous close.
The indicator consists of one line. To determine whether the market is highly volatile, a middle line must be drawn. However, there is no central line for this indicator, so you have to draw an estimated version of it or use the 100-period Moving Average and implement it on the index. If the indicator is above the middle line, the market is highly volatile. If it's below the line, the market has low volatility.
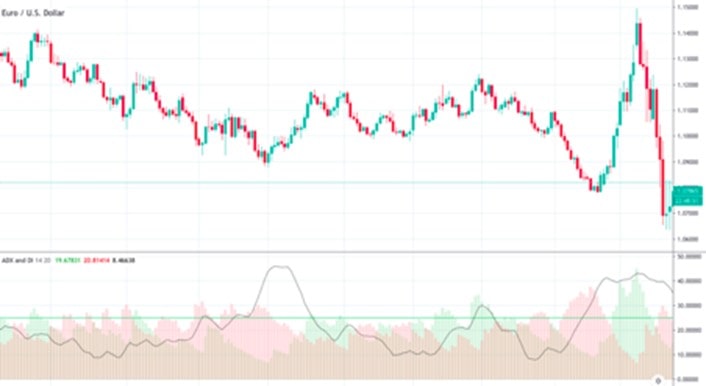
Average Directional Index (ADX)
The ADX indicator is mostly used to determine the strength of a trend. When the indicator enters a zone below 25, it means there's no trend, and the market is consolidating. If it consolidates, it means volatility is low.
Volatility in Different Markets
Although volatility is a commonly used term, its meaning slightly differs across markets.
Stock Market Volatility
If you're a stock investor or a CFD trader, market volatility will determine your strategy. As we said above, the factors that determine the degree of volatility are almost the same for all markets. When trading stocks or investing in them, you should consider news and economic events that will either affect the company, the industry or the economy overall.
To evaluate market volatility, you can use the same indicators used for forex. However, there is a specific one, the CBOE Volatility Index (VIX), that the Chicago Stock Exchange launched in 1993. It reflects market volatility based on the price that investors are ready to pay for companies' stocks in the S&P 500 index.
Commodity Markets
At the beginning of the article, we talked about the silver and oil markets. The oil market is known as one of the most volatile, while the silver market is essentially a safe-haven market. You'll rarely find economic releases for commodity markets, except crude oil inventories data for oil. News and global market sentiment determine market moves for commodity markets.
Forex Volatility
There are two types of traders: those who prefer to avoid volatility and those who take a chance to get fast results using the highly volatile market. High volatility is a result of news and economic events that attract either bulls or bears. Traders who are eager to get fast results 'trade events' and try to predict the market direction.
High volatility appears when markets anticipate economic or political events. For example, if you trade based on Canada's GDP growth data, it's unlikely the actual data will significantly exceed the forecast. However, if you want to trade on OPEC negotiations regarding oil production, it's doubtful you'll be able to predict what the parties will agree to.
As the outcome of many events is hard to predict, it's crucial to choose only those events whose outcome you can forecast.
You can either enter the market ahead of the event based on analysts' predictions or trade on increased volatility. However, you must close the trade when the data are released. Otherwise, you risk losing your money. If you want to trade as soon as the event has occurred, open a position within the first 5 to 10 minutes.
Those who are not fond of risk use markets with lower volatility. For forex, such major currencies as the US Dollar, Euro, Japanese Yen and Swiss Franc experience lower volatility because their market liquidity is really high.
At the same time, checking the news and economic calendar on a daily basis is enough to lower the degree of volatility. As soon as you see that there will be an economic release or a significant political or economic event, close open positions at least two hours before the release is out. You can re-open a position no sooner than two hours after the data or news are released.
Tips for Trading in Volatile Markets
If you want to trade carefully during volatile markets, here are some things to keep in mind:
- Choose what type of volatility suits your strategy. Do you want to take a risk and trade during high volatility, or would you do better to avoid it?
- Choose the indicator that matches your strategy. It's essential to have assistants, such as indicators, that will help you determine the degree of volatility. We mentioned three of the most frequently used indicators to gauge volatility.
- Build your own strategy. There's no perfect volatility strategy. If you want to trade on high volatility, check the economic calendar or news that will give you clues on the events that may make markets highly volatile. If you prefer avoiding market volatility, use indicators that will show you whether the market is highly volatile.
Conclusion
In summary, volatility is an integral part of any market. To be successful in investing or trading, a person should know what factors affect the degree of volatility. High volatility is not as bad as many might think because it yields quick results. Moreover, if you trade with a reliable broker, you'll avoid many obstacles. For example, Libertex uses a margin call to warn its clients if they're approaching the determined budget limit.
Also, low volatility is not always good because it may limit desirable results. To determine what volatility conditions suit you the best, Libertex offers a demo account that fully duplicates the real market.
Finally, let's answer essential questions on this topic.
FAQ
What Does Volatility Mean?
Volatility is a measure that shows the rate at which the price of an asset changes and gauges the strength of the market.
Is High Volatility Good or Bad?
It depends on your trading strategy. In general, high volatility creates a risky situation with a lack of opportunity to predict market moves. At the same time, high volatility is an option to achieve a higher reward.
What Is Considered High Volatility?
High volatility is a market condition when the price rises or falls significantly within a short period of time. It's easily seen on the chart as the price forms long candlesticks.
What Causes Volatility?
Volatility always exists. High volatility is influenced by market events such as news and economic releases. Anything that can lead to either inflow or outflow of funds in the market creates high volatility. Low volatility is based on the lack of investors' willingness to invest in an asset.
How Is Volatility Used in Trading?
To trade successfully, traders should be aware of the possible degree of volatility. High volatility is considered a risk factor, and lots of traders prefer avoiding it by not trading based on news or economic releases. Those who prefer to take a risk and get fast results use high volatility.
Disclaimer: The information in this article is not intended to be and does not constitute investment advice or any other form of advice or recommendation of any sort offered or endorsed by Libertex. Past performance does not guarantee future results.
Why trade with Libertex?
- Get access to a free demo account free of charge.
- Enjoy technical support from an operator 5 days a week, from 9 a.m. to 9 p.m. (Central European Standard Time).
- Use a multiplier of up to 1:30 (for retail clients).
- Operate on a platform for any device: Libertex and MetaTrader.