

The Best MetaTrader 5 Indicators: A Comprehensive Overview for Traders
Prepared by the Libertex team
Content reviewed internally in accordance with regulatory standards.
MetaTrader 5 offers traders extensive analysis tools for the financial markets. MT5 indicators are mathematical calculations based on price and volume data, used to identify market trends and spot potential trading opportunities. These technical tools form the foundation of technical analysis and are used worldwide.
Key takeaways
- MetaTrader 5 offers over 38 built-in indicators for market analysis.
- Indicators fall into four main categories: trend indicators, oscillators, volume indicators and volatility.
- MQL5 enables the development of custom tools.
- Combining multiple indicators can help structure and confirm trading signals.
- The Strategy Tester allows you to backtest trading approaches.
Please note that leveraged CFD trading can be risky and may result in the loss of all your invested capital.
Why MT5 indicators are essential for modern traders
Financial markets generate vast amounts of data every day. Indicators transform this raw data into digestible information for technical chart analysis. MetaTrader 5 offers a comprehensive library of technical analysis tools for different trading styles and time frames.
The platform supports advanced charting features with multi-timeframe analysis. The MQL5 programming language enables the development of tailored analysis tools and helps simplify trading decisions.
Advantages of indicators:
- Over 38 pre-installed tools for different analysis purposes.
- Flexible parameter settings for individual trading approaches.
- Real-time analysis with continuous updates.
- Backtesting functions for validation.
The development of technical indicators: from MT4 to MT5
The evolution from MetaTrader 4 to MetaTrader 5 brought significant improvements. The MQL5 programming language offers extended functionality compared to MQL4, including object-oriented programming and improved performance.
MetaTrader 5 supports 21 time frames, compared to 9 in MT4. The extended features include more drawing tools and improved visualisation. The community on mql5.com provides access to thousands of custom MetaTrader 5 indicators and Expert Advisors (EAs).
Technical improvements:
Feature | MT4 | MT5 |
Time Frame | 9 | 21 |
Programming language | MQL4 | MQL5 |
Order types | 4 | 6 |
Built-in indicators | 30 | 38+ |
Understanding the key categories of MT5 indicators
Indicators can be divided into four main categories. Technical analysis often combines multiple categories to build a comprehensive market view. Each category is suited to different market phases.
Choosing the right indicator category depends on the current market environment. Trend indicators provide more precise signals in trending markets, while oscillators are more effective in sideways markets.
Trend indicators: the foundation of trading approaches
Trend indicators identify the prevailing market direction. The moving average smooths price fluctuations by calculating the average price over a period of time. This indicator is among the most widely used technical tools.
The MACD (Moving Average Convergence Divergence), developed by Gerald Appel, combines trend and momentum features using two moving averages and a histogram. Crossovers can indicate potential trend reversals. The ADX (Average Directional Index) measures trend strength — values above 25 suggest a strong trend.
The most important trend indicators:
- Simple Moving Average (SMA): Arithmetic average.
- Exponential Moving Average (EMA): Gives more weight to recent prices.
- MACD: Shows momentum and trend direction.
- ADX: Measures trend strength (0–100 scale).
- Parabolic SAR: Identifies reversal points.
Trendlines combined with moving averages can identify support and resistance levels. The period length affects sensitivity — shorter periods react faster but generate more false signals.
Oscillators: identifying oversold and overbought markets
Oscillators move within a defined range and identify overbought or oversold market conditions. The RSI (Relative Strength Index), developed by J. Welles Wilder, oscillates between 0 and 100, with values above 70 considered overbought and below 30 oversold.
The stochastic oscillator, developed by George Lane, compares the current closing price with the trading range over a given period. The stochastic, as a type of oscillator, consists of two lines (%K and %D) and generates signals through crossovers. The stochastic can be used to identify divergences.
Key oscillator signals:
- Overbought zone (values above 70/80): Potential correction.
- Oversold zone (values below 30/20): Possible recovery.
- Divergences: Price and the indicator move in opposite directions.
- Midline crossovers: As a trend signal.
The Commodity Channel Index (CCI) measures the deviation of the price from its statistical average. Williams %R shows the position of the closing price relative to the recent trading range.
Volume indicators: feeling the pulse of the market
Volume indicators analyse trading activity and confirm the strength of price movements. On-Balance Volume (OBV) adds the volume on up days and subtracts the volume on down days. A rising OBV line suggests buying pressure.
The Money Flow Index (MFI) combines price and volume data and is often referred to as a "volume-weighted RSI". It oscillates between 0 and 100 and identifies overbought (>80) and oversold (<20) conditions. Chaikin Money Flow (CMF) measures money flow over a defined period and is often used to analyse changes in institution-driven volume.
Using volume indicators:
- Trend confirmation: Rising volume strengthens the trend.
- Divergence detection: Falling indicators alongside rising prices warn of weakness.
- Breakout validation: High volume on breakouts suggests genuine moves.
- Reversal signals: Extreme volume can signal exhaustion.
Volume analysis in forex trading is limited because there is no centralised market. MetaTrader 5 uses tick volume as an approximation.
Volatility indicators: measuring and using market turbulence
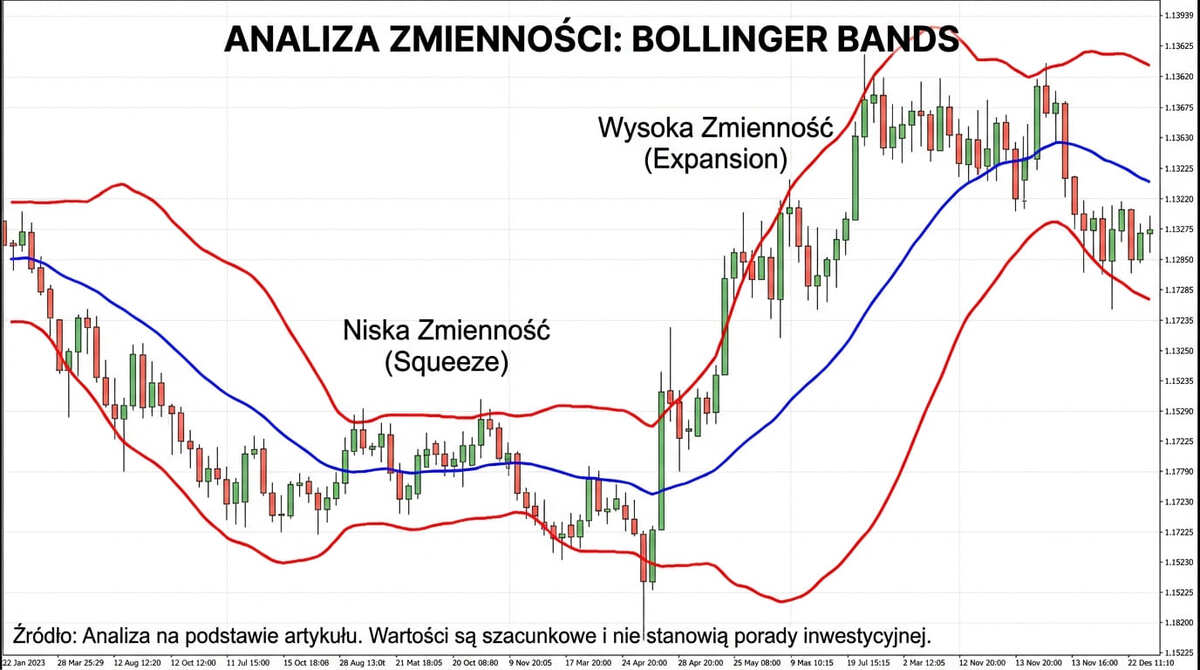
Volatility indicators measure the intensity of price movements. Bollinger Bands, developed by John Bollinger, consist of a moving average and two standard-deviation bands. The bandwidth adapts to market volatility.
The Average True Range (ATR) measures the average trading range over a given period. ATR is used for position sizing and stop-loss placement (see the position sizing calculation in the setup guides). A rising ATR indicates increasing volatility.
Use cases:
Indicator | Main purpose | Setting |
Bollinger Bands | Mean reversion | 20, 2 StdDev |
ATR | Stop-Loss | 14 periods |
Keltner Channel | Trend following | 20 EMA, 2x ATR |
The Bollinger Squeeze occurs when the bands narrow. This often indicates a strong move may be imminent.
5 of the best MetaTrader 5 indicators for different market conditions
Choosing effective indicators depends on your trading style and market conditions. Experienced traders combine tools from different categories for signal confirmation.
The 5 most commonly used indicators:
- Bollinger Bands: Measuring volatility and mean reversion.
- MACD: Momentum and trend reversals.
- RSI: Overbought/oversold conditions.
- Ichimoku Kinko Hyo: A complete trading system.
- Volume Profile: Identifying key price levels.
The Bollinger Bands indicator: measuring volatility and trend strength
Bollinger Bands are versatile for measuring volatility and analysing trends. The default setting uses a 20-period SMA and ±2 standard deviations. Assuming a normal distribution, it is theoretically expected that around 95% of price values will fall within the outer Bollinger Bands. However, this percentage can vary in real financial markets.
The Bollinger Squeeze — extremely low volatility with tight bands — often precedes a strong move. Bollinger Band walks occur when the price repeatedly touches a band, signalling a strong trend.
Bollinger Bands strategies:
- Mean reversion: Buy at the lower band, sell at the upper band.
- Trend trading: Band expansion as trend confirmation.
- Squeeze breakout: Wait for a breakout after the squeeze phase.
- Double Bollinger Bands: Combining 1 and 2 standard deviations.
The bandwidth provides insight into market volatility. An expansion indicates increasing volatility, while a contraction indicates decreasing volatility. A step-by-step setup guide for MT5 can be found in the platform documentation.
MACD: spotting momentum and trend reversals
The MACD combines three components: the MACD line (difference between the 12- and 26-period EMA), the signal line (9-period EMA), and the histogram. This combination makes the tool powerful.
Signals:
- Bullish crossover: MACD crosses above the signal line from below.
- Bearish crossover: MACD crosses below the signal line from above.
- Zero-line crossover: Confirms the trend direction.
- Divergences: Warn of trend reversals.
The histogram shows trend momentum. The indicator is mainly used in trending markets, while it can generate more false signals in sideways phases.
Ichimoku Kinko Hyo: the all-in-one trading system
Ichimoku Kinko Hyo, developed by Hosoda Goichi, is a comprehensive analysis system with five lines: Tenkan-sen, Kijun-sen, Senkou Span A and B (which form the Kumo cloud), and Chikou Span. The Kumo serves as a dynamic support and resistance zone.
A green cloud (Span A above Span B) suggests an uptrend, while a red cloud suggests a downtrend. The thickness of the cloud signals trend strength.
Ichimoku trading signals:
- Tenkan-Kijun crossover: Buy signal when Tenkan crosses Kijun from below.
- Price above/below the Kumo: Confirms trend direction.
- Chikou Span above price: Bullish signal.
- Kumo twist: Signals a potential trend reversal.
The strength of Ichimoku Kinko Hyo lies in providing a complete market view from a single chart.
RSI with stochastic: a combination for reversal signals
This combination of two oscillators is often used to analyse potential reversal phases from different perspectives and to put signals into context. Both identify overbought/oversold conditions using different calculation methods, making a side-by-side comparison valuable in analysis.
Possible signal setups:
- If both indicators are below the threshold (below 30/20), this may suggest oversold conditions.
- If both indicators are above the threshold (above 70/80), this may suggest overbought conditions.
- Divergences in both indicators can highlight potential trend reversals.
- Simultaneous crossovers (RSI crossing the 50 line while stochastic %K crosses %D) are monitored by some traders as an additional signal.
This combination can help reduce false signals by confirming them with two independent methods.
Volume Profile: invisible support and resistance lines
Volume Profile visualises traded volume at different price levels, based on Auction Market Theory. The value area covers 70% of the volume. The Point of Control (POC) is the price level with the highest volume.
Volume Profile applications:
- Support/Resistance: Use the POC and value area as key levels.
- Breakout confirmation: Low-volume areas point to breakout zones.
- Mean reversion: Return to the POC in sideways markets.
- Trend validation: A shift in the value area confirms the trend.
A tutorial on setting it up can be found in the extended platform documentation.
Custom MT5 indicators: personalised solutions for your trading style
MetaTrader 5's adaptability through custom tools expands your analytical capabilities. The programming language enables the development of specialised tools for specific approaches. Thousands of custom indicators are available in the Market.
Developing your own indicators gives you full control over calculation logic, lets you combine different approaches, and tailor them to your own market observations.
Advantages of custom indicators:
- Tailor-made solutions for trading approaches
- Combining multiple methods in one tool
- Optimisation for specific markets
- Integration of proprietary analysis methods
- Reducing chart clutter
Creating your own MT5 indicators: a practical overview
Developing your own indicators requires basic programming knowledge. MetaEditor offers syntax highlighting, debugging tools and access to documentation. The wizard simplifies creation with code templates.
Steps to create an indicator:
- Open MetaEditor: Tools → MetaQuotes Language Editor.
- Create a new indicator: File → New → Custom Indicator.
- Use the wizard: Define the basic parameters.
- Implement the calculation logic: Code the OnCalculate() function.
- Compile and test: Press F7 to compile.
The syntax is similar to C++. Key concepts: array handling, indicator buffers and event handler functions.
Resources for free and premium MetaTrader 5 indicators
The Market is the official platform for indicators, operated by MetaQuotes. It offers a wide selection of free tools, complemented by premium products.
Sources for indicators:
Platform | Type | Advantages |
Market | Free & premium | Official platform |
Code Base | Free | Available as open source |
TradingView | Free & premium | Large community |
When choosing, users should consider ratings, downloads, how recently the tool has been updated, and the support on offer. Warning signs: exaggerated performance promises, missing documentation, negative reviews.
Avoiding common mistakes when using MT5 indicators
Using indicators effectively requires discipline and realistic expectations. Many traders fall into typical traps such as overtrading. By understanding these mistakes, you can avoid them.
Psychological factors play a significant role. The desire for certainty often leads traders to add more and more tools. This can lead to analysis paralysis.
The 5 most common mistakes:
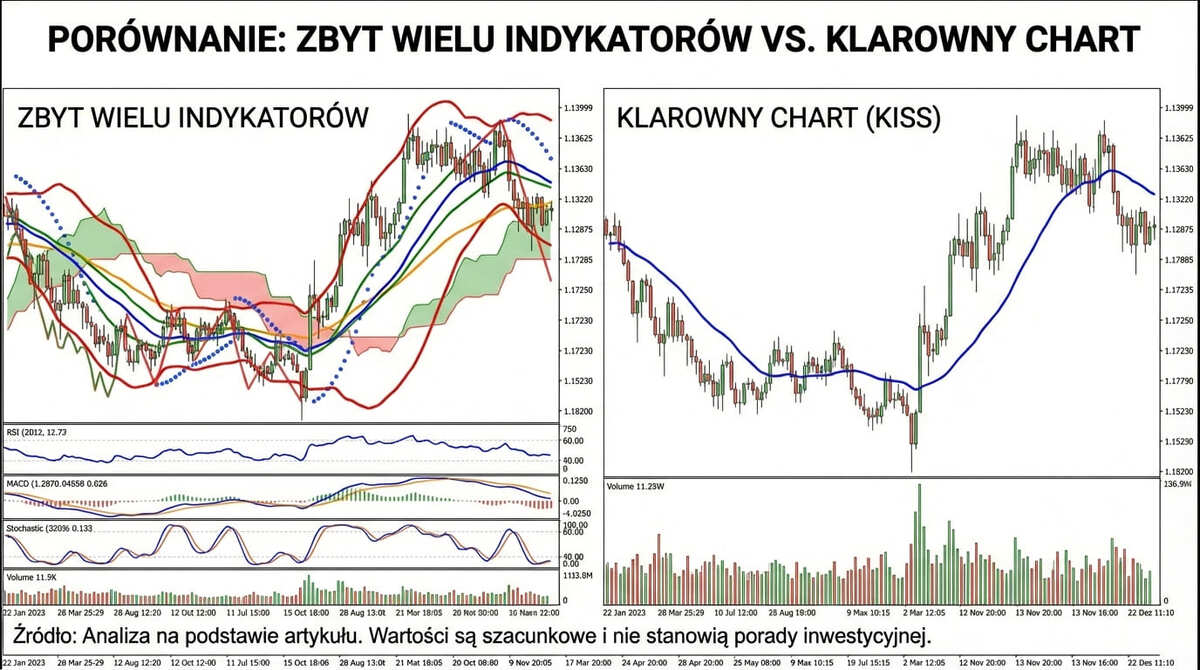
- Using too many indicators
- Not adapting to market conditions
- Ignoring market structure
- Trading without signal confirmation
- Lack of understanding of the basics
Over-optimisation: why more indicators are not always better
Over-optimisation, or curve fitting, occurs when approaches are adapted too closely to historical data. Charts with too many indicators create confusion rather than clarity.
Analysis paralysis arises when there are too many information sources. Traders wait for perfect setups and miss trading opportunities. Many training and specialist resources point out that using too many indicators makes decision-making harder, which is why, in practice, traders often focus on a limited selection of core tools.
Signs of over-optimisation:
- Cluttered, hard-to-read chart
- Conflicting signals from different indicators
- Inability to make quick decisions
- Perfect backtest, but failure in live trading
- Constantly adding/removing indicators
The "keep it simple" philosophy suggests 2–3 complementary tools from different categories: a trend indicator, an oscillator and a volatility indicator.
Indicator hierarchy: the right order of analysis tools
A structured analysis system arranges tools in a logical hierarchy: primary indicators identify the market phase, secondary indicators refine entry opportunities, and tertiary indicators confirm signals.
Hierarchy pyramid:
- Foundation – market phase: Trend or range? (ADX, price action)
- Trend direction: Market direction? (Moving Averages)
- Momentum: Strength of the move? (Oscillators)
- Entry timing: Optimal entry? (Divergences, support/resistance)
- Confirmation: Volume support? (Volume tools)
Developing a trading system with a clear hierarchy can help promote consistent trading discipline.
Multi-indicator strategy for MT5
Combining multiple indicators into one approach requires understanding their interactions. An effective method uses tools from different categories to build a complete market picture.
Signal confirmation reduces false signals: a trading signal should be confirmed by at least two independent indicators.
Components of a trading approach:
- Trend filter: Higher-level market direction (200 MA)
- Momentum indicator: Overextension (oscillators)
- Entry trigger: Entry signals (crossovers)
- Volume confirmation: Strength of the move (OBV)
- Volatility filter: Position sizing (ATR)
Combining indicators for different market phases
Markets go through different market cycles: trends, range-trading phases and consolidations. Each phase requires different indicator combinations.
In trending markets (trend trading), trend tools work best. A combination of moving average and ADX provides clear signals. In range markets, oscillators are more effective at identifying overbought/oversold conditions.
Adaptive combinations:
Market phase | Primary indicator | Trading approach |
Uptrend | EMA 20/50 | Buying pullbacks |
Sideways market | Bollinger Bands | Mean reversion |
High volatility | ATR | Volatility trading |
Identifying market phases with ADX: values below 20 suggest sideways markets (oscillators), while values above 25 suggest trends.
Backtesting with the MT5 Strategy Tester
The Strategy Tester allows you to validate strategies using historical data. Backtesting is essential for checking robustness before live trading.
Backtesting steps:
- Create an Expert Advisor: Implement the rules
- Define test parameters: Period, symbol, time frame
- Initial testing: Test runs with default parameters
- Optimisation: Systematic parameter variation
- Walk-forward test: Out-of-sample validation
The optimisation feature varies parameters systematically and identifies optimal settings. Optimised parameters should be validated over a separate period.
Performance metrics:
- Profit factor: Ratio of gross profit to gross loss (>1.5)
- Maximum drawdown: Largest decline in equity
- Win rate: Percentage of winning trades
- Expectancy: Average expected profit
- Sharpe ratio: Risk-adjusted return (>1)
Conclusion: the path to trading with MT5 indicators
Indicators are powerful technical analysis tools, but their effectiveness depends on correct use. Sustainable trading approaches are based on a solid understanding of selected tools and their systematic, disciplined application.
Continuous learning is crucial. Markets evolve, new indicator concepts emerge, and trading psychology matures. Recording trades and analysing performance make it possible to identify strengths and weaknesses.
Key principles:
- Focus on 2-3 complementary tools
- Clear rules for interpreting signals
- Adapting to market phases
- Systematic backtesting
- Continuous evaluation
- Risk management
MetaTrader 5's technological capabilities provide extensive analysis tools. Success depends on discipline, realistic expectations and a willingness to learn.
Key insights from indicator analysis
The evolution in indicator use shows a trend: from complex multi-indicator setups to simplified approaches. Trading experience and professional development show that the quality of interpretation matters more than the quantity of tools.
Fundamental lessons:
- Simplicity beats complexity
- There are no holy grails
- Market context is crucial
- Discipline over analysis
- Risk management is essential
Developing your own trading philosophy takes time. Studying indicator concepts, paper trading, and a gradual transition to live trading form a solid development path.
Frequently asked questions about MT5 indicators
What are technical indicators in MT5, and how do they work?
Technical indicators are mathematical calculations based on price, volume or open interest. They transform historical data into visual signals for trends, momentum, volatility or market strength. MetaTrader 5 offers over 38 pre-installed tools and access to thousands of custom tools via the Market. One can enjoy a MetaTrader indicator free of charge in most cases.
Which MetaTrader 5 indicators are best for trading?
Effectiveness depends on your trading style. The most commonly used are moving averages (trend), RSI (momentum), MACD (trend and momentum), Bollinger Bands (volatility), and volume tools. Combining different indicator types often provides more reliable signals.
How do you install and add indicators in MetaTrader 5?
For built-in tools: open the Navigator window (Ctrl+N) → expand Indicators → drag and drop onto the chart. For custom ones: copy the file to MQL5/Indicators → restart MT5 → it will appear in the Navigator under "Custom". You can also install directly via the Market.
Which MT5 indicators are suitable for traders new to the market?
Beginners should start with simple tools: Simple Moving Average (trend), RSI (overbought/oversold), MACD (momentum) and Bollinger Bands (volatility). They have clear interpretation rules and extensive learning resources. Focus on understanding rather than quantity.
How can you combine multiple MT5 indicators effectively?
Use tools from different categories: a trend tool (moving average), an oscillator, and optionally a volume indicator. Signal confirmation is important. A signal should be confirmed by at least two indicators. Avoid redundant tools.
Which is best between MetaTrader 4 and 5, and how do their indicators differ?
MetaTrader 5 offers extended functionality: 21 time frames (vs 9), more built-in tools (38+ vs 30), and the more powerful MQL5 programming language instead of MQL4. Indicators support object-oriented programming. MT4 and MT5 tools are not directly compatible.
Where can you download the best MetaTrader 5 indicators?
The Market (built into MT5) is the official source, with free tools and thousands of premium tools. The Code Base offers free open-source indicators. Additional sources include Forex Factory and TradingView, making these the best MetaTrader alternatives for open-source indicators. Check user ratings. The best free forex Expert Advisor MetaTrader 4 and 5 both offer.
How do you programme your own MT5 indicator?
Open MetaEditor (Tools → MetaQuotes Language Editor), create a custom indicator (File → New), and use the wizard for the basic framework. Implement the logic in the OnCalculate() function. Programming knowledge (similar to C++) is required. The documentation provides tutorials.
Which trend indicators are particularly effective in MT5?
Moving averages are the core trend tools. MACD combines trend and momentum. ADX measures trend strength without indicating direction. Parabolic SAR identifies reversal points. A combination of a fast EMA (12) and a slow EMA (26) signals trend reversals.
How can you avoid false signals from MT5 indicators?
Use multiple tools for confirmation. Adjust parameters to market volatility. Take higher time frames into account. Avoid trading in low-liquidity conditions. Incorporate price action. Accept that false signals are unavoidable.
Disclaimer: The information in this article is not intended to be and does not constitute investment advice or any other form of advice or recommendation of any sort offered or endorsed by Libertex. Past performance does not guarantee future results.
Why trade with Libertex?
- Get access to a free demo account free of charge.
- Enjoy technical support from an operator 5 days a week, from 9 a.m. to 9 p.m. (Central European Standard Time).
- Use a multiplier of up to 1:30 (for retail clients).
- Operate on a platform for any device: Libertex and MetaTrader.