Our technical analysis series is back with a brand-new indicator to sink our teeth into. Both long-term investors and short-term traders can potentially benefit from incorporating this useful analytical technique into their respective strategies. Technical analysis helps market participants find potentially optimal entry and exit points and is thus an invaluable item in any trader's or investor's toolkit. After looking at several volatility indicators, including the Average True Range (ATR), today we'll be moving onto perhaps the most powerful reversal indicator: the Keltner Channel.
What is a Keltner Channel?
Originally developed by market technician Chester Keltner in his 1960 book ‘How to Make Money in Commodities', Keltner Channels have been used by traders and investors ever since. Like the Bollinger Bands we looked at in the spring, the Keltner Channel is an envelope-based indicator. They both have an upper and lower boundary to help you identify potential “overbought and oversold” levels. Largely mirroring the Average True Range (ATR), these volatility-based bands are placed on either side of a given asset's price and can then be used to determine the trend's direction. The exponential moving average (EMA) of a Keltner Channel is usually 20-60 periods, though this can be modified by the user. A Keltner Channel's upper and lower bands are commonly set at two times the average true range (ATR) above and below the EMA.
Why do we use it?
Keltner Channels give traders a quick visual map of a security's average price and volatility, which they can then use to identify assets that have moved well outside of their normal ranges. An opportunity to trade the asset as it moves back into the trend zone could then materialise. On the contrary, if it maintains price action outside of the Keltner Channel, that could signal a trend change or "breakout," which would present a different set of trading possibilities depending on the direction of the pre-existing trend. Due to its short-to-medium-term applicability, the Keltner Channel is a favourite of swing traders and is a central feature of a number of associated strategies, such as the Trend Pullback or Breakout. Essentially, it's used to identify trade opportunities in swing action as prices move within an upper and lower band. As with the vast majority of other indicators, it's best used in combination with other reversal indicators for greater reliability.
The Trend Pullback Strategy
This strategy aims to buy during an uptrend when the price pulls back to the middle line. A stop loss should be placed about halfway between the middle and lower band, with a target near the upper band. If the price is constantly hitting your stop loss, you can move it a little closer to the lower band.
In a downtrend, the aim is to sell short as the price rallies to the middle line. This time your stop loss should be about halfway between the middle and upper band, with a target near the lower band. In case of frequent stop outs, move your stop loss a little closer to the upper band.
This strategy aims to exploit the trending tendency and generate trading signals with an approximate 0.5 risk-reward ratio since the Stop-Loss point is around half the length of the target price length. Not all pullbacks to the middle band should be traded. Sometimes a trend isn't present, in which case, this method isn't effective. If the price is moving back and forth, hitting the upper and lower band, then this method also won't be effective.
Last weekly Gold chart, with the Keltner Channel overlayed:
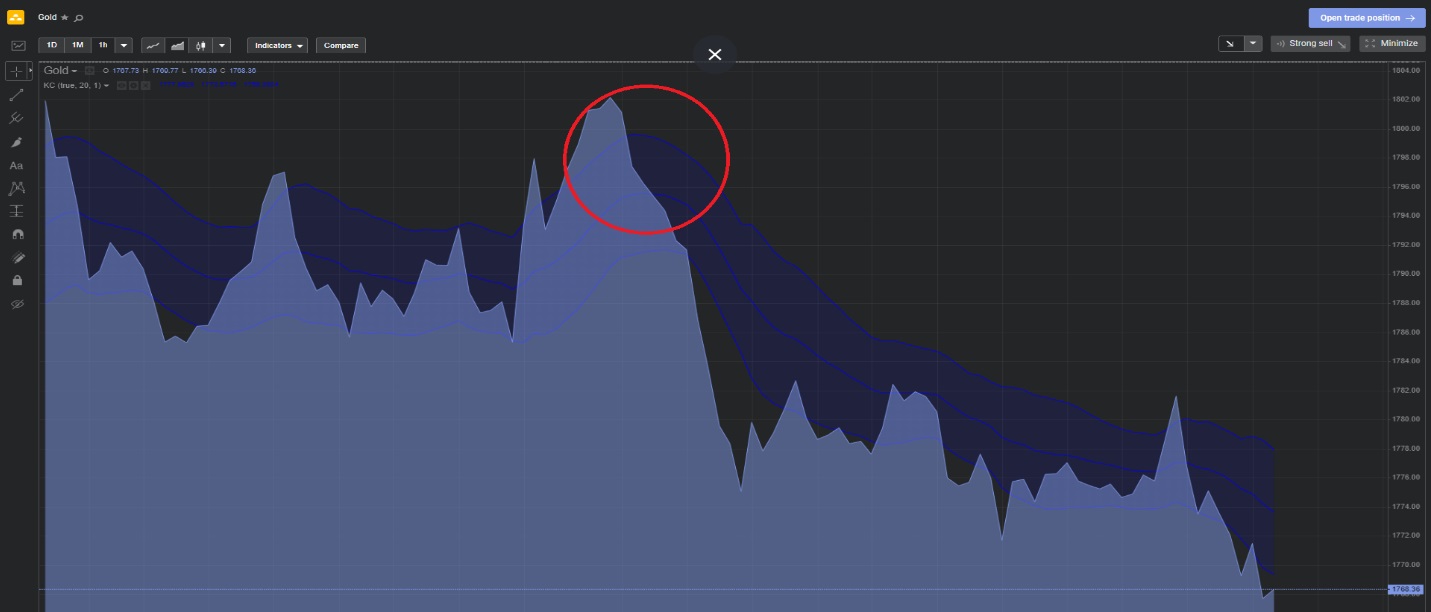
As we can see in the red circle, the price moves sharply towards the central Keltner band, and a short time later, a clear downtrend ensues.
The Breakout Strategy
The Keltner Channel breakout strategy looks for big moves that the Trend Pullback strategy might miss. It can be used near a major market opening as this is when the market makes its most radical movements.
The basic aim of the strategy is to buy if the price breaks above the upper band or sell short should it drop below the lower band in the first 30 minutes after the market opens. The middle band, meanwhile, is used as an exit signal.
The Breakout Strategy doesn't have a profit target per se. The wise potential move is to exit the trade whenever the middle band is touched, irrespective of whether they have made a profit or loss. As the market opening is a time of high volatility, there could well be multiple signals within the first 30 minutes of trading. However, if there's no big move following the first two channel breakouts, then there probably won't be any.
Take a look at this Google chart below to see how the Breakout Strategy works in practice:
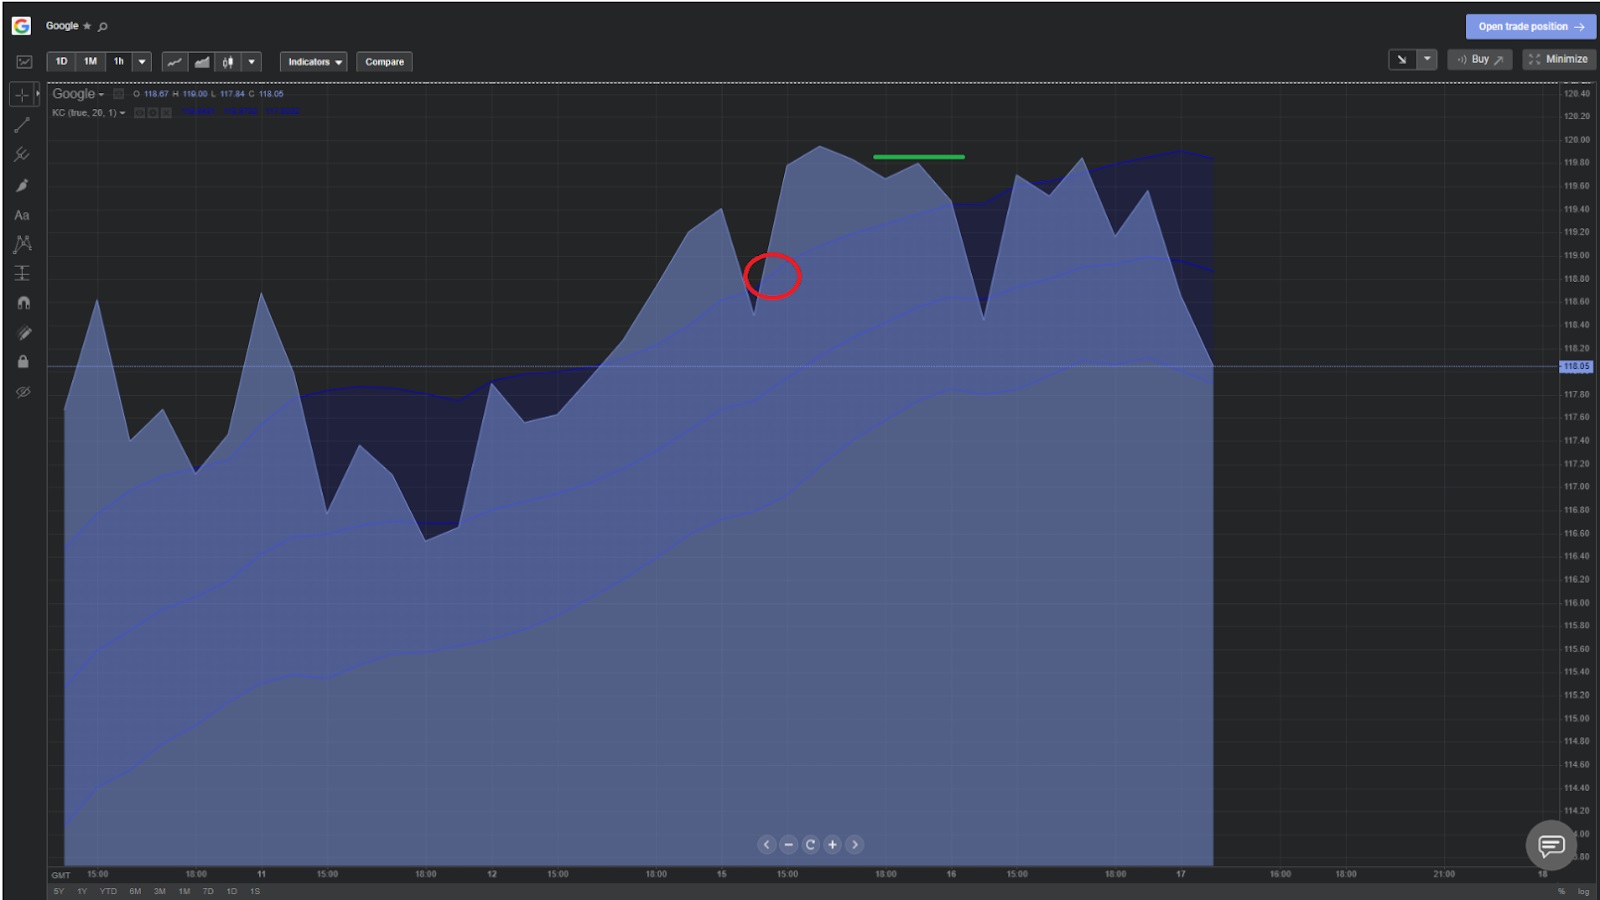
If we focus on the morning of the 16th (15:00 GMT), we can see a sharp move above the top Keltner boundary within the first 30 minutes or less of trading. If we were to follow the strategy and buy here (red circle), we would have turned a reasonable profit. The price doesn't drop anywhere near the middle band all day, so assuming a quick sell before the close of trading, the green line represents our sell level.
If, however, we chose to hold the position overnight and sell the following morning, we would've actually ended up losing money (see the trough immediately after our proposed sell point). This highlights how fine the margins are with short-term trading: Even the slightest deviation from one's plan can be the difference between making a profit and registering a loss.
Never stop learning with Libertex
As with every other TA tool we've covered in this segment, we aren't suggesting that these strategies are a surefire way to profit. That said, it certainly never hurts to have useful moves like this in your playbook. As with any short-term trading strategy, risk management is key. All the indicators we've looked at thus far should be used together for the greatest accuracy, and you can do this risk-free by using your free Libertex Demo Account and practising your skills.
Risk Warning: CFDs are complex instruments and come with a high risk of losing money rapidly due to leverage. 62.2% of retail investor accounts lose money when trading CFDs with this provider. Tight spreads apply. Please check our spreads on the platform. Available for retail clients on the Libertex Trading Platform. You should consider whether you understand how CFDs work and whether you can afford to take the high risk of losing your money.