
Whether you're a short-term trader or a set-and-forget investor, technical analysis is always beneficial when it comes to picking the ideal entry and exit points for a range of different asset classes. After looking at Bollinger Bands in our previous educational article, we thought we'd show you another indicator that works great in combination with the MACD and RSI we reviewed in our first article of the series. Now, we'll take a look at J. Welles Wilder's Average True Range.
What is the ATR?
The Average True Range or ATR is a volatility indicator that works by decomposing the entire range of an asset price for a given period. The true range indicator is calculated by taking the greatest of the following: current high minus current low; the absolute value of the current high minus the previous closing price; and the absolute value of the current low minus the previous closing price. The ATR is thus a kind of moving average, one which generally uses a 14-day simple moving average of the true ranges. It was initially developed for use with commodities but is applicable to a range of instruments, including equities. While it is typically configured for a 14-day timeframe, it can easily be modified for traders with shorter-term targets by following the same calculation principle as given above.
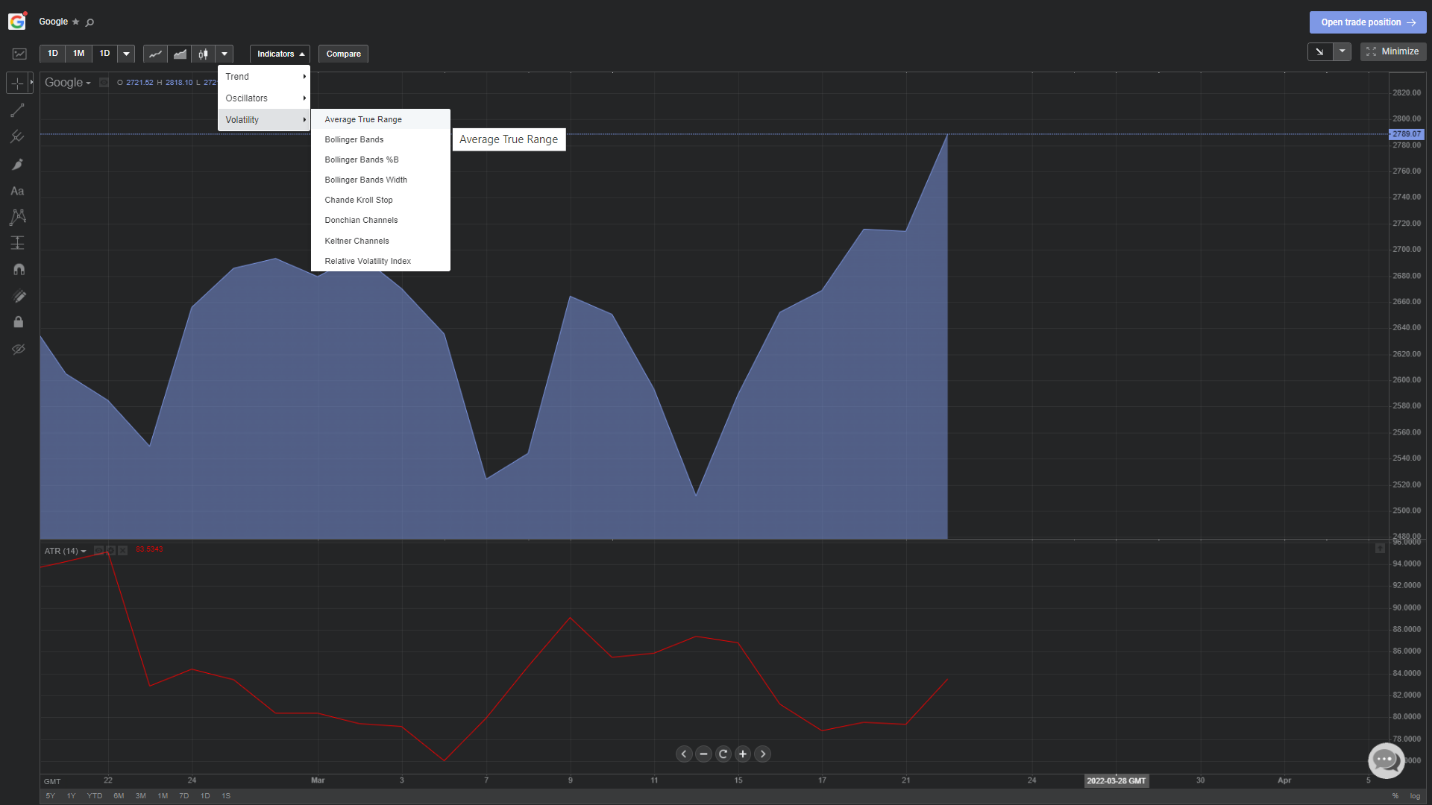
To add it to this one-month Google chart (of course, you can use it with any instrument and timeframe you like), simply enter full-screen mode on the chart timeframe of your choice, hover over the indicators tab, select volatility and then click the Average True Range as shown below:
What's its purpose?
Essentially, a stock (or any other instrument) experiencing high volatility will have a higher ATR, while a low-volatility stock will be characterised by a lower ATR. This being the case, the ATR is clearly a volatility indicator, though it can be incredibly useful at confirming entry and exit points when combined with other indicators. Since it was developed as a more accurate measure of the daily volatility of an asset, it is thus inherently more common among day traders and other short-term market participants. The indicator does not give any indication of price direction and is instead used primarily to measure gap-induced volatility and limit moves up or down.
How is it applied practically?
The most common use of the ATR is as an exit method, one that is particularly versatile as it is not dependent upon how the entry decision was made. There is a popular method known as the "chandelier exit", which was developed by Chuck LeBeau. This exit involves placing a trailing stop-loss order under the highest high the instrument has reached since you entered the trade. The distance between the highest high and the stop level is defined as some multiple times the ATR. For example, we can subtract three times the value of the ATR from the highest high since we entered the trade and place a stop loss here. Naturally, this isn't a fool-proof method, but in day-trading, not much is.
If we want to use it as a breakout signal, then we need to combine it with other indicators like the RSI. As the ATR doesn't tell us which direction the breakout will occur, we need a trend confirmation (i.e., whether the given stock is overbought or oversold) in order to pick a direction for the trade. Let's look at that same Google chart now with both the ATR and RSI overlaid:
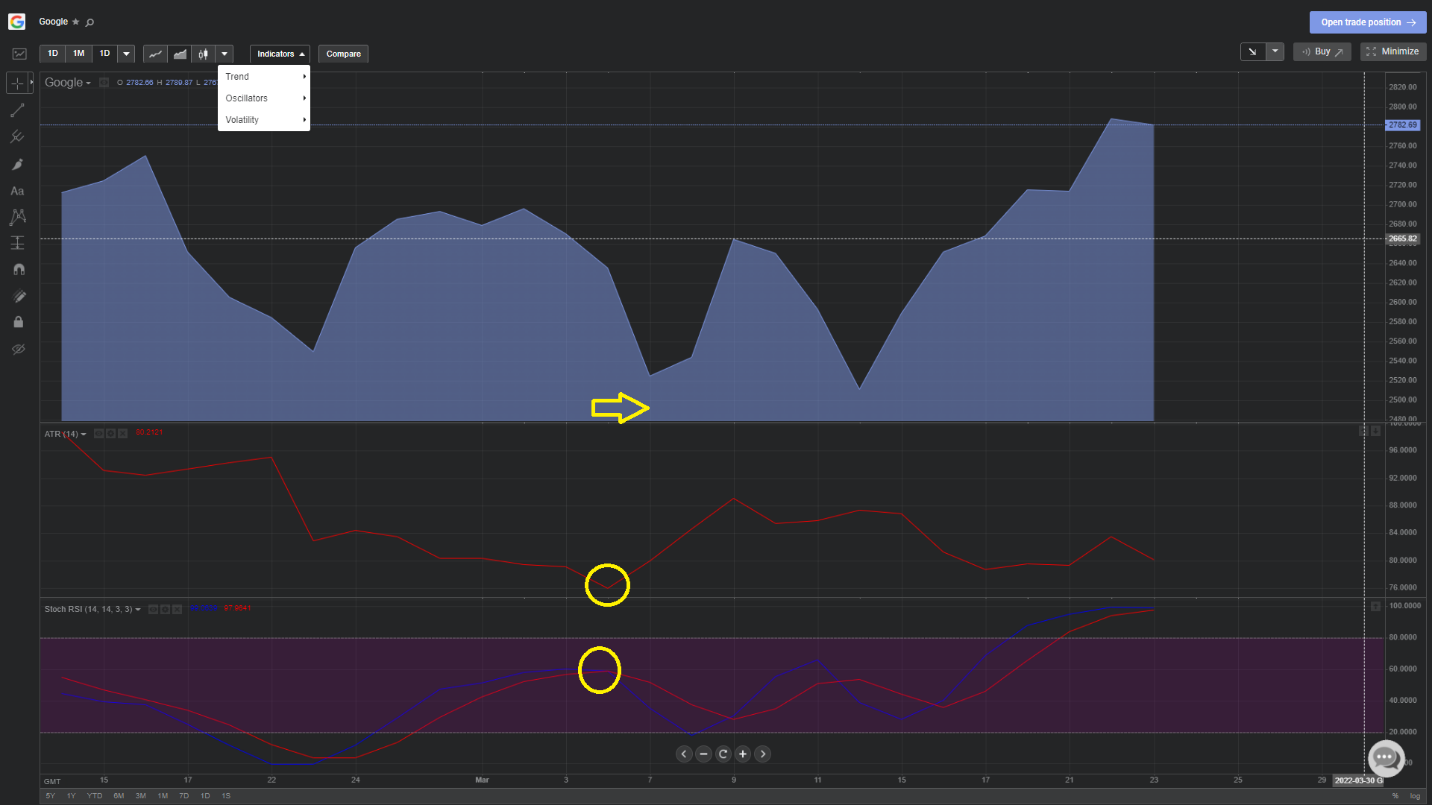
There are a few signals, but the single clear one is definitely high-quality. Notice the low point on the ATR below the main chart (circled in yellow)? This wouldn't be particularly useful on its own, but combine it with the RSI, and the signal becomes a strong one. Here, not only is the ATR at a low, the RSI is signalling overbought. Since the price is still at a low despite significant buyer presence, we can expect a powerful leg up in the near term. Lo and behold, just one day later, a vigorous move to the upside is initiated.
Keep on learning with Libertex
Like all the technical analysis tools examined in this segment, we're not suggesting that this strategy is complete, perfect or flawless. However, it's certainly a good string to your bow and can help select opportune moments to sell or buy. All the indicators we've covered so far can be used in combination with one another for greater accuracy, and Libertex clients may try this out for themselves using a free Libertex Demo Account.